
Chapter 3
Introduction
Welcome to OmniPlan 3!
Thank you for choosing OmniPlan as your companion on the path to better project management. The app you’re about to explore is packed full of tools that handle the heavy lifting, number crunching, and visualization of your projects so you’re free to focus on the stuff that matters. With OmniPlan 3 we’ve carefully reconsidered every piece of the app from the inspectors to the Gantt chart to make it both more powerful and easier to use, and added tons of great new features to boot.
OmniPlan is ready to support, organize, and track your project’s progress whenever and wherever you need it — both on your Mac, and beyond. On iPhone and iPad, OmniPlan for iOS offers up-to-the-minute project editing, review, and presentation.
- OmniPlan for Mac (the subject of this manual) is available both on the Mac App Store and directly from The Omni Group.
- OmniPlan for iOS is available on the App Store as a Universal app that works on all of your iOS devices.
- Sync between versions is supported via Pub/Sub with the OmniPlan Pro upgrade for OmniPlan for Mac.
- OmniPlan for Mac requires OS X Yosemite, while OmniPlan for iOS requires iOS 9.
This manual is your guide to learning OmniPlan for Mac. You’ll learn to customize task and resource outlines to visualize, maintain, and simplify your projects. Break down tasks, optimize the required resources, control costs, and monitor your progress — all at a glance. And with OmniPlan Pro (a paid upgrade), you’ll access the features you need to take your multi-user and multi-project plans to the next level. As you go through your workday with OmniPlan you’ll notice that, in dozens of little ways, the app is ready to work better right along beside you.
How This Documentation is Organized
This manual that you have before you (either in OmniPlan itself, online, or in iBooks on your Mac or iOS device—or both) has been assembled in such a way that you’re provided with a complete tour of OmniPlan.
This introductory chapter provides an overview of the new features in OmniPlan 3, and explains just what this manual is all about. The few chapters following are a great introduction to the app, so if you’re new to OmniPlan proceeding through from the start isn’t a bad idea.
If you just need a quick update on what’s new in the current release, see the Release Notes in the Help menu for a list of recent changes.
To help guide you through the documentation and better learn about all things OmniPlan, here’s a list of the chapters that you’ll find up ahead:
- Chapter 1, Introduction
- The chapter you’re perusing right now. Here you’ll find notes on the newest OmniPlan features, an introduction to the app, and guidance on how to get the most out of this manual (we think the EPUB version is a great way to read the docs).
- Chapter 2, Getting to Know OmniPlan
- This chapter dives right in and gives you a top-down overview of OmniPlan’s user interface. You’ll learn about toolbar, the app’s five views (Task, Resource, Calendar, Network, and Styles), and, of course, the inspectors. Nothing too deep; just the basics to get you rolling — it’s a great place to start becoming familiar with OmniPlan’s various bits and pieces.
- Chapter 3, Working in OmniPlan: A Tutorial
- If you’re eager to get your first OmniPlan project up and running, this is the place to start. The tutorial guides you through the process of setting up and maintaining a project, from creating your first task to reaching the last milestone. After you’ve worked through it you’ll have the tools you need to build your own project from the ground up.
- Chapter 4, Maintaining Your Project
- After your project is up and running, OmniPlan helps you keep it carefully tended — like a bonsai tree — to help it mature into its final form. When unexpected circumstances arise, adjusting the project will keep it shepherded toward the goal. This chapter explains violations, scheduling and leveling, establishing and working with baseline schedules, catching up and rescheduling tasks, and other tools for ensuring your project accurately reflects the real world.
- Chapter 5, Collaboration and Multi-Project Review (PRO)
- OmniPlan Pro offers additional tools for more complex project arrangements. If you work on projects that are geographically distributed or have more than one contributor, or you’re responsible for multiple simultaneous projects, the collaboration (Pub/Sub) and multi-project dashboard features are tremendously helpful for managing even the most complex project states. This chapter explains how!
- Chapter 6, Working in Task View
-
Understanding tasks and the relationships between them is key to using OmniPlan to the fullest. In this chapter you’ll learn — in detail — how to use Task View to model the work you need to accomplish so you can monitor and update its progress with confidence, including sections on task grouping and splitting, hammock tasks, mastery of the Gantt chart, and more.
Since they live as optional columns in Task View, this chapter also introduces OmniPlan’s Earned Value Analysis tools to OmniPlan Pro users.
- Chapter 7, Working in Resource View
- If tasks are a project’s building blocks, resources are its lifeblood. Accurately assessing and organizing your resources will help your project run at peak efficiency, and this chapter delves into how Resource View can help you do just that with tips on creating and assigning resources, making resource groups, tracking your project from a resource-based perspective, and the concepts of duration and effort.
- Chapter 8, Working in Calendar View
- Tasks and resources are united in the calendar view, where schedules can be set for every aspect of the project to make sure goals are met on time. Establishing the working hours for your project, and universal and individual exceptions to them, are covered in detail here.
- Chapter 9, Working in Network View
- OmniPlan’s Network View provides a way to visualize and develop your project as a node-based diagram of tasks and groups (similar to a PERT chart). It’s great for rapidly iterating on a new project or getting a strong representation of the relationships between tasks, and this chapter explains how to get the most out of this new view.
- Chapter 10, Working in Styles View
- OmniPlan includes a professional-grade default set of fonts and styles designed to clearly convey information about your project. The app also offers a full set of tools for customizing your document’s presentation, from styles affecting the entire project down to individual bar colors in the Gantt chart. Styles View is where you’ll go to customize the visual side of your project at a high level, and this chapter explains how it’s done.
- Chapter 11, Using the Inspectors
- As you move between views in OmniPlan, the inspectors bring continuity to your experience and provide detailed access to controls for whatever aspect of the project you’re working on at the moment. This chapter details the settings each inspector provides for your Project Info, Milestones, Tasks, Resources, Styles, Custom Data, and Attachments.
- Chapter 12, Importing and Exporting
- OmniPlan contains all the tools you need to execute projects at all levels of complexity, but sometimes external requirements call for interaction outside the OmniSphere. Luckily, OmniPlan is great at those too! Here you’ll find details on all the formats the app can understand and export, as well as details on Microsoft Project support present in OmniPlan Pro.
- Chapter 13, Reporting and Printing
- When it comes time to share your project with colleagues or the outside world, OmniPlan Pro’s new and improved reporting interface makes it stand out from the crowd. This chapter covers the finer points of generating reports using the HTML themes included with OmniPlan, and provides tips for modifying them or creating your own. Printing reports — to paper or PDF — is also fully supported.
- Chapter 14, OmniPlan Preferences
- This chapter covers a variety of customization options to get OmniPlan working the best for you. Within OmniPlan Preferences you’ll find custom controls for data entry, display of times and dates, document and HTML template management, server repository account settings (in OmniPlan Pro), and options for when and how OmniPlan should check for updates to itself.
- Chapter 15, Menus and Keyboard Shortcuts
- This chapter includes a complete list of the commands found in OmniPlan’s menus, their associated keyboard shortcuts, and a brief description of each. This is a handy reference if you find yourself wondering what a specific function does.
- Chapter 16, Glossary
- The Glossary contains an alphabetical list of special terms you’ll encounter throughout the app, this documentation, and other project management resources you might be familiar with. If you’re just starting out in project management or you’re curious about how OmniPlan implements certain concepts, this is a great chapter to check.
- Chapter 17, Managing Your Omni Licenses
- For the most part, you should never have to worry about your Omni license, particularly if you’ve purchased OmniPlan from the Mac App Store. If you purchased OmniPlan from our website, however, you need to enter specific information from the license email you received from us.
- This brief chapter walks you through the process of adding your license info in OmniPlan, shows you how to remove a license, and even tells you where we “hide” the license on your Mac just in case you ever need to send that to us or transfer it to that brand new Mac you’ve purchased.
- Chapter 18, Getting Help
- If you ever get stuck when working on something in OmniPlan, or if you have a problem with the app’s license, or you just want to tell our Support Humans and the DocWranglers what an awesome job they’re doing, feel free to get in touch. This chapter points you to all of the resources we have available: Support Humans, Support Articles, Videos, and Documentation.
If you’re currently using other versions of OmniPlan (iOS or earlier Mac versions) and want to get up to speed as quickly as possible with projects already in progress, see the Features of OmniPlan 3 section of this chapter. For projects with multiple contributors, see Collaboration and Multi-Project Review (PRO) for details on syncing your projects.
Features of OmniPlan 3
The newest version of OmniPlan has been redesigned from the ground up to complement the ways you work. From beginning your first project to completing its final task you’ll find things throughout the app — as well as brand new features — that improve the experience over previous versions. If you’re new to OmniPlan, you’re in for the best app that it’s ever been.
In addition to the updated look and feel of interactions throughout the app, the following brand new features have been added in OmniPlan 3:
The Great Inspector Redesign
The look of the inspectors has been updated to a clean new visual style consistent with design trends in Apple’s most recent versions of macOS. And as with Omni’s other Mac apps, selecting an item in your current view smartly selects the inspector most relevant to your selection.
Beyond these interaction improvements, the inspectors have been reorganized into discrete categories that live in tabs across top of the inspector sidebar. The largest change comes to the Project inspectors, with styles governing the entire project moved out of the inspectors to the new Styles view.
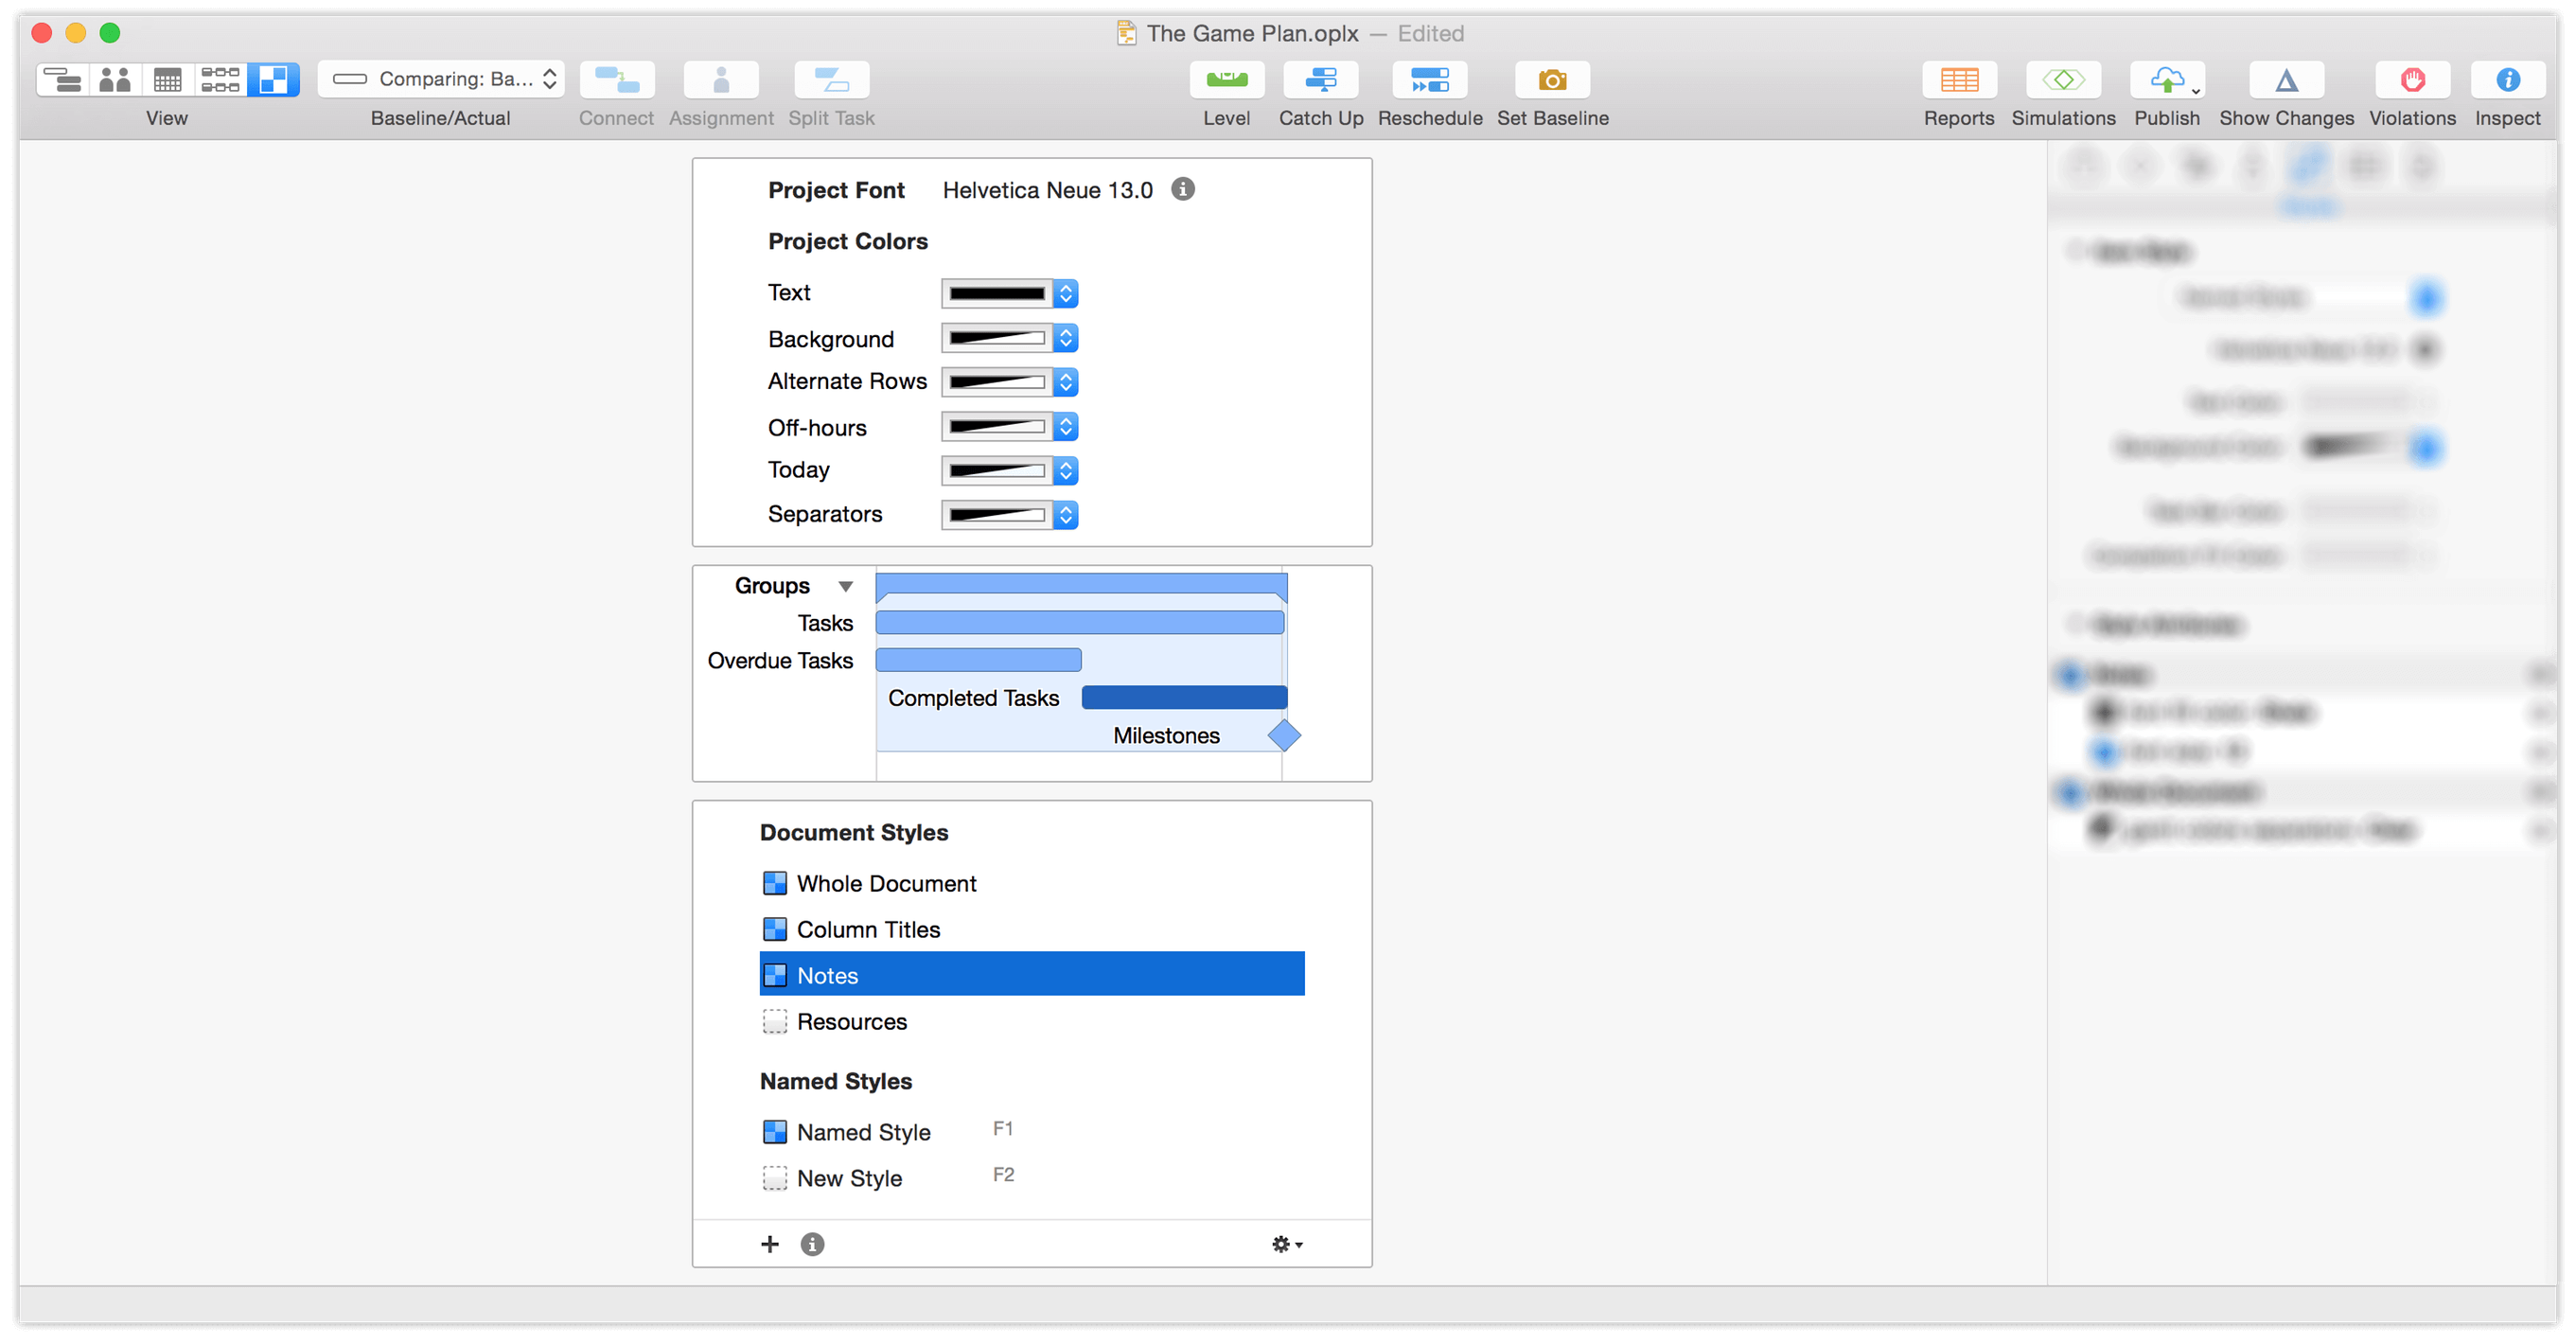
Styles View
One of our goals in OmniPlan 3 is to prioritize how you want your project set up, so it’ll look just as great as the precious information it holds. The new Styles View treats the overall look of your project as a peer of other views on your data, and teams up with the Style inspector to edit the appearance of the Gantt chart, text, columns, and rows of your document to your exact specifications.
Try out Styles View by clicking the rightmost button in the view switcher in the toolbar.
Network View
#network-view is a new way to look at your project, showing it as a diagram that emphasizes the relationship of dependencies between tasks rather than the chronological view presented by the Gantt chart. You can try Network View by clicking the fourth button in the view switcher in the toolbar.
Meeting Task Type
The new Meeting task type is useful when an entire project team (or subset of the team) is required to work on a task simultaneously. When a task is set as a meeting, it will not be scheduled until all of the resources assigned to it are available.
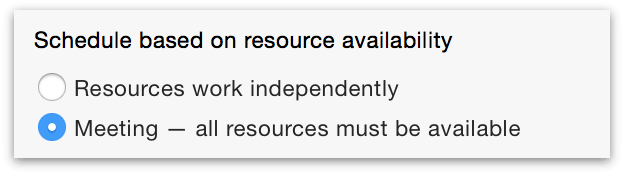
Whether multiple resources work on a task independently or in the meeting format is determined by a switch in the Resource Allocation section of the Task inspector.
Introducing OmniPlan Pro
Many OmniPlan users find that the tools to create, maintain, monitor, and complete a project — all features of the base app — fully encompass their needs. If your project management system requirements are more complex, we offer a package of additional tools designed to extend OmniPlan to unprecedented levels of flexibility, extensibility, and power.
The suite of OmniPlan Pro upgrade features includes:
Multi-Project Dashboards
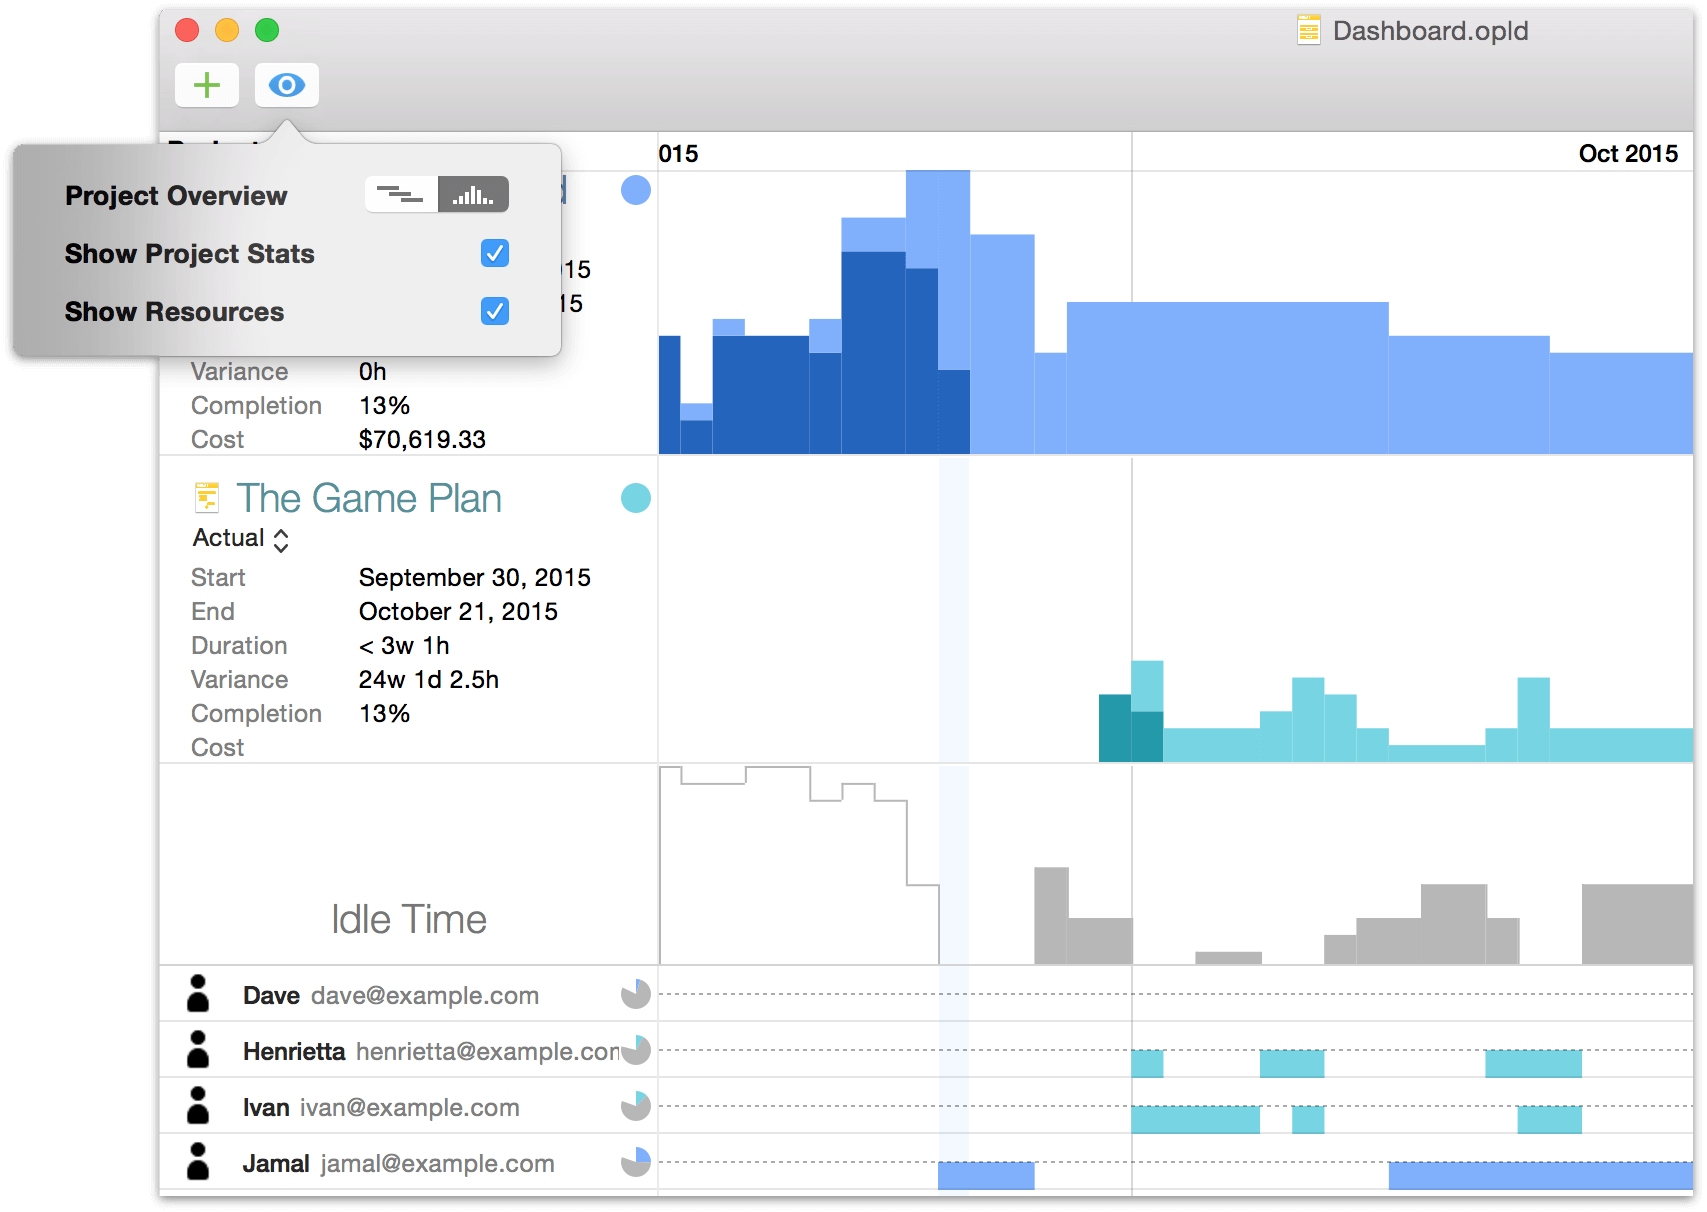
In OmniPlan 3 Pro, get a customizable overview of multiple interconnected projects with the Multi-Project Dashboards feature. Choose File ▸ New Dashboard to create a new project group; then drag and drop OmniPlan project files onto the view, and they’ll be magically added for your perusal.
Monte Carlo Simulations and Effort Estimation
Another new feature in OmniPlan 3 Pro is the ability to estimate on-time project and milestone completion using Monte Carlo simulations. These are a great aid for planning ahead, providing tip-offs for when resources should be shifted to ensure on-time project completion. The simulation package also provides a handy Auto-Estimate Effort tool for tasks where effort isn’t already assigned, making completion forecasts quick and easy.
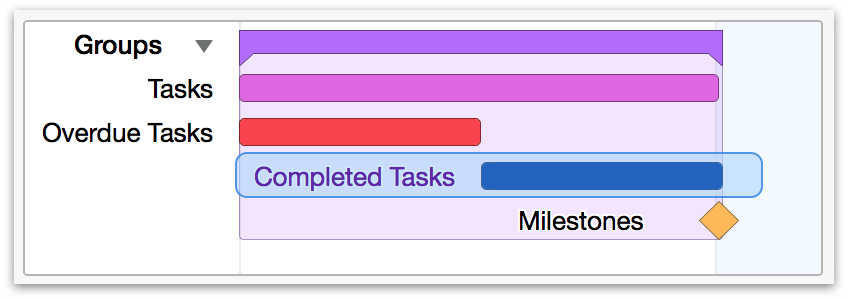
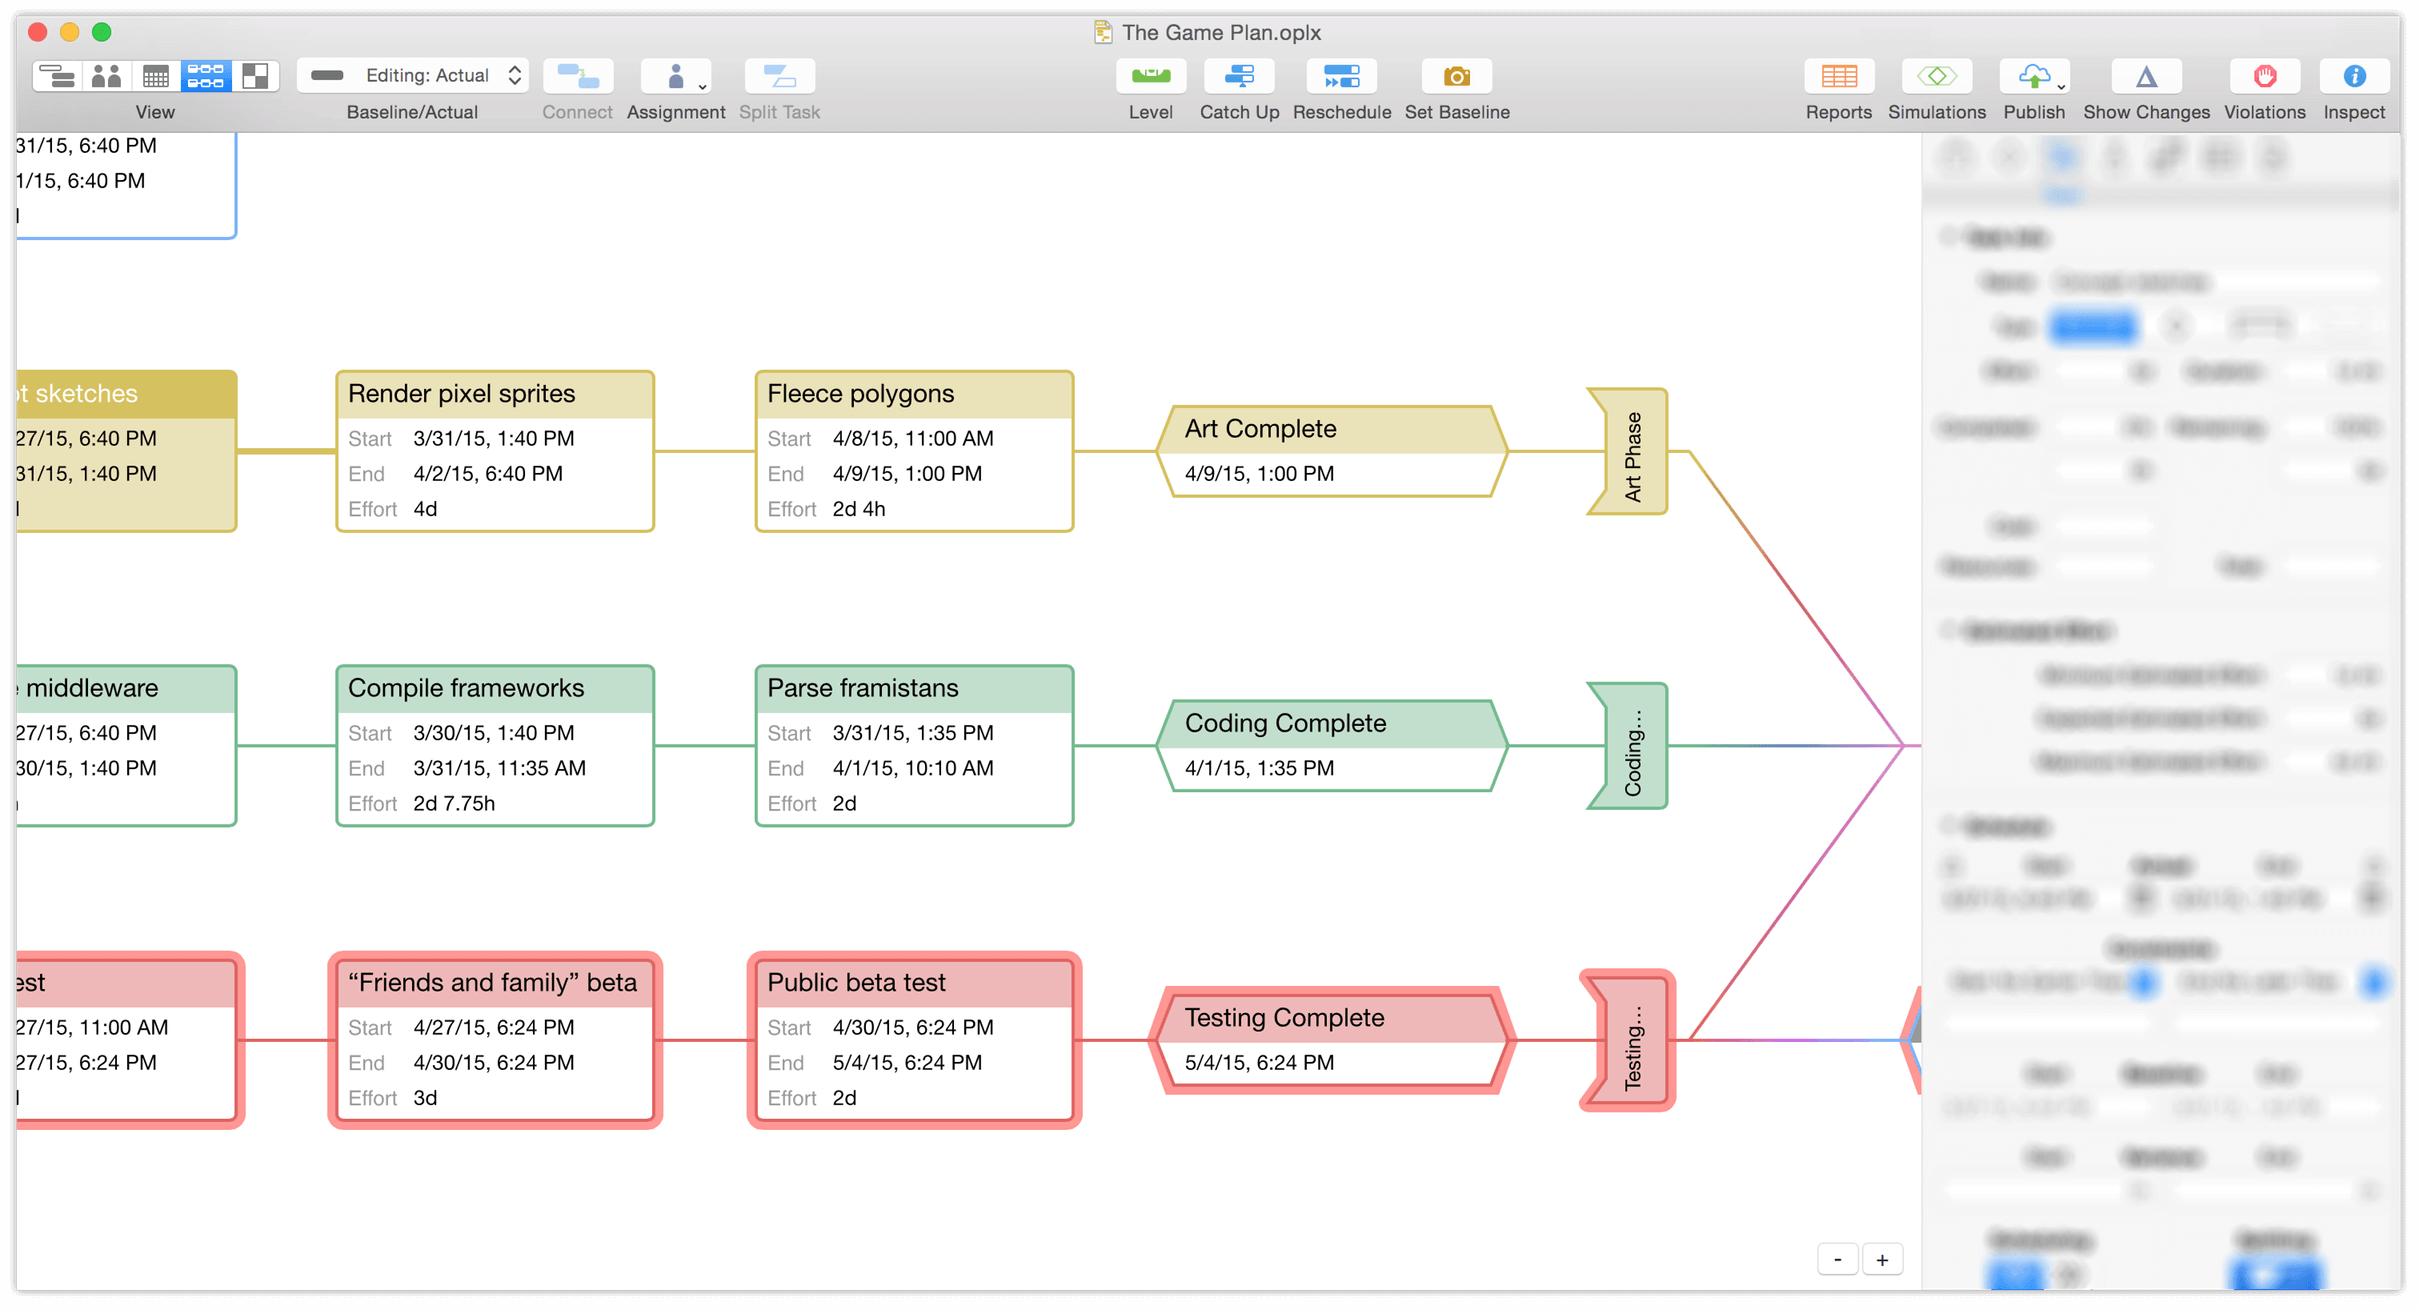
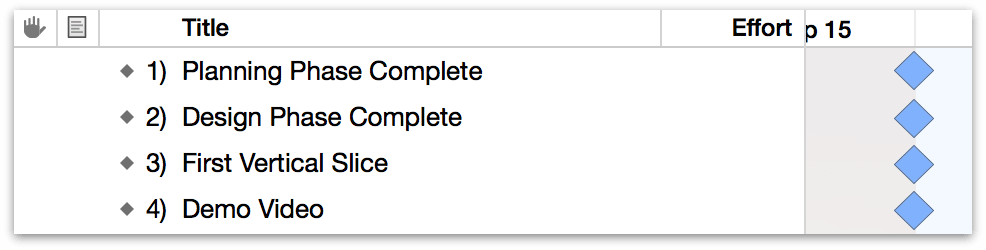
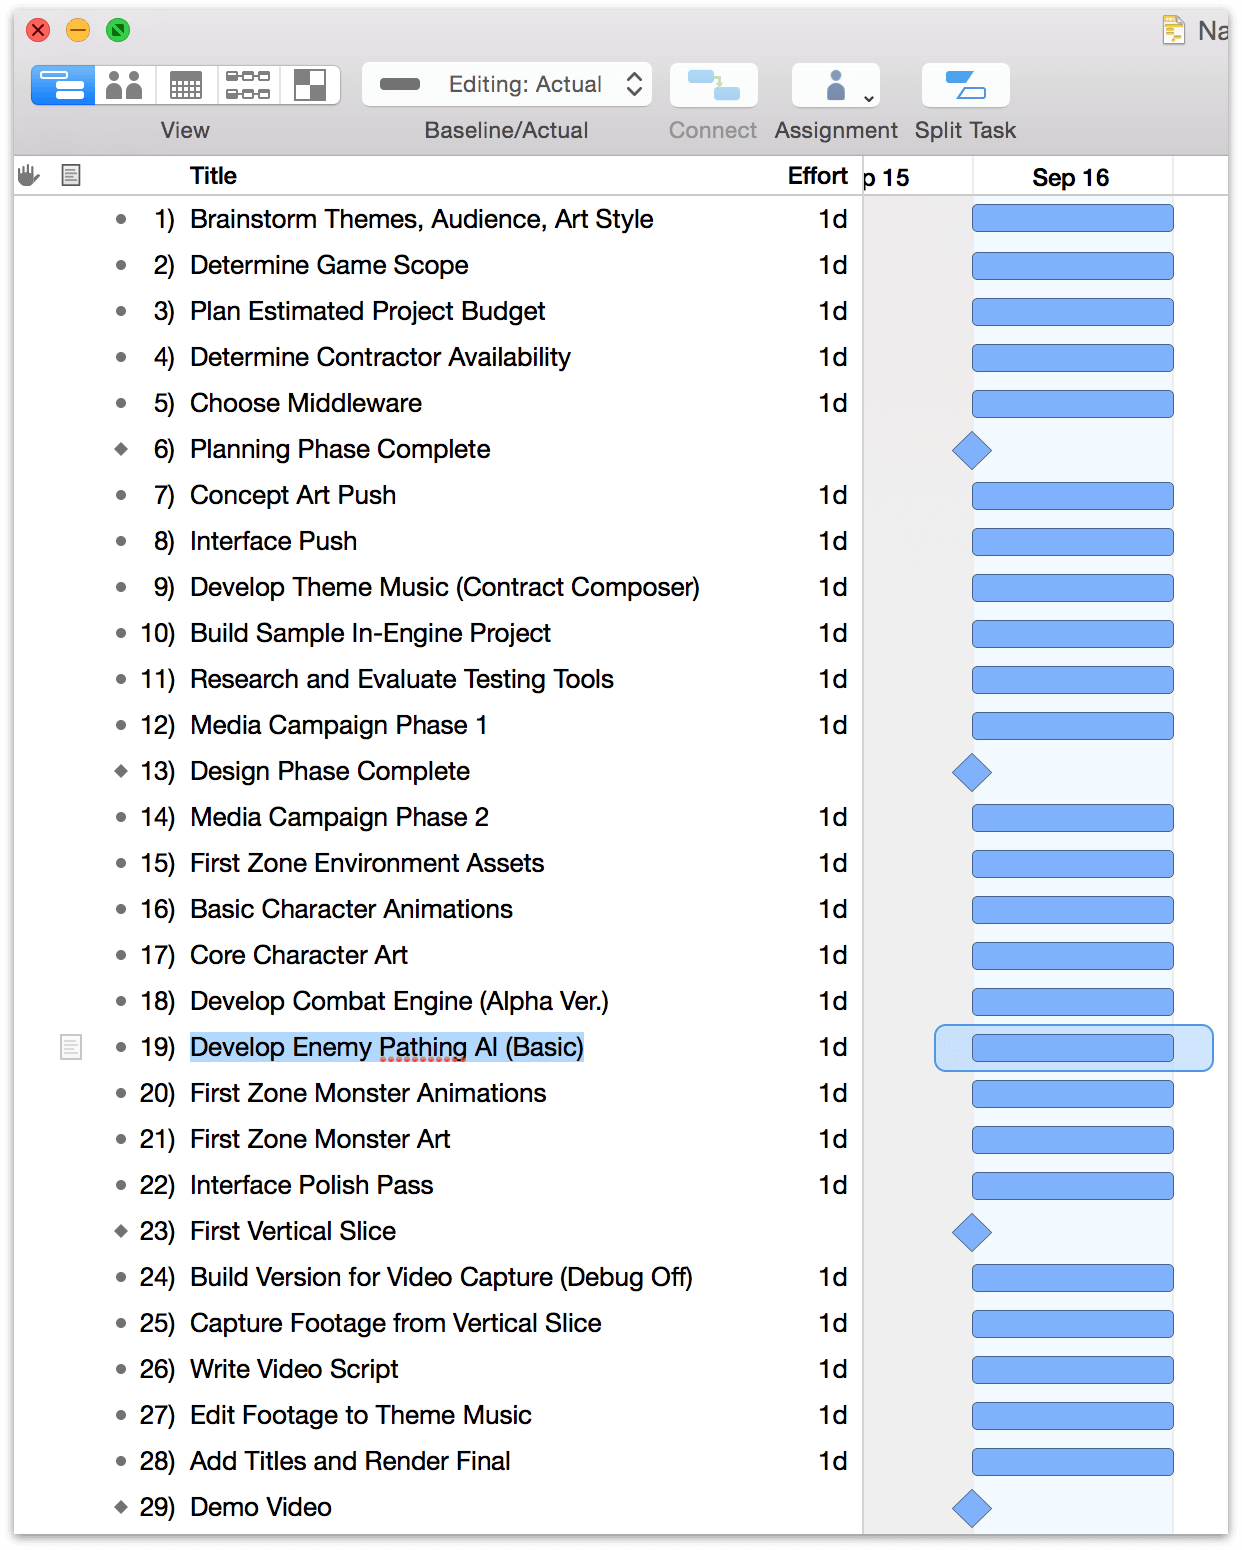
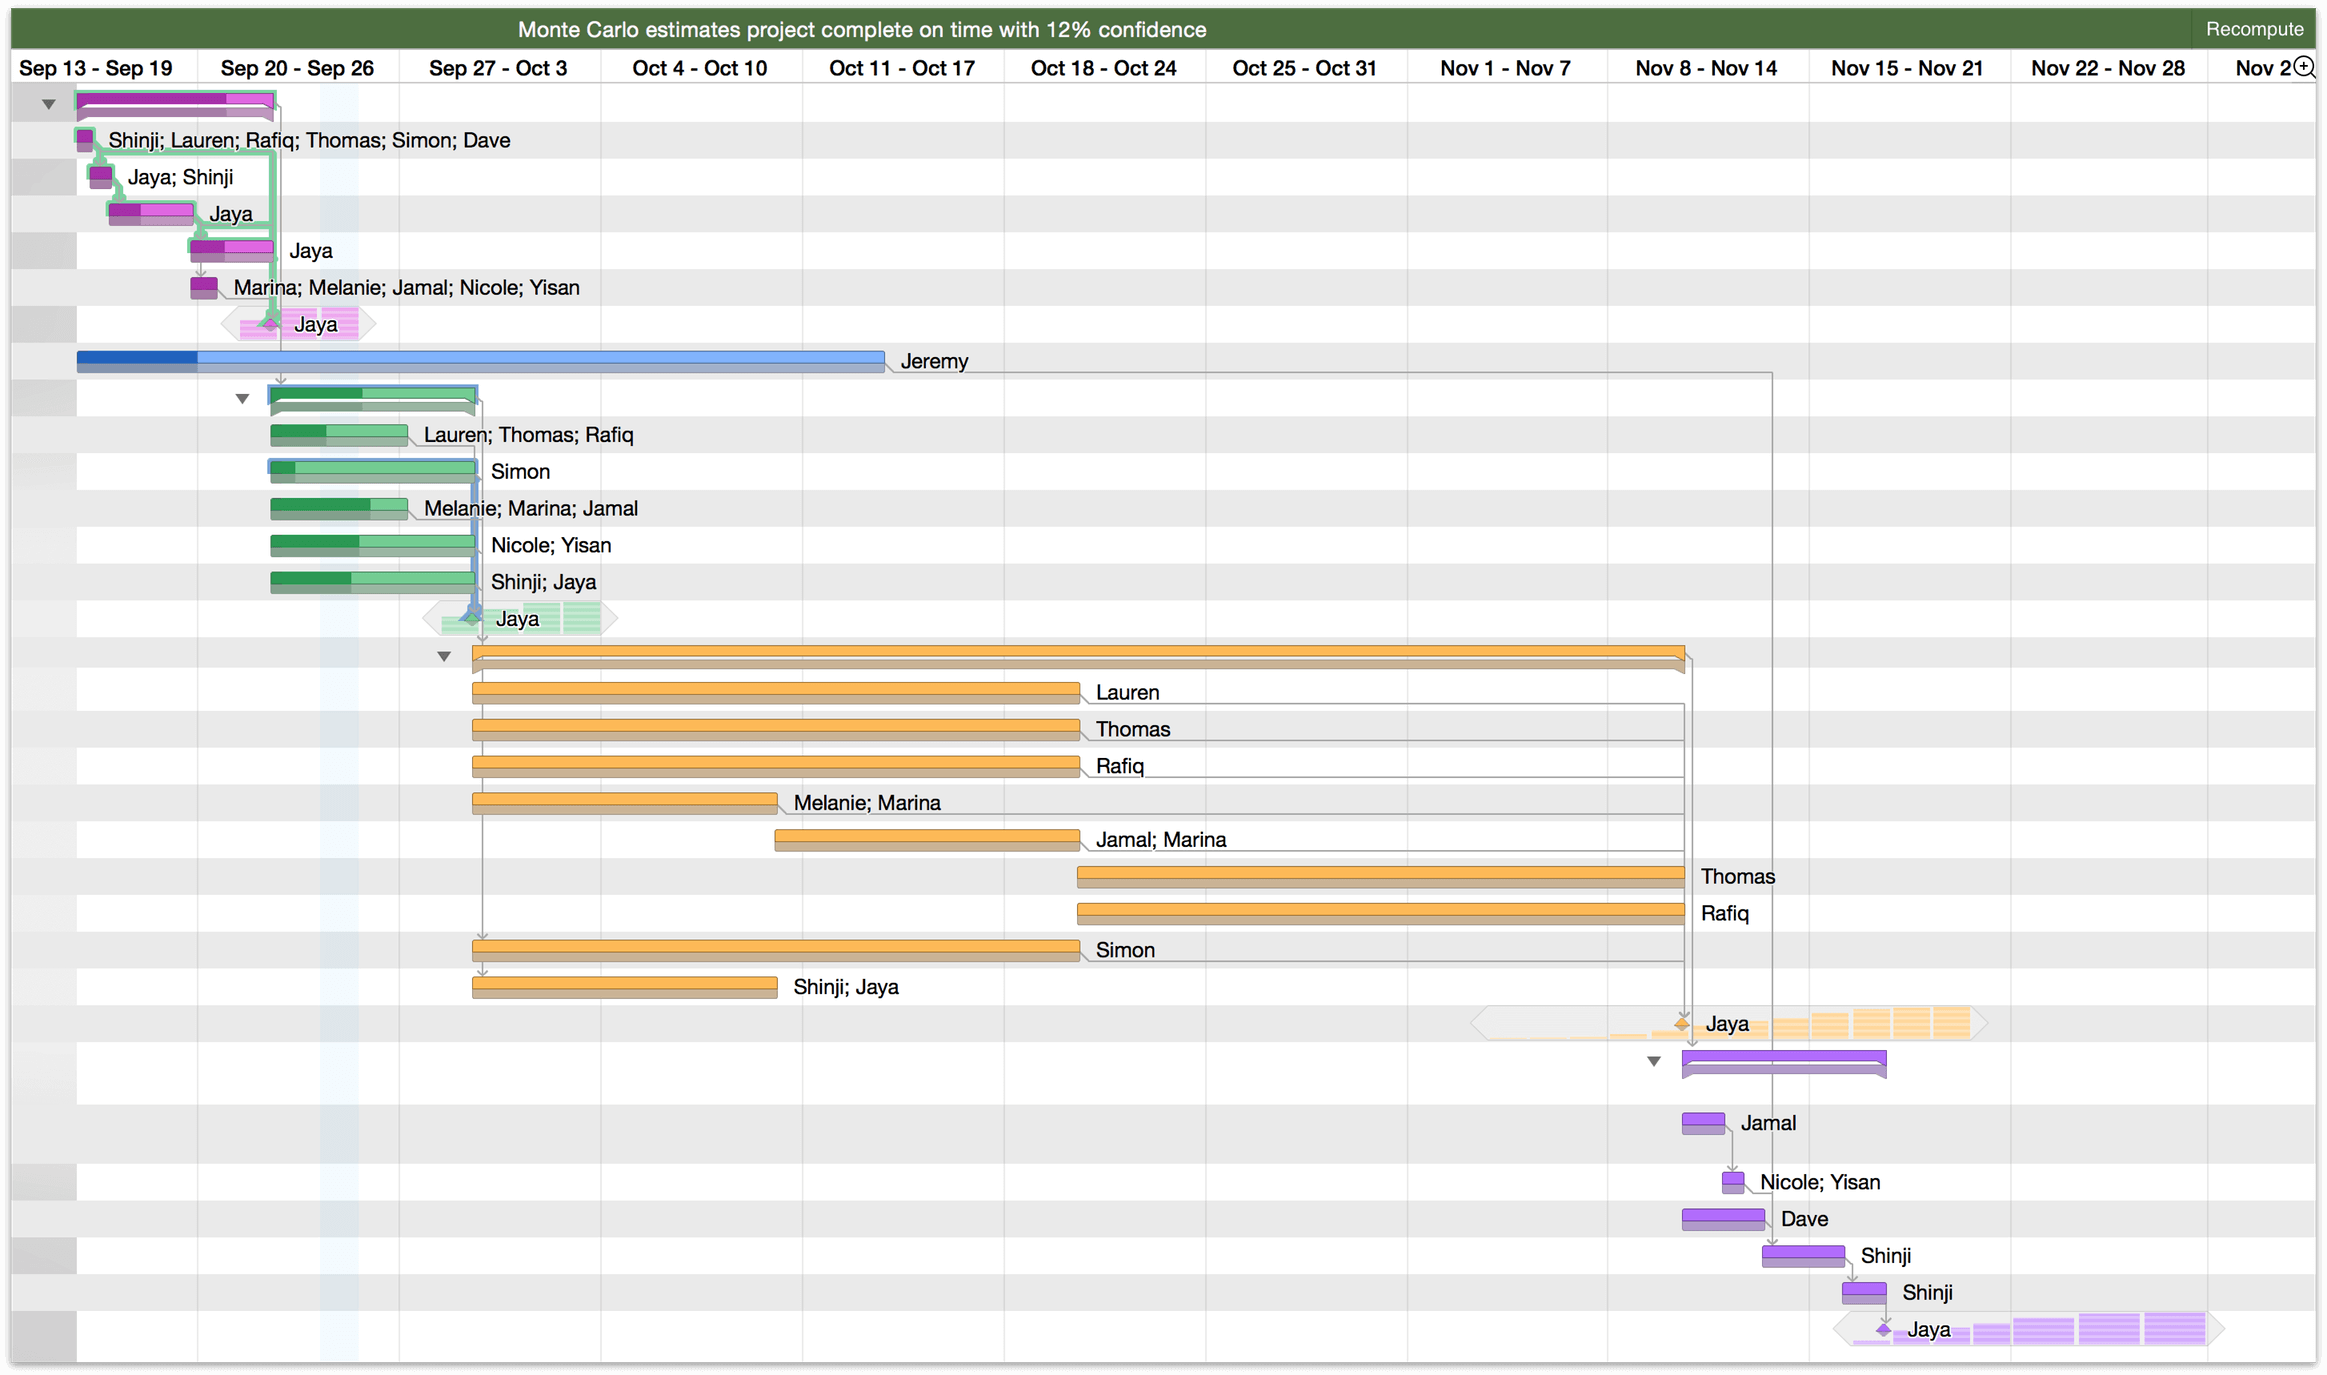
Upon running a simulation, a set of horizontal bars appears on days surrounding each milestone (represented as a small diamond); one bar equals 20 percent confidence that the milestone will be complete on that day (5 bars on a day means that according to the simulation, a milestone is 100% likely to be completed on that day). Hover over the bars on each day for greater detail.
Earned Value Analysis
OmniPlan 3 Pro offers several new custom column types in Task View that are useful for tracking and managing the budget of your project. This full implementation of the Earned Value Analysis method brings greater oversight and control over project expenses.
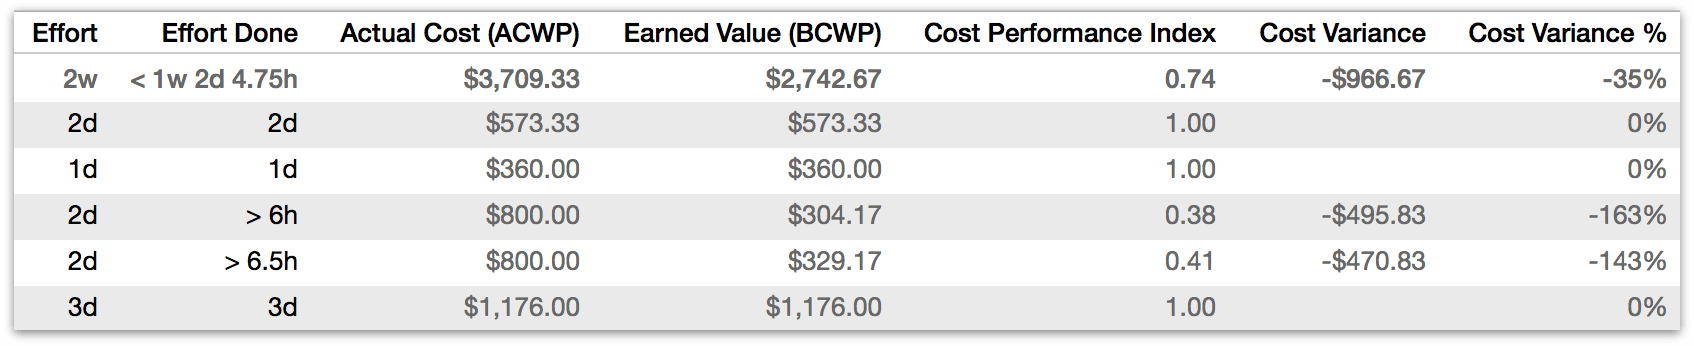
When paired with the new reports interface, keeping tabs on the cost of your project is easier than ever before.
New HTML Reports Interface
With OmniPlan 3 Pro, we’ve prepared some great new reporting templates for your project that you can use to print or export your data with a more polished and easily readable look.
To preview your project with any of the available templates, use the Reports button in the toolbar or choose File ▸ Reports... to access the new HTML reports interface. You can print your report with the chosen template directly from the interface.
Returning Features in OmniPlan Pro
And, if you are a returning OmniPlan Pro customer (thank you!), you’ll find the following Pro features are still around:
- Microsoft Project Import and Export — consistently updated interoperability with Microsoft’s project management software.
- Publishing, Subscribing, and Change Tracking — multi-user sync and collaboration across one or many projects.
- AppleScript Support — automate common actions and extend beyond the app with OmniPlan’s AppleScript library.
If you’re an existing user of OmniPlan, you’re on the Pro upgrade path already. If you’re a new user considering OmniPlan, you now have the option of the Standard version with all the things you need to get started, or the Pro version that includes the features described above.
The OmniPlan Pro upgrade is available as an in-app purchase via the Mac App Store if you purchased it there, or from Omni’s online store.
How to Try Pro
You can download the trial version of OmniPlan from our website. At any time throughout the trial period you can switch between Standard and Pro by choosing OmniPlan ▸ Free Trial Mode ▸ Try Pro/Standard Edition to compare features and see which is the right fit for your needs.
Likewise, if you purchased OmniPlan 3 Standard from the Mac App Store you can download the trial version from the Omni website and run it side by side to compare features.
If you own a Standard license from the Omni store and would like to try Pro, if you’re still within the trial period you can temporarily delete your license (choose OmniPlan ▸ Licenses) to revert to trial mode and give Pro a try. If you’re outside the trial period, contact us and we’ll be happy to provide a Pro trial license.
Unsure whether you have Pro installed? Choose OmniPlan ▸ About OmniPlan for details on the current version and licensing status of the app.
Using This Book
One of the beauties of having OmniPlan’s documentation available in electronic form is that it’s always available whenever you need it. We have built the documentation right into the Help menu. We have put all of the documentation on our website where it can be searched and bookmarked. And we’re continuing the ongoing trend of creating EPUB versions of the docs and making them freely available on the iBooks Store.
Get the Ebook
![]() Our preferred method of delivering the Help docs is via the iBooks Store in EPUB format. The documentation there is the same documentation you’ll find on our website and bundled within the app.
Our preferred method of delivering the Help docs is via the iBooks Store in EPUB format. The documentation there is the same documentation you’ll find on our website and bundled within the app.
The advantage of downloading the OmniPlan 3.7 for Mac User Manual from the iBooks Store is that whenever we update the docs for a new version of OmniPlan, you’ll receive a notification in iBooks telling you that there’s an update waiting for you. And the big win of EPUB over PDF is that any notations or bookmarks you make in the book carry forward to new versions of the documentation.
Tell Us What You Think
We’re constantly working on updates for our documentation. Whether it’s CSS work, correcting the occasional typo (yeah, they do sometimes slip through), or adding details or clarification for a specific feature based on something we’ve heard from a customer, we’re always trying to make our documentation better and more useful for you.
If you have any specific comments you’d like to send us about the documentation, please do. You can drop us an email message via our Support queue, or you can ping us on Twitter; we’re @OmniWranglers.
Finally, we’d like to thank you for taking the time to read the docs.
Chapter 101
Getting to Know OmniPlan
When you first launch OmniPlan you’re presented with a fresh new OmniPlan document, ready for cultivating to match the precise needs of the project at hand. What follows is an introduction to the various pieces of the app that you’ll be interacting with to craft a project to your specifications. To jump right in and get to work, see the next chapter, Working in OmniPlan: A Tutorial.
The Toolbar
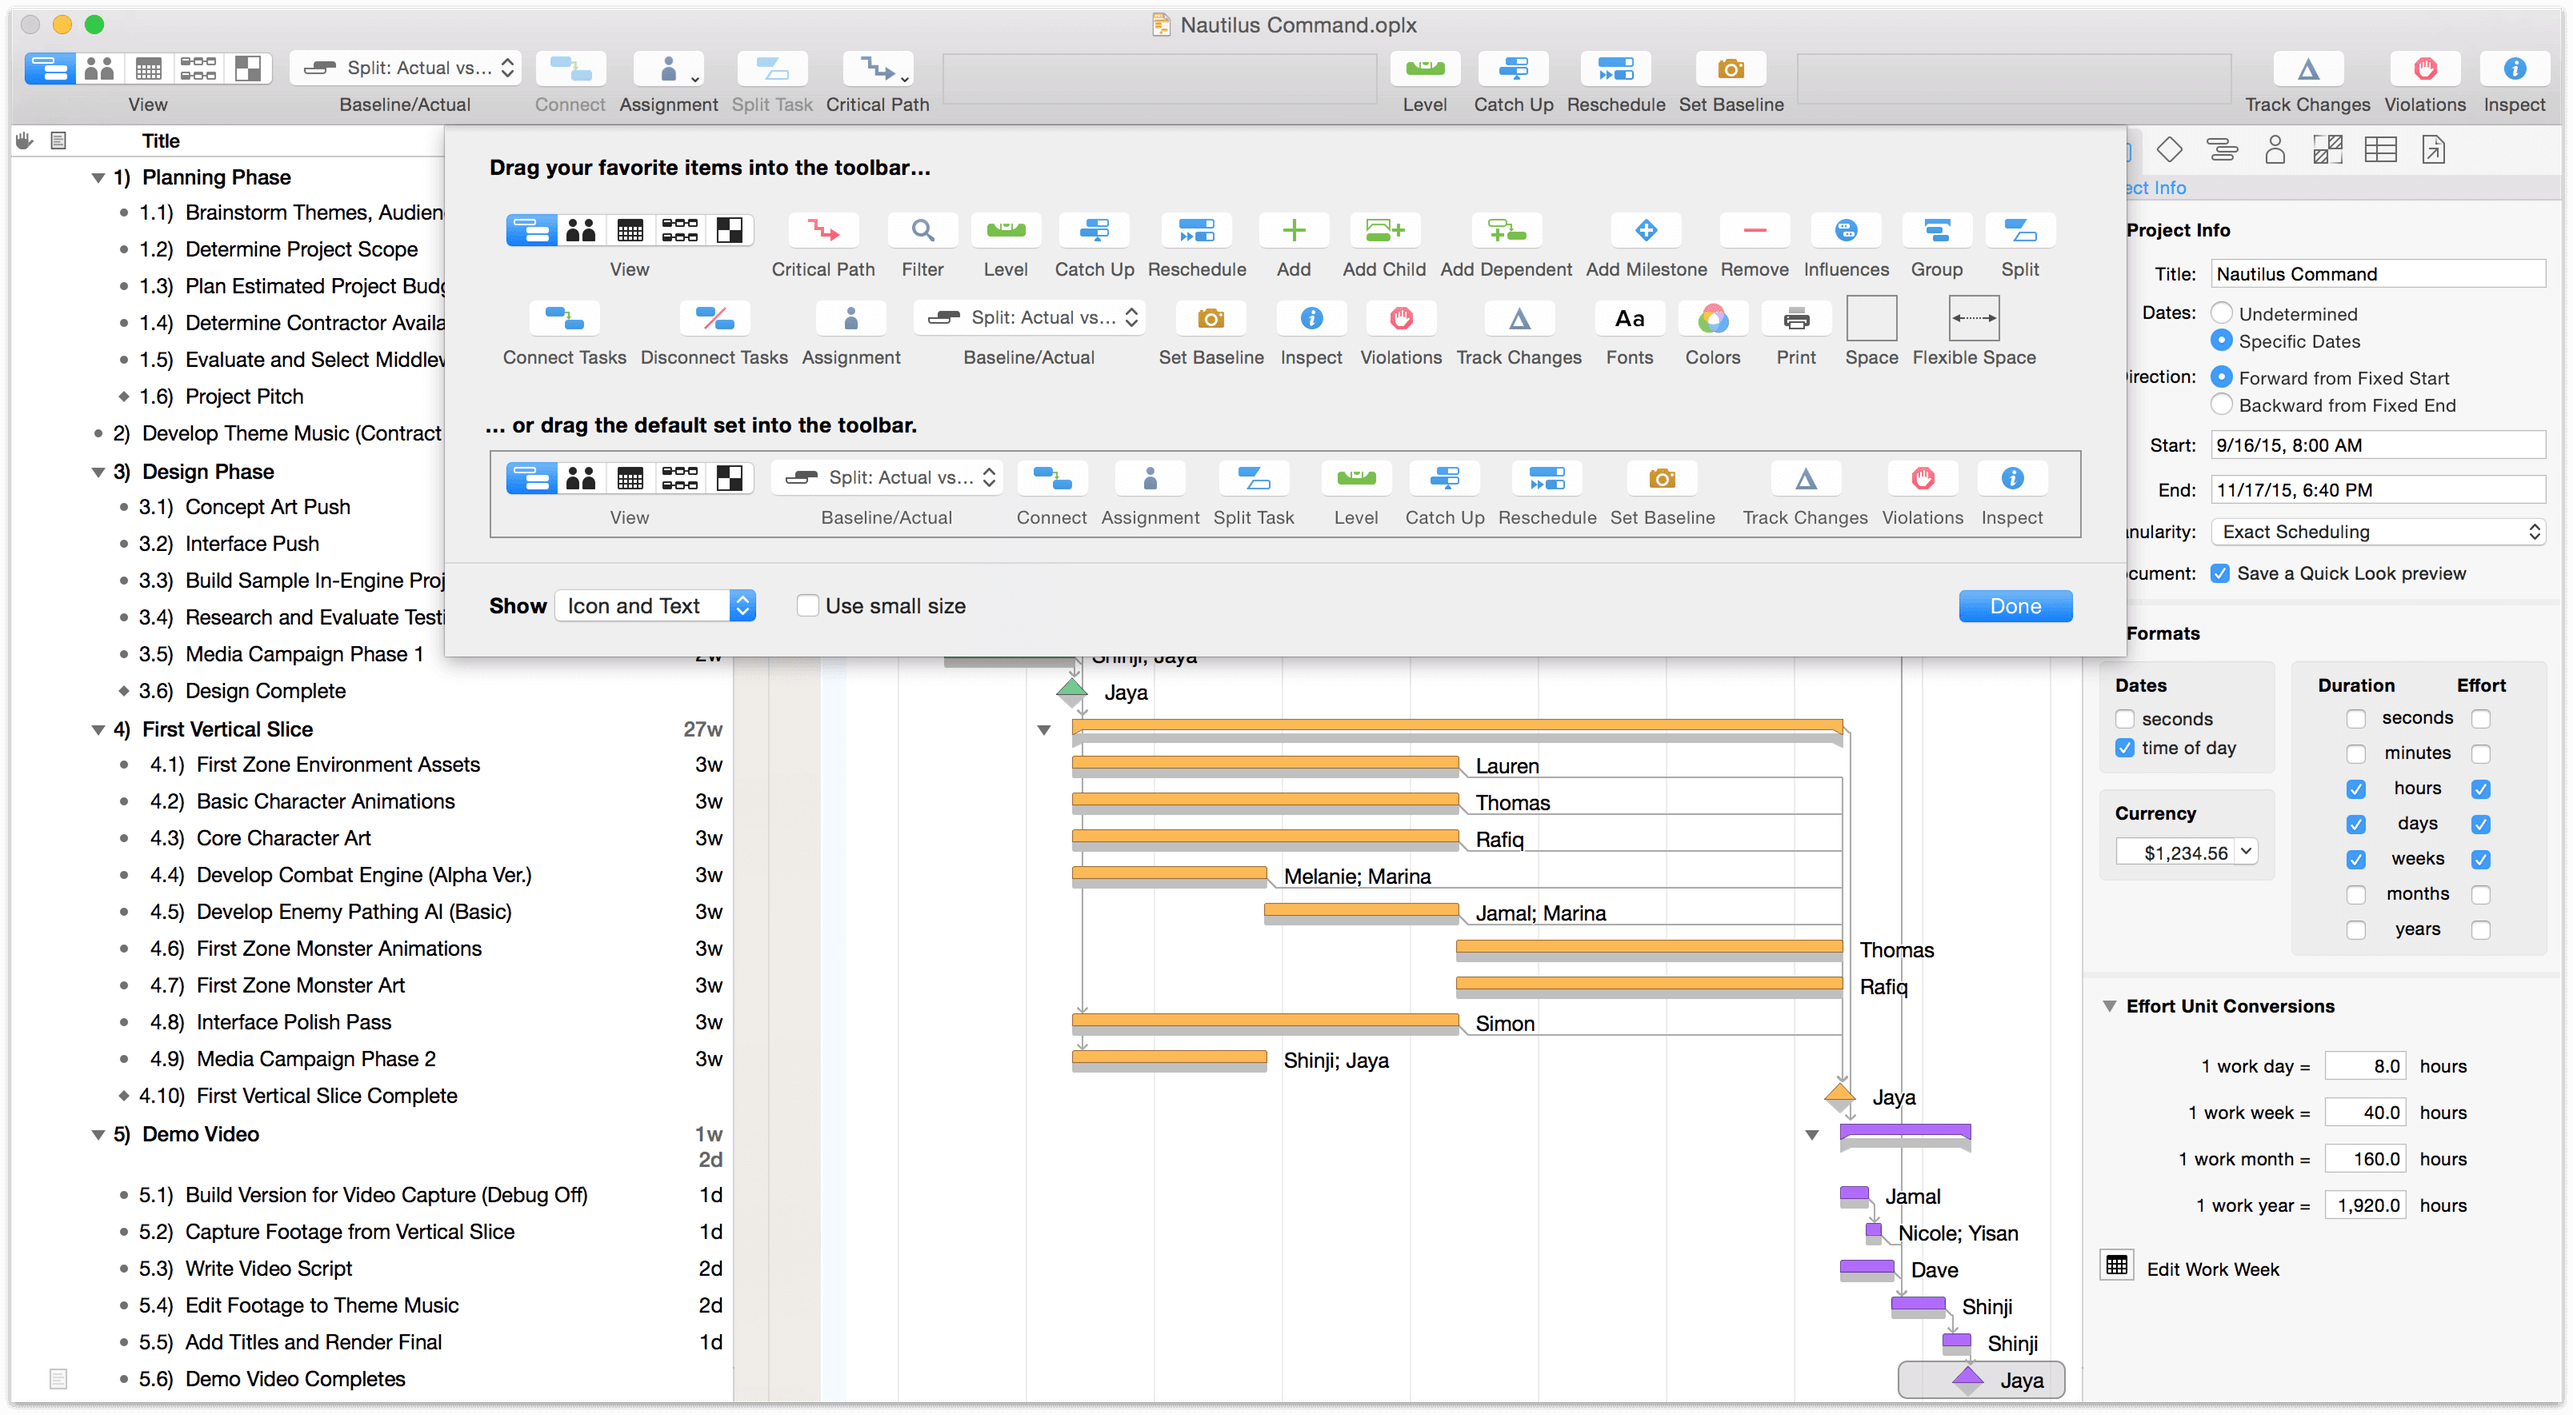
Like most applications, the toolbar has buttons for commands you use frequently. We’ve included a default set of controls that many OmniPlan users find convenient, but you can use View ▸ Customize Toolbar to add and remove whichever ones you like.

The Overview
The toolbar has an optional companion in the Overview, a horizontal bar with a condensed view of the Gantt chart that appears when you choose View ▸ Show Overview. The overview is a great way to get a quick survey of your entire project no matter which view you’re in.

In Task and Resource Views, the Overview also offers an alternate control for browsing through your project — just click and drag the selection box to scroll through the main view’s Gantt chart or resource timeline.
Task View
Click the first button in the view control to see the Task View.
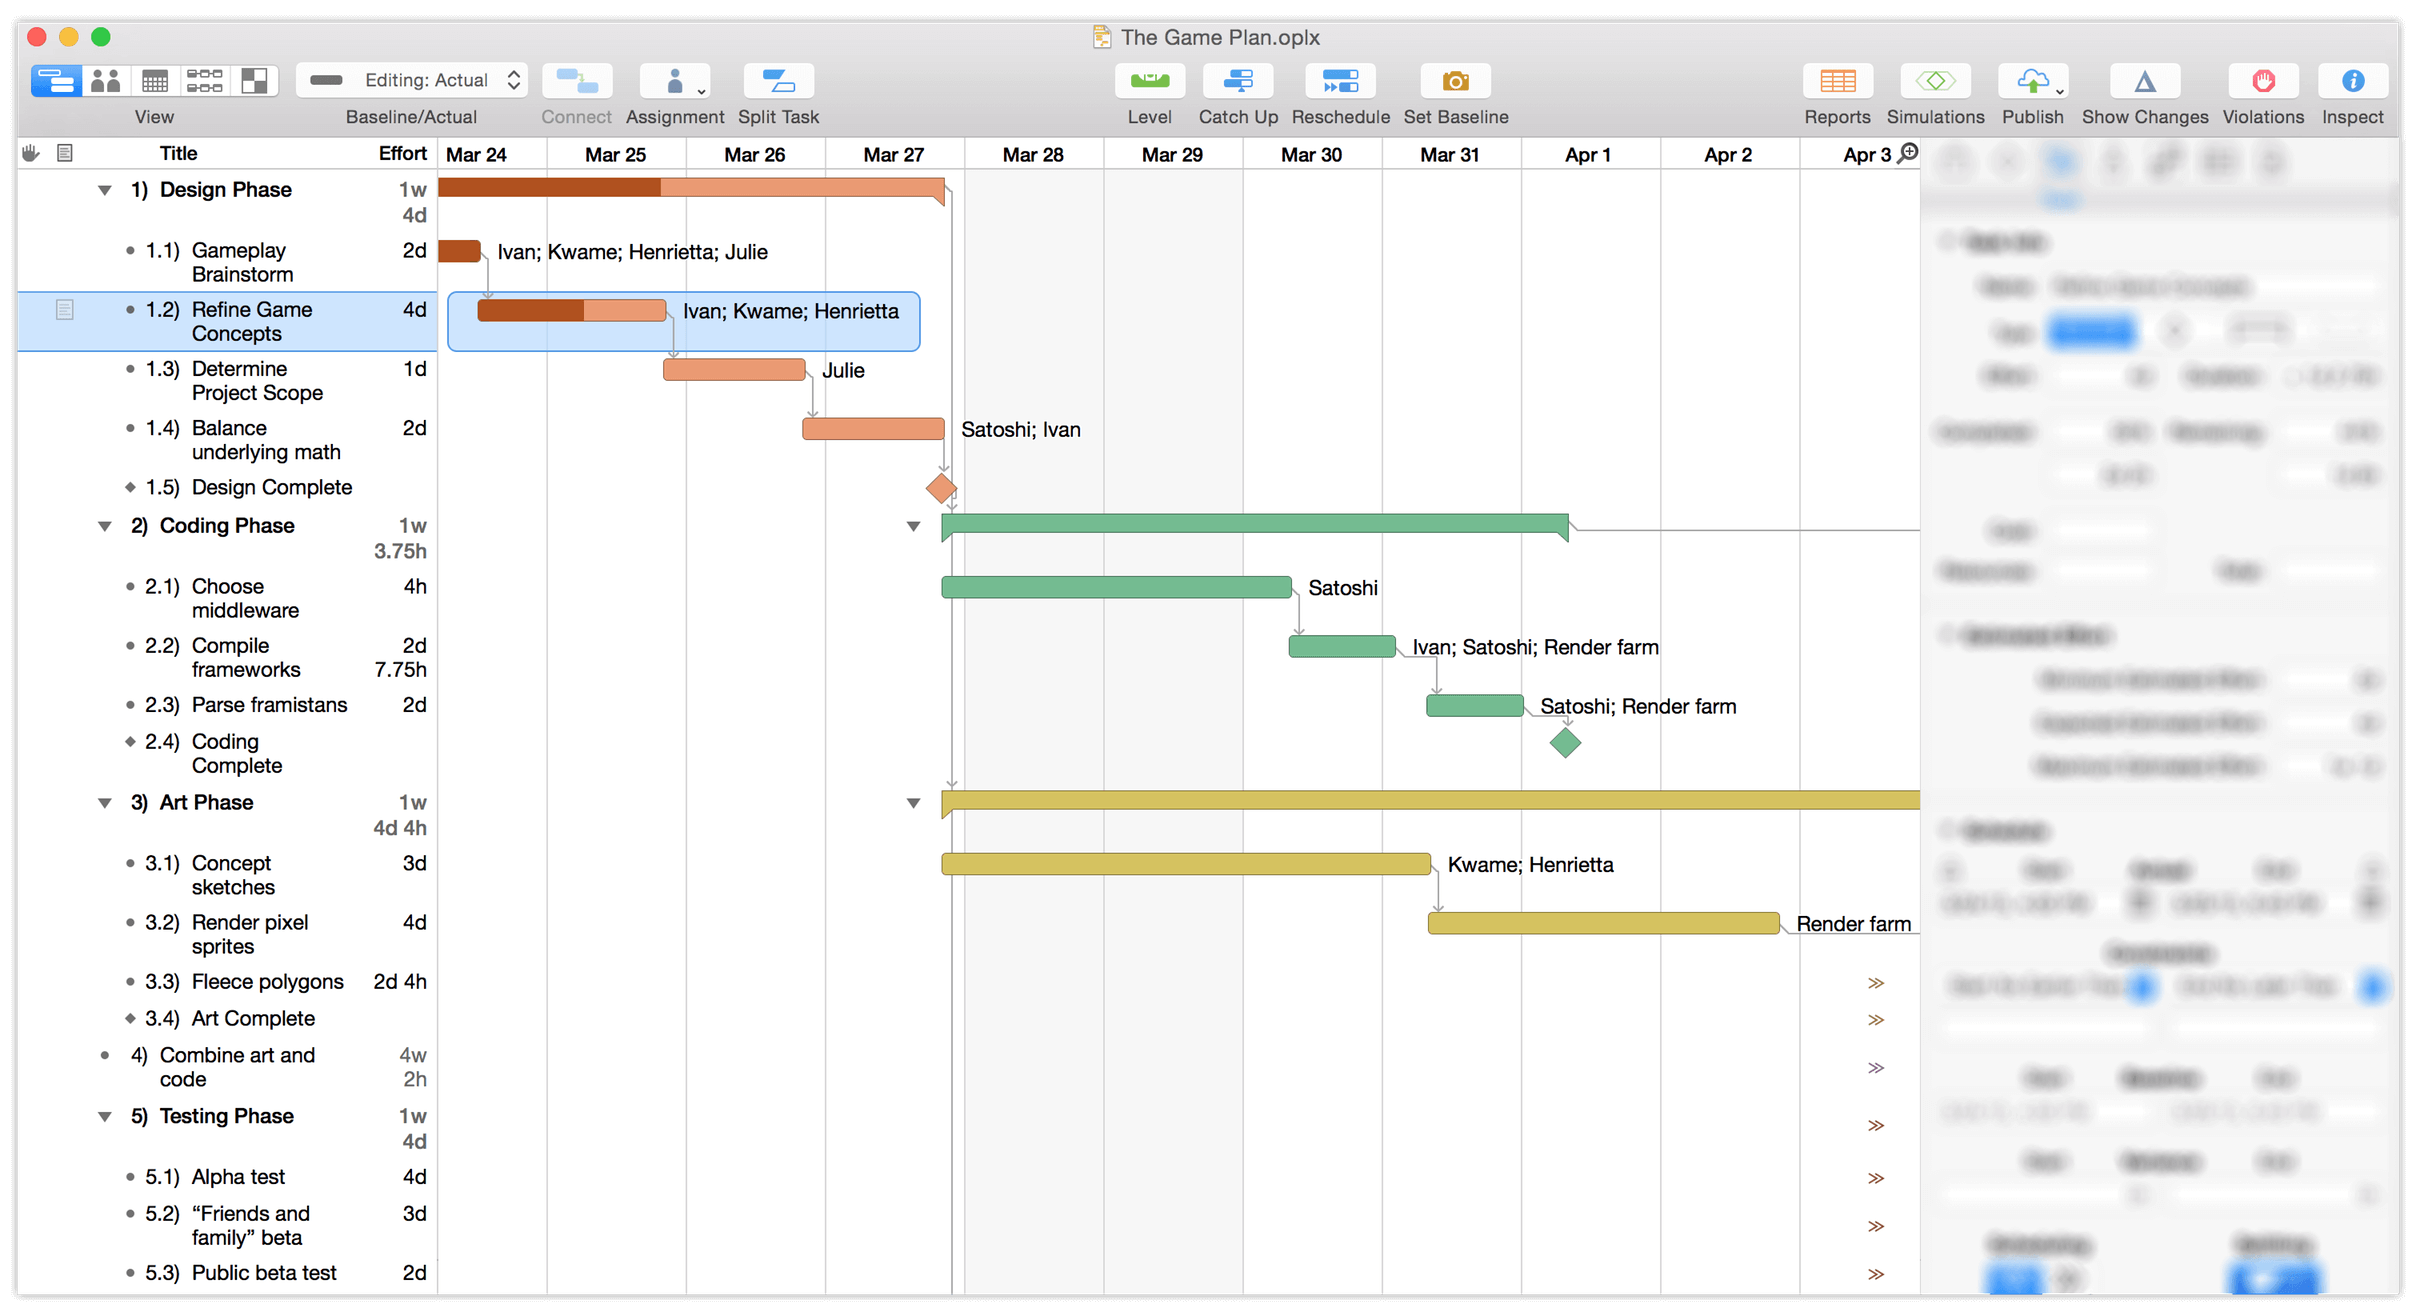
Task View consists of two parts: the task outline on the left, and the Gantt chart on the right. You’ll use the task outline to quickly create, edit, and group related tasks, while the Gantt chart is a powerful visual representation of tasks’ durations and relationships.
Resource View
Click the second button in the view control to see the Resource View.
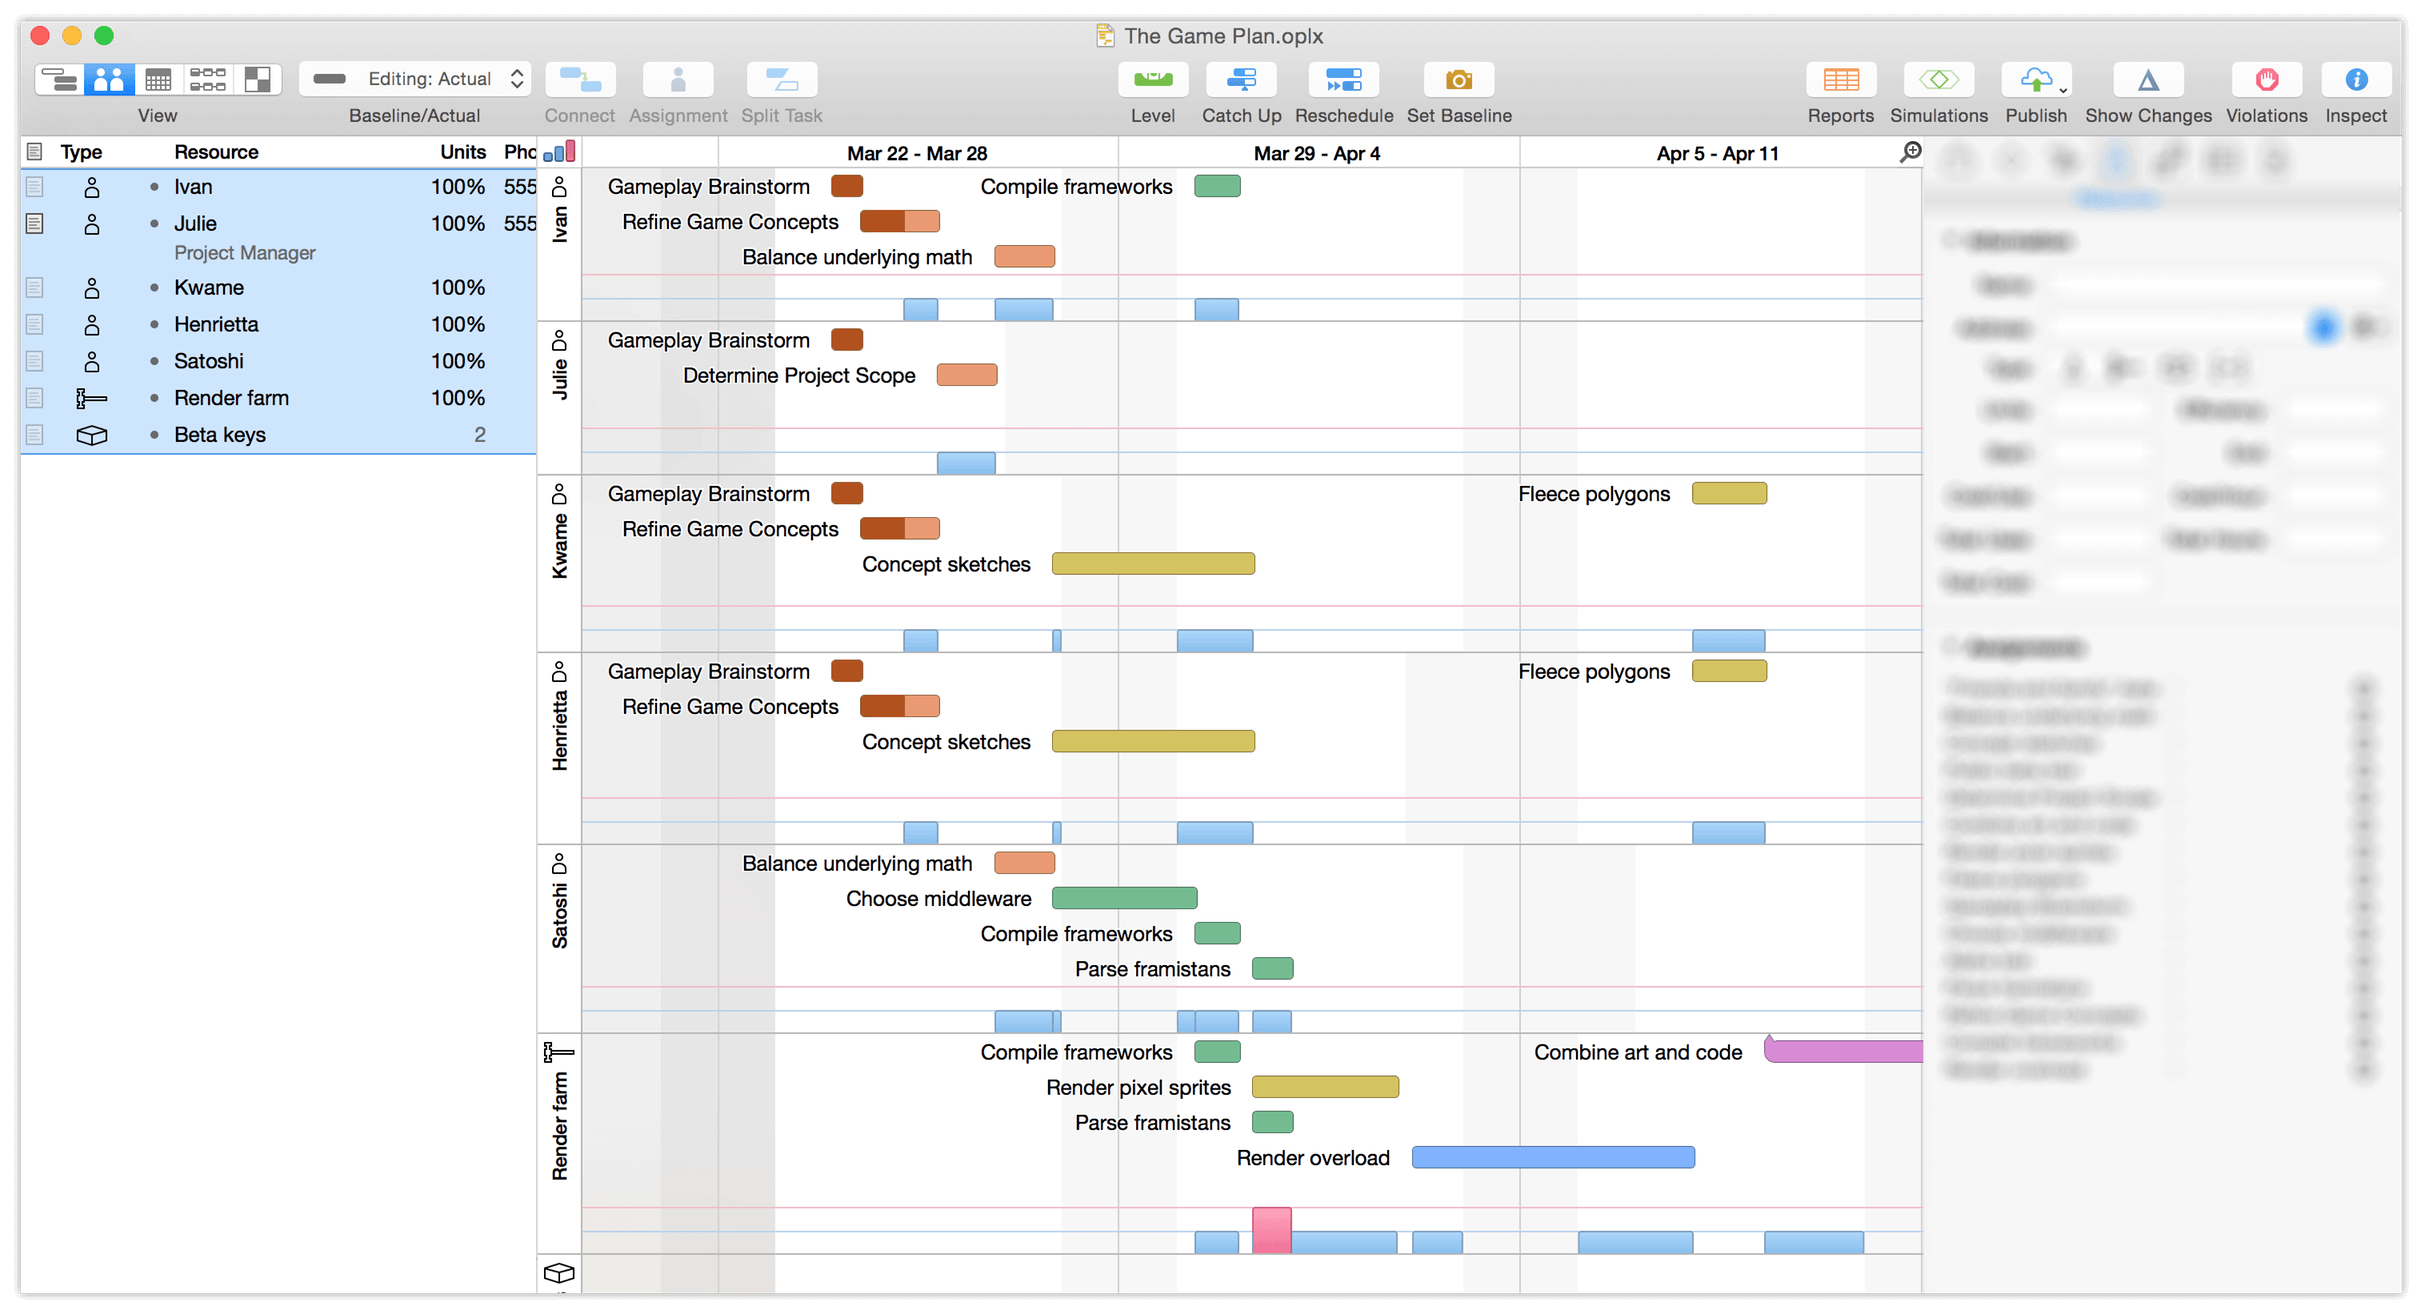
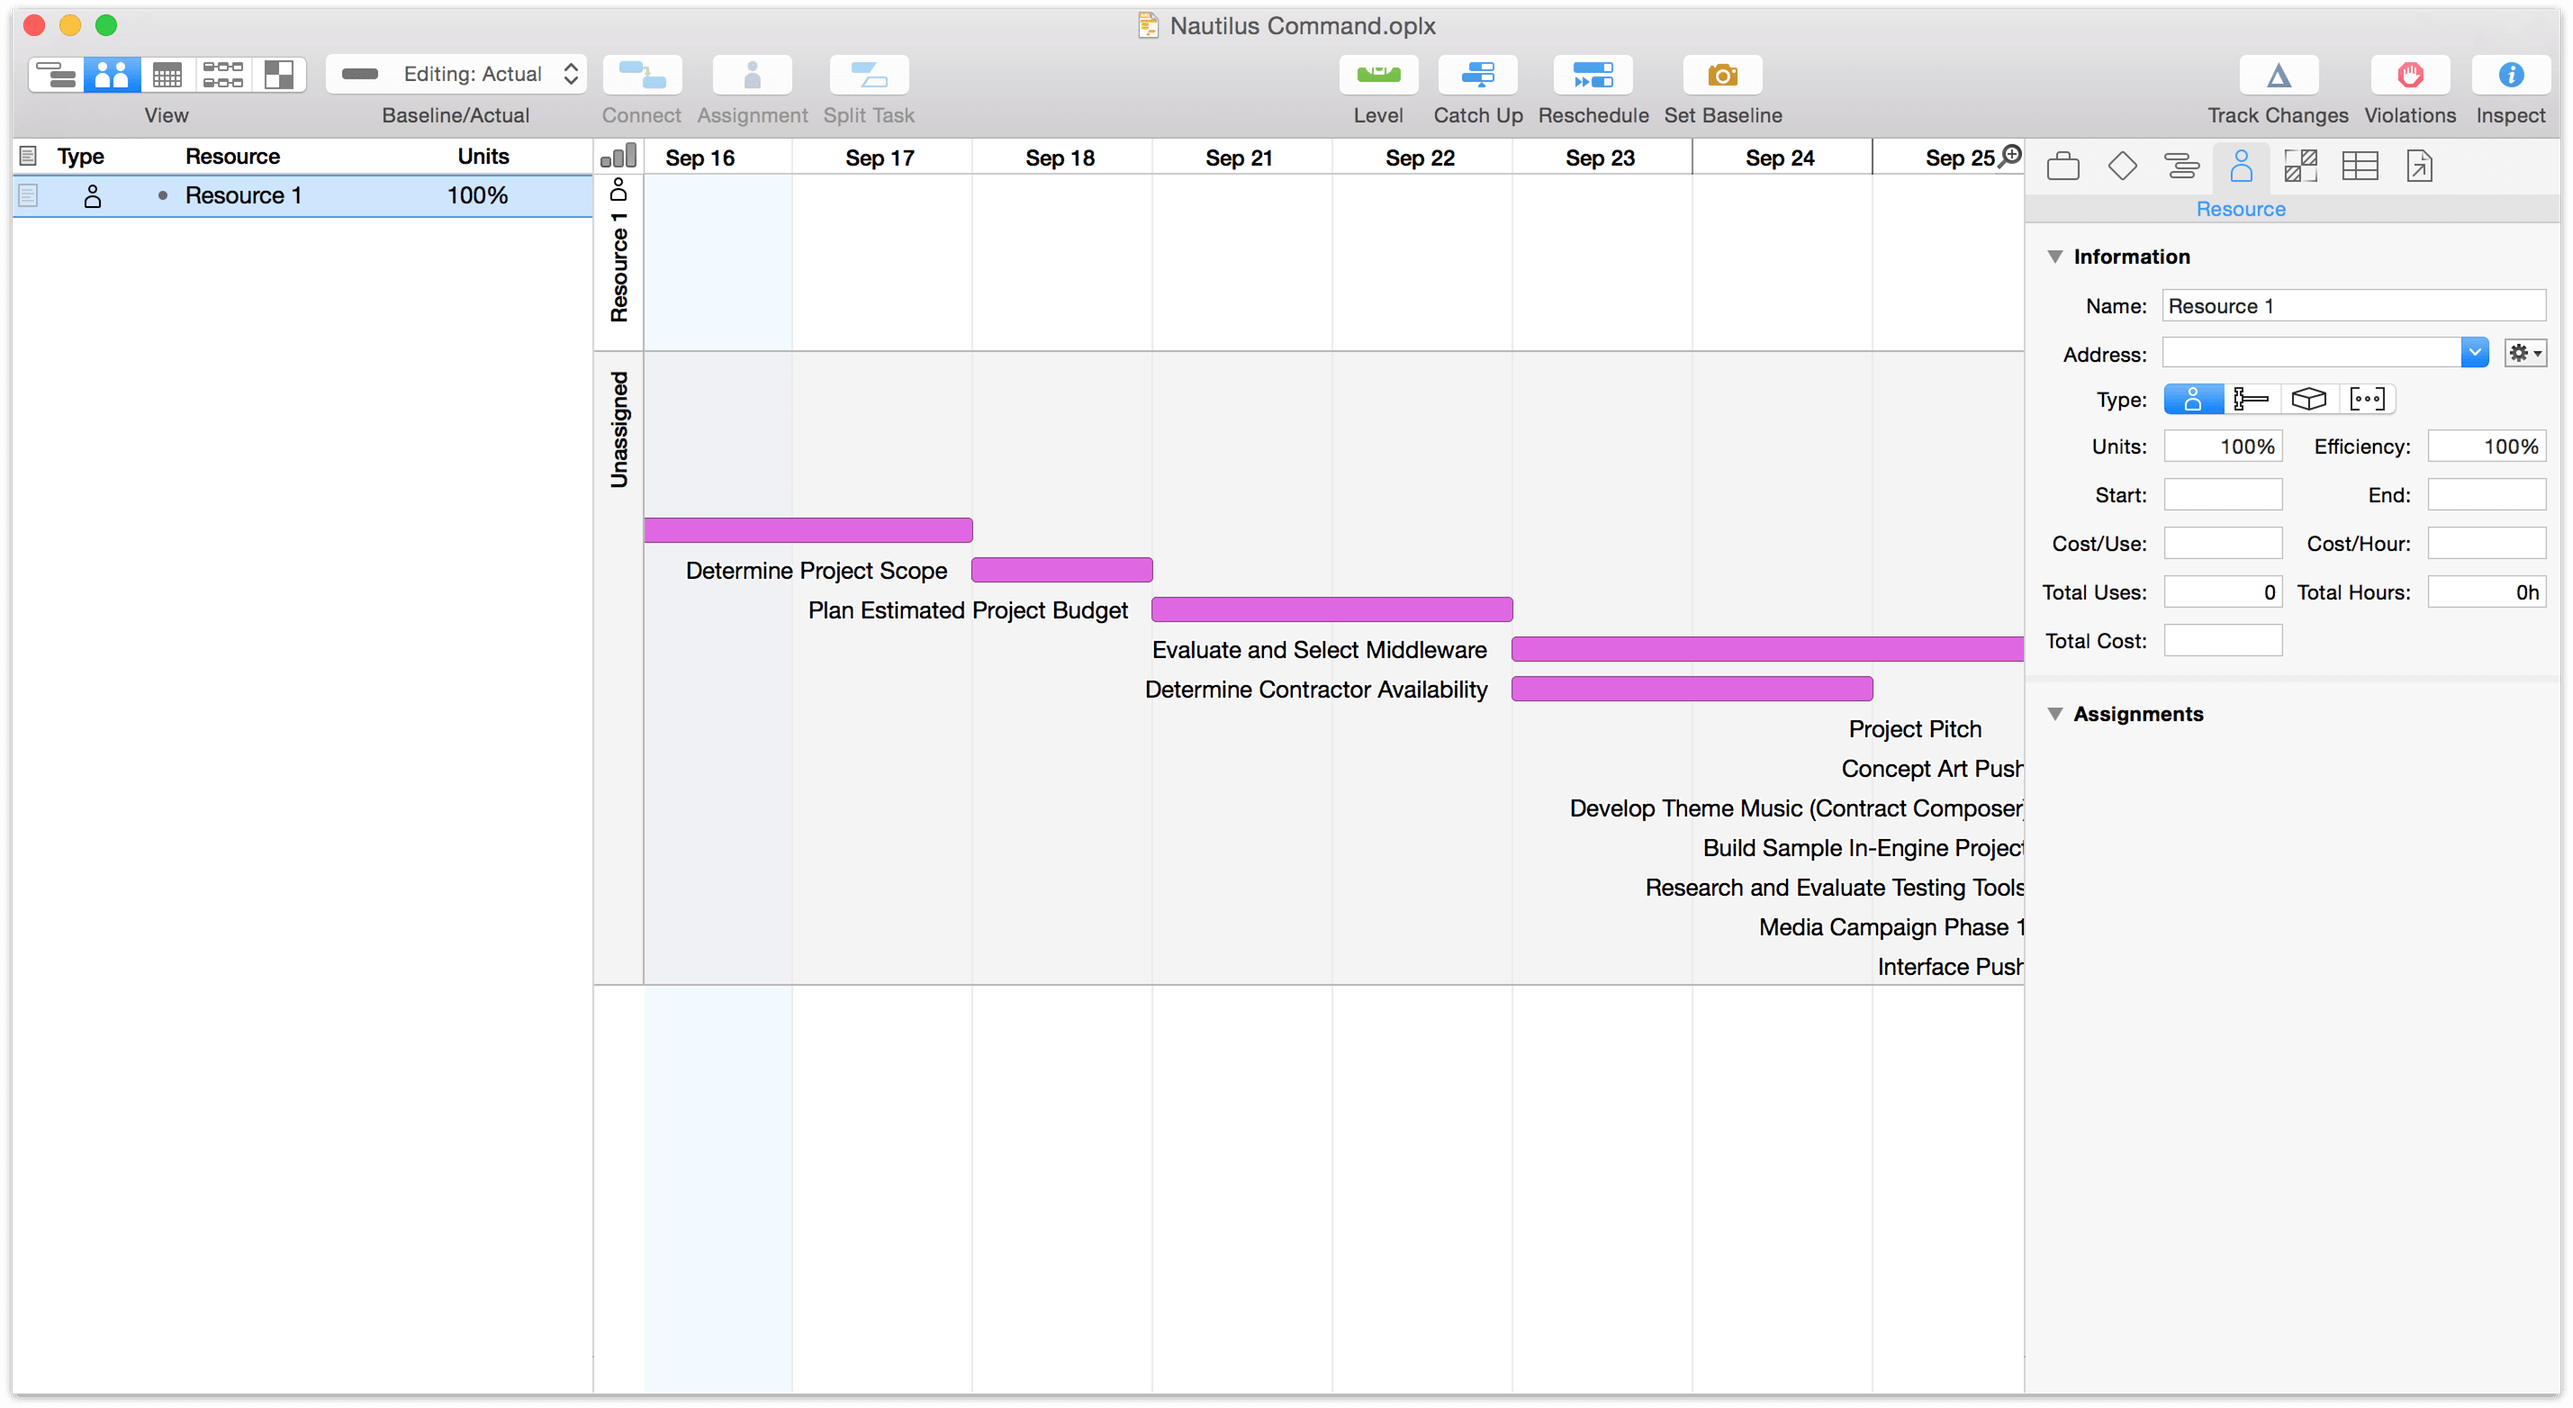
Use Resource View to add and manage staff, equipment, and materials. As with Task View, Resource View is split into two parts: an outline for adding, grouping, and managing resources, and a timeline that shows shows the same tasks as Task View — divided here by resource assignment instead of chronology or dependency structure, with drag-and-drop control to quickly assign resources to tasks (and vice versa).
Calendar View
Click the third button in the view control to see the Calendar View.
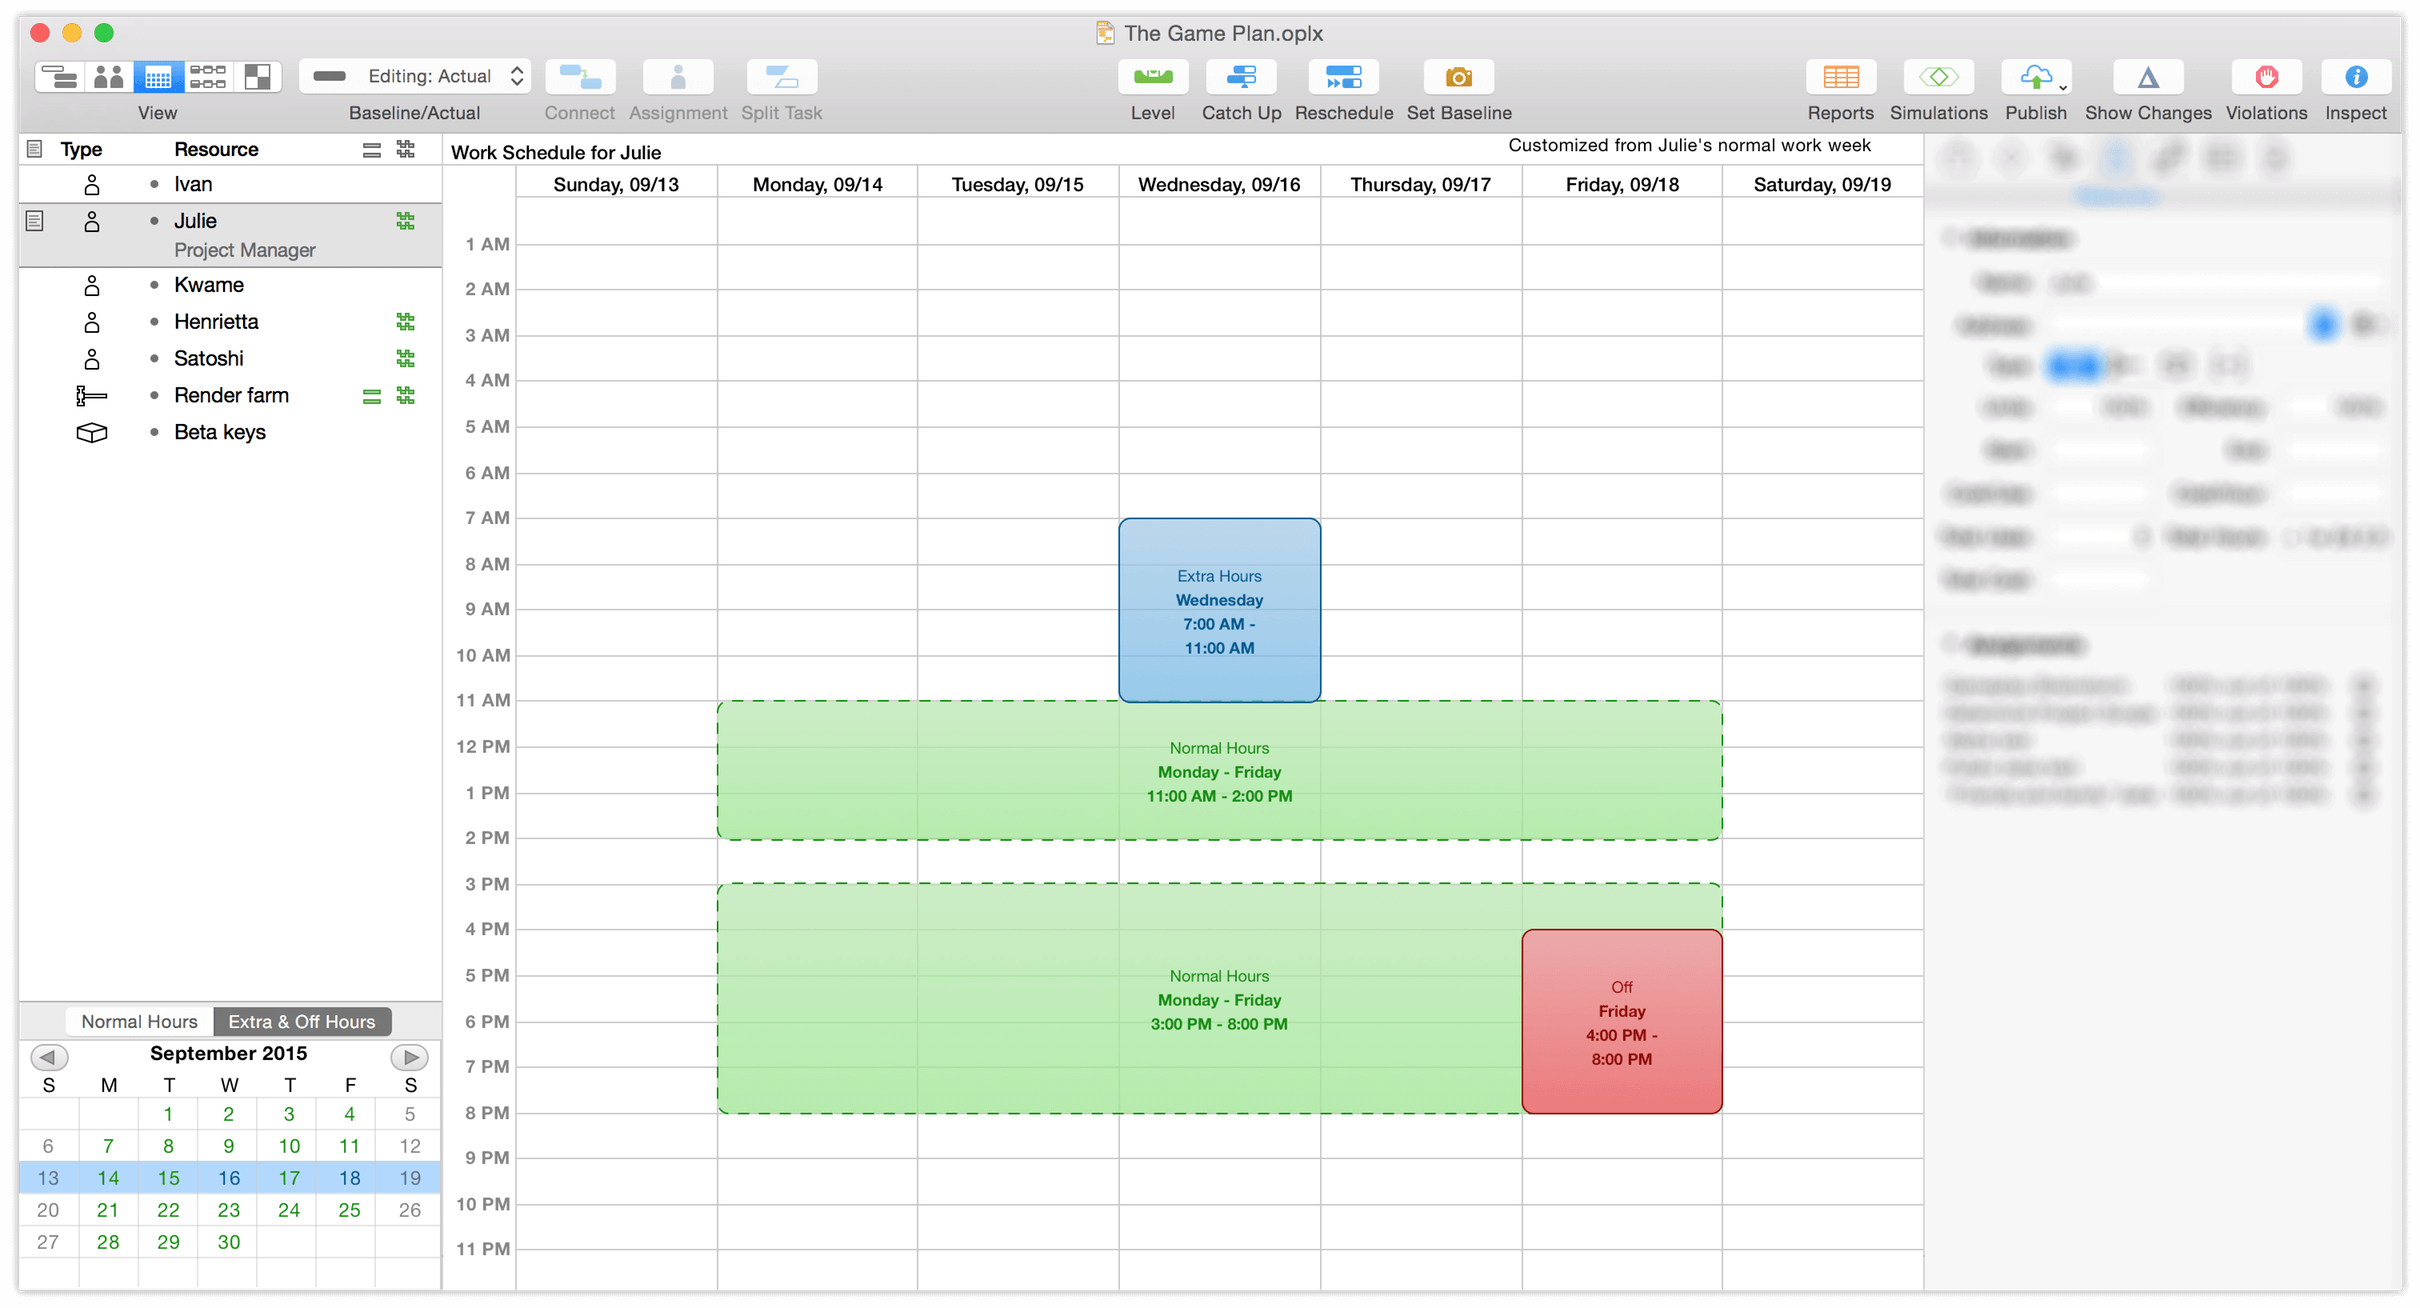
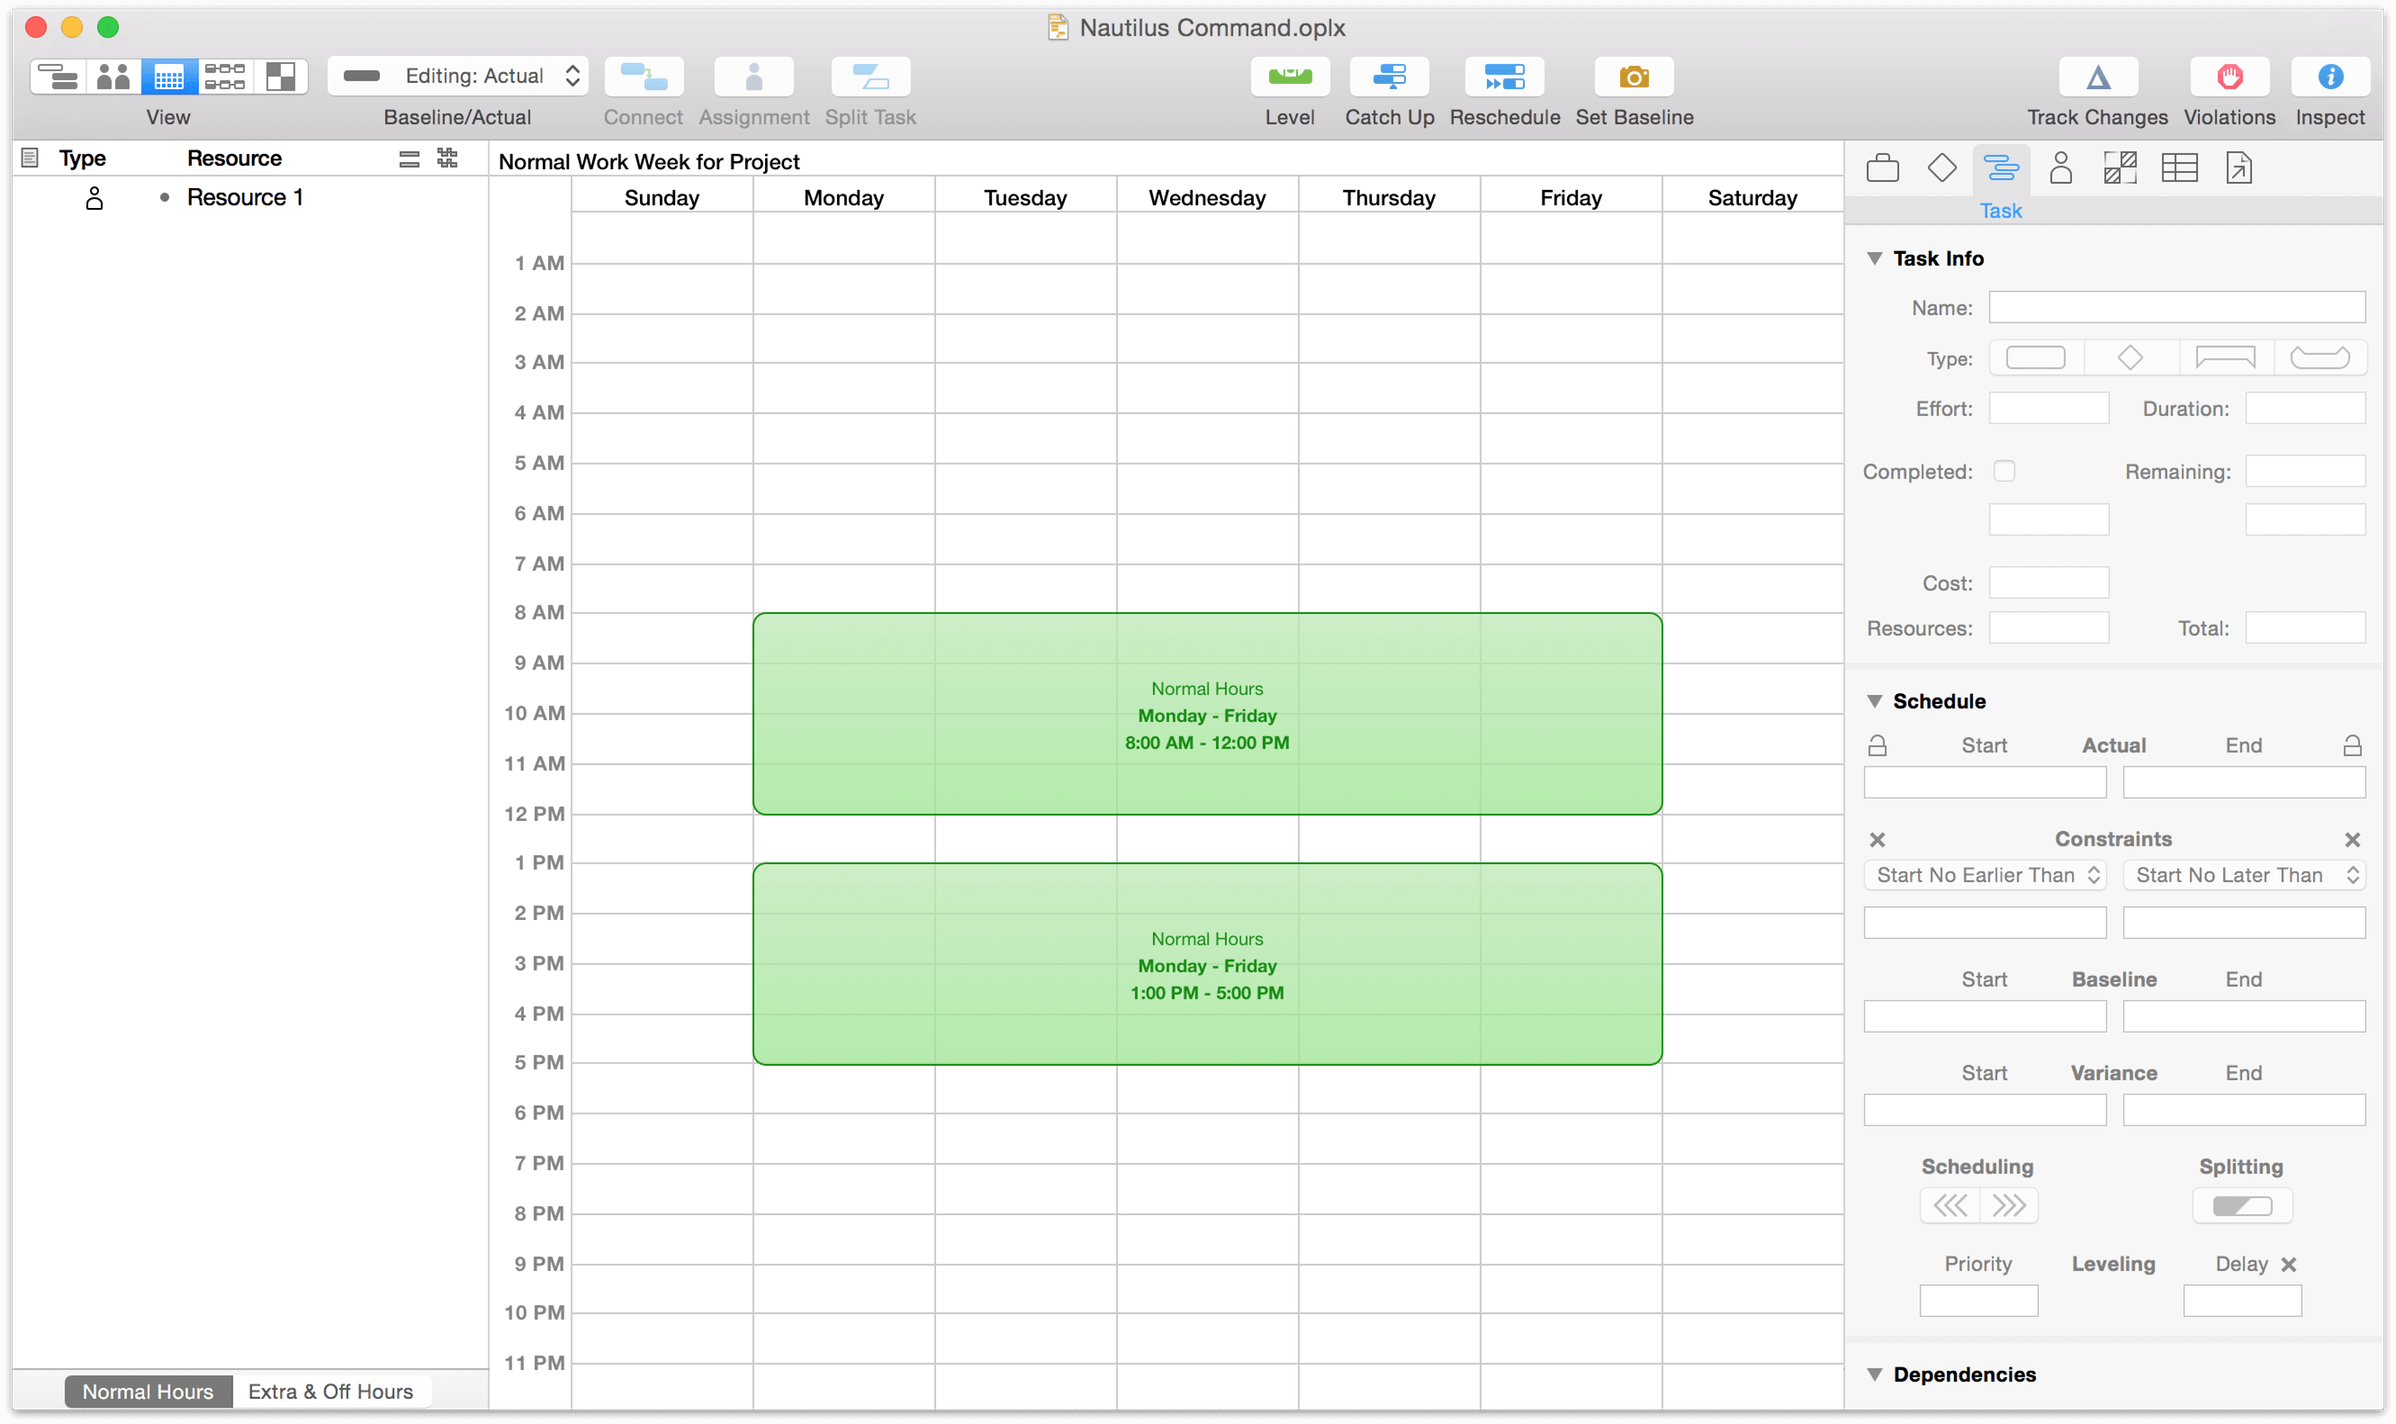
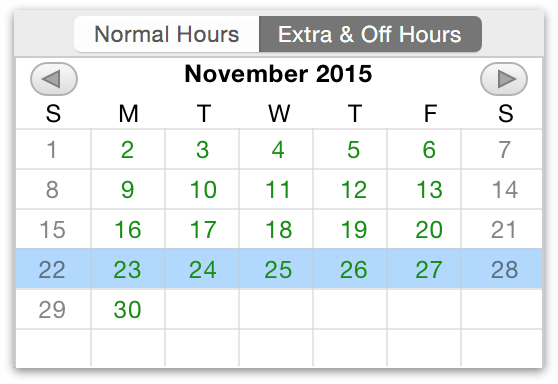
Calendar View also has two main areas: a list of project resources similar to the outline in Resource View, and a calendar for editing working hours. Calendar View is further broken down into two modes: editing for Normal Hours, and Extra & Off Hours.
In Normal Hours mode you’ll edit the working calendar for the whole project (when no resources are selected), as well as the regular working hours for individual staff members (by selecting them in the outline). Normal working hours are represented by green blocks in the calendar. Use the Extra & Off Hours mode to add isolated changes to the schedule that deviate from the norm, represented by blue (for extra time) and red (for time off) respectively.
Network View
Click the fourth button in the view control to see the Network View.
New in OmniPlan 3, Network View provides a canvas that displays your project as a diagram of nodes (tasks) with lines (dependencies) connecting them. Evocative of charts generated with the PERT technique, Network View not only offers a new perspective on your current projects but also allows rapid development of new ones. Press Enter with a task selected and a new one is created that’s dependent on the first; drag a line between existing tasks and watch them rearrange to obey the new relationship you’ve created.
Styles View
Click the fifth button in the view control to see the Styles View.
Styles View is new in OmniPlan 3, but will look familiar to users of earlier versions — this is the new home of style controls that govern your entire project. Changing the default options here will update the look of elements throughout your document, from the font and colors to the appearance of bars in the Gantt chart. You’ll create and manage custom Named Styles for ad-hoc styling of individual items here, too.
Inspectors
Check the right side of the OmniPlan window for the Inspectors sidebar. If it’s hidden, choose Inspectors ▸ Show/Hide Inspectors (Shift-Command-I) or click and drag in from the right side of the window to reveal it.
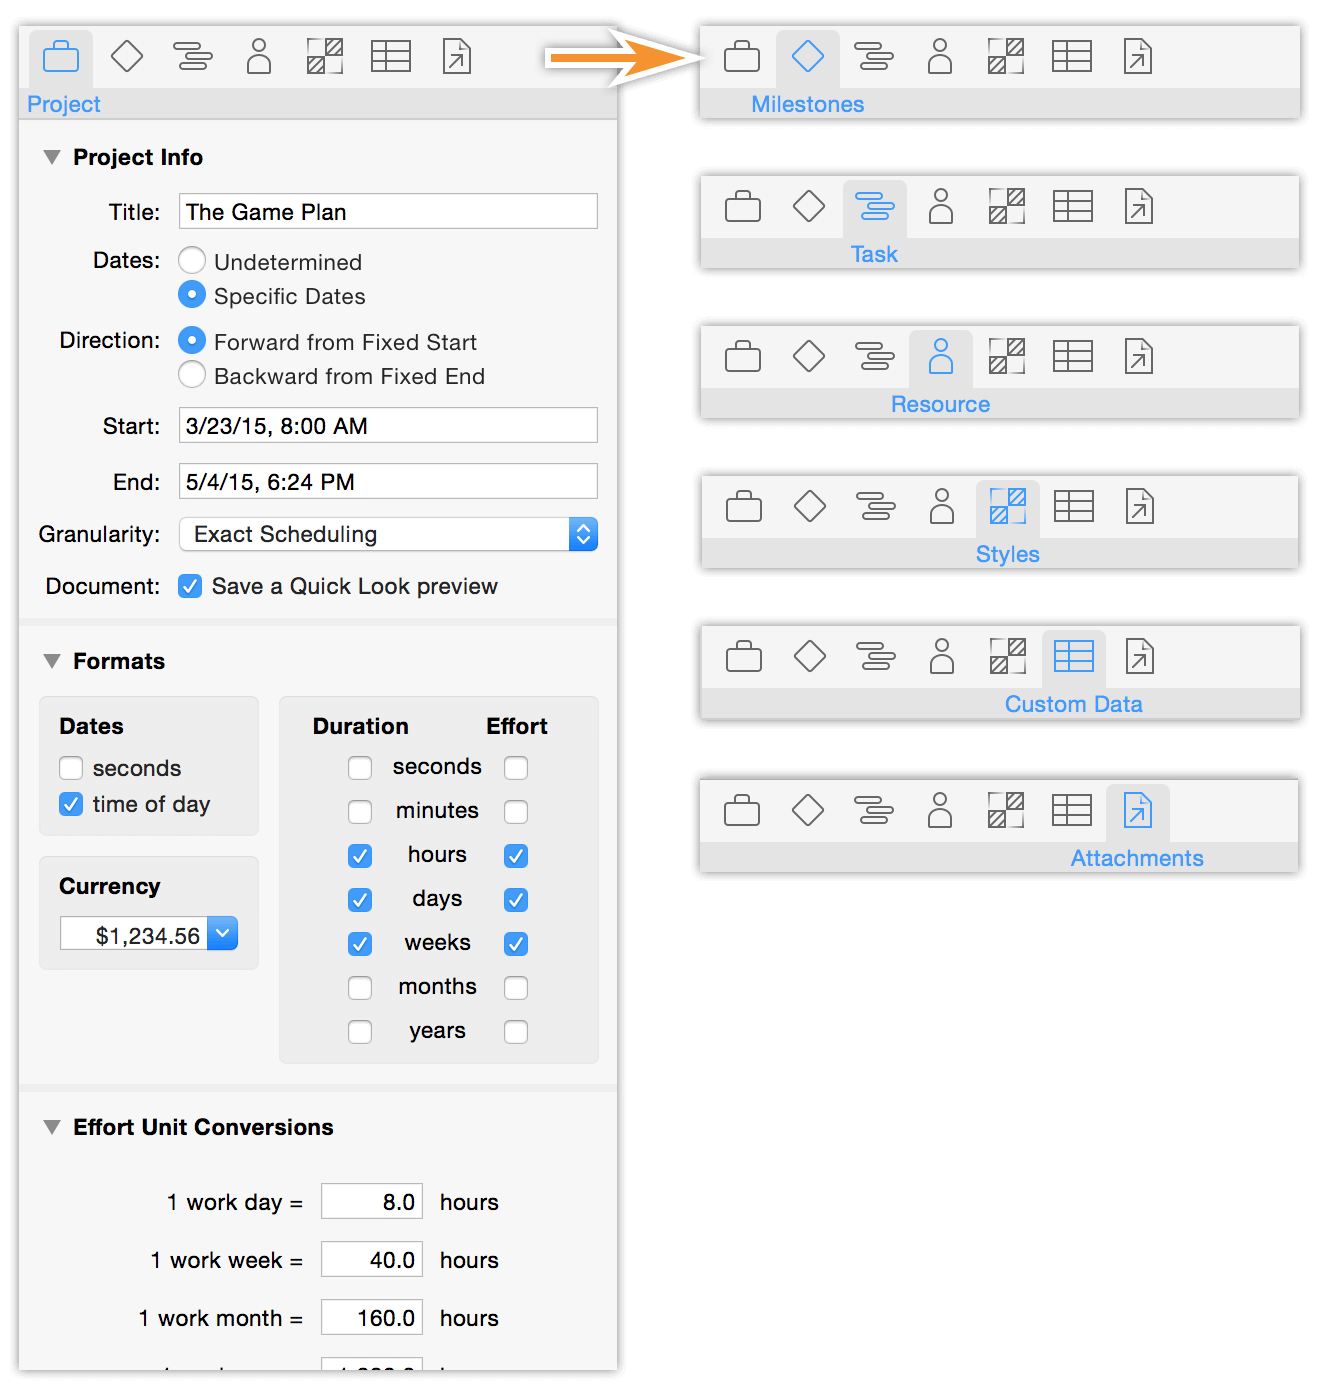
The inspectors are panes with information and controls related to what’s selected in the main window. Whether a given inspector will be relevant to your current selection depends on what it is; at any time you can browse all seven of the inspector groups (Project Info, Milestones, Tasks, Resources, Styles, Custom Data, and Attachments) to see what can be modified.
The Touch Bar
If your Mac supports it, OmniPlan uses the Touch Bar to bring the most useful tools and controls to your fingertips.
In the Task and Resource Views when no task is selected, the Touch Bar displays an overview of the Gantt chart or resource timeline (the same offered with View ▸ Show Overview), along with controls to Level, Catch Up, or Reschedule tasks based on the current project status.

With a task selected, the Touch Bar adapts to offer contextual control for reviewing and assigning resources to the task.

The task’s duration is denoted by the white tick marks centered beneath the resource. A green bar between the tick marks indicates that the resource is assigned to the selected task, while a blue bar indicates that the resource is assigned to another task at that time. A blue bar to the right or left of the tick marks indicates that the resource is assigned to an adjacent task, and a red bar indicates that the resource is overloaded.
While in this view, tap the resource in the Touch Bar to assign it to (or unassign it from) the selected task.
Similarly to the Toolbar, a wide range of OmniPlan-specific buttons can be displayed in the Touch Bar. Configure them to suit your needs by choosing View ▸ Customize Touch Bar.
The Report Window (PRO)
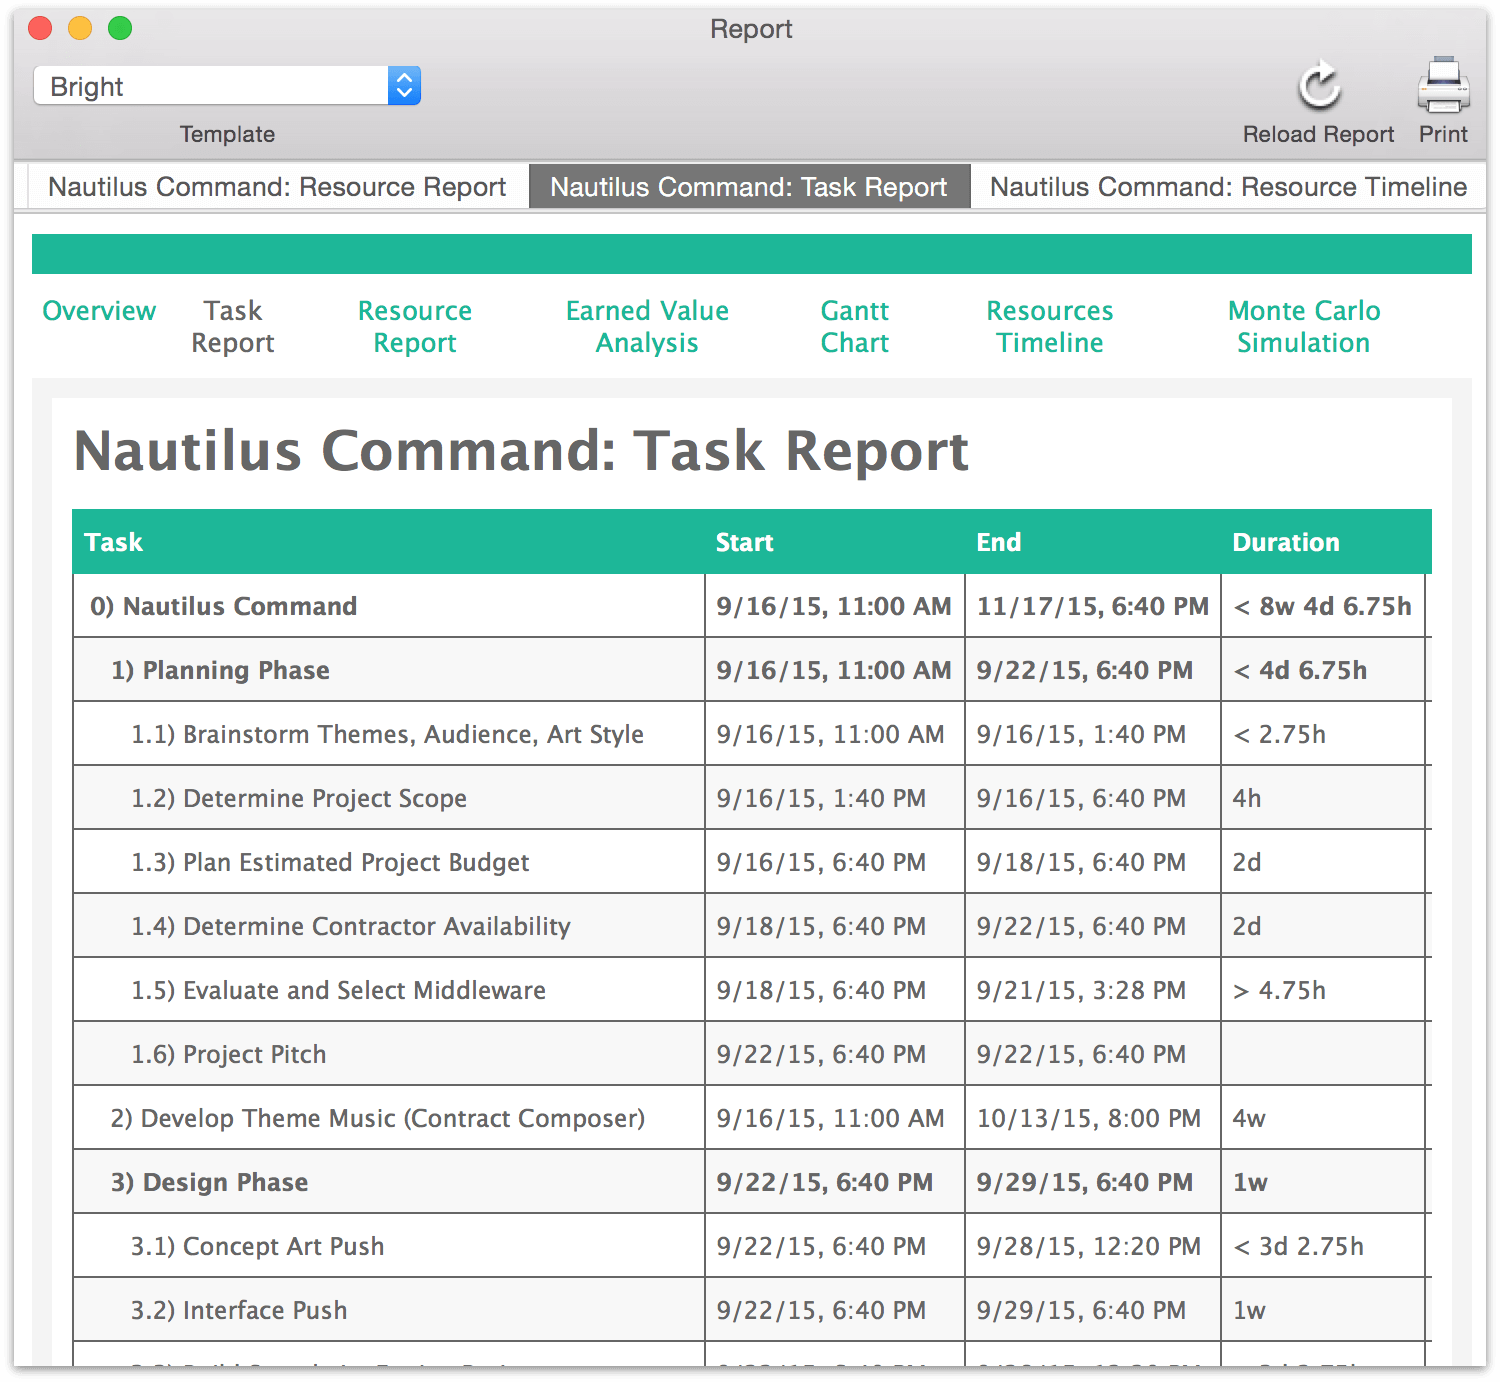
While not a persistent part of the main OmniPlan window, the Reports interface in OmniPlan Pro is important enough to mention here. Choose File ▸ Report (Option-Command-R) to bring it up.
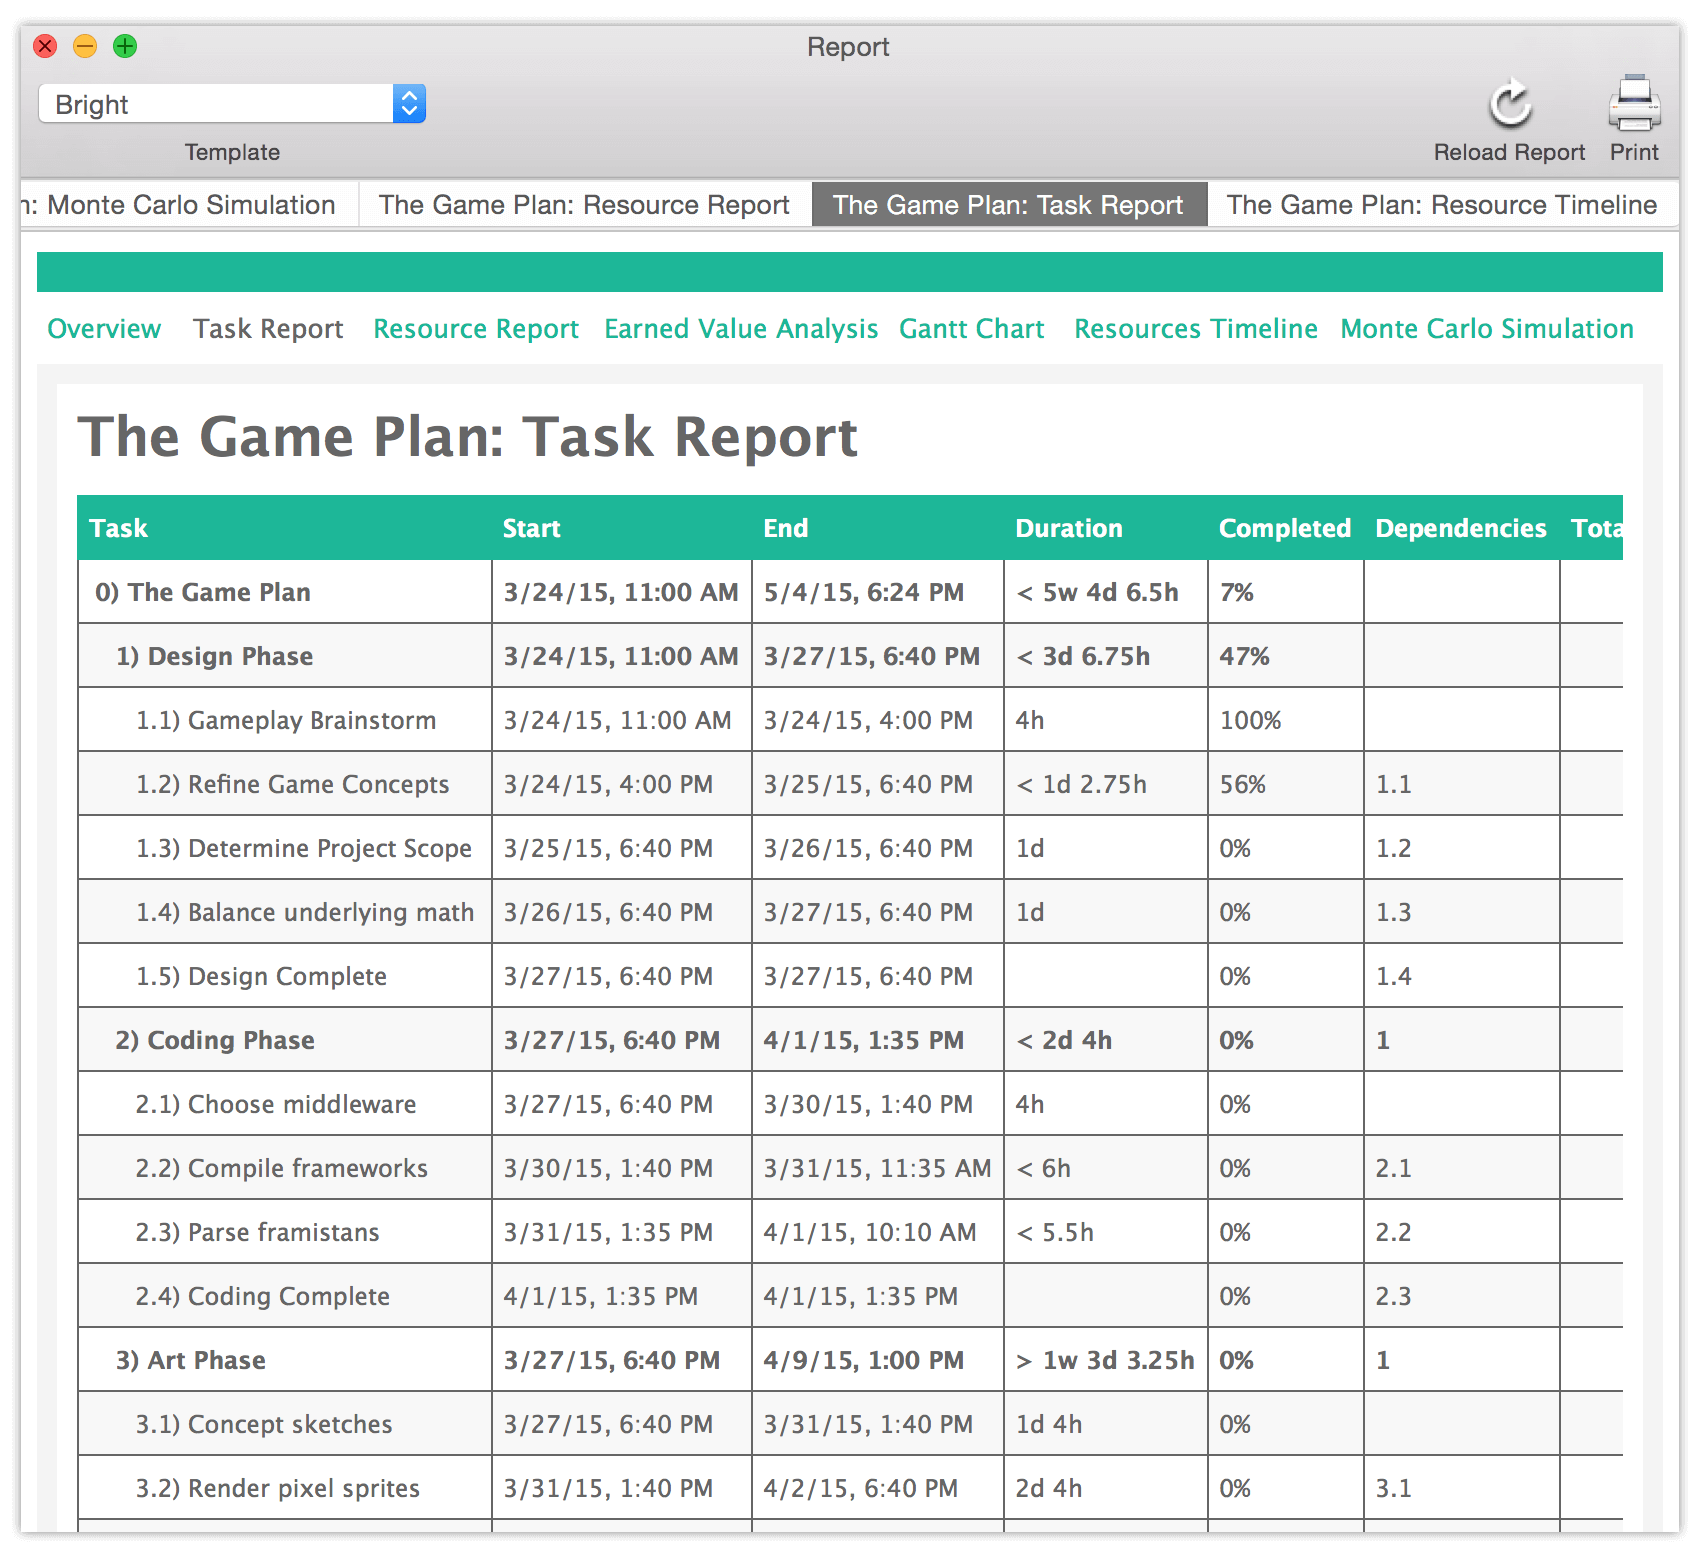
Once you have a project up and running, this is where you’ll go to visualize and summarize its progress. The tabs across the top of the window provide an array of options for presenting data on your project’s status, from an overview of the entire project to focused reports on tasks and resources, and with OmniPlan Pro, EVA budget estimations and simulated projections for milestone completion.
Even better, you can print the chosen report with a great looking preset or custom-styled HTML template straight from this window.
Dashboards (PRO)
Multi-Project Dashboards are a feature that comes with the Pro upgrade to OmniPlan 3, and provide a new way to view an array of projects simultaneously. To create a new one, choose File ▸ New Dashboard (Shift-Command-N) and then drag OmniPlan project files onto it.
You can save that dashboard for future reference in its own .opld file format, and create as many other unique combinations of projects as you want with additional dashboard files. Any updates you make to a project that is shared in a dashboard are immediately reflected there, but projects themselves can’t be directly edited from the dashboard interface.
Chapter 102
Working in OmniPlan: A Tutorial
Welcome to the tutorial! Starting with a blank slate, we’ll build a project from the ground up to show all of the core features of OmniPlan in practical use.
For the purpose of this tutorial we’ll be looking at the development process of a game being put together by an independent team of intrepid designers, coders, and testers, following them from the planning phase through to the release of a demo video for the project.
Step 1: Creating a Project
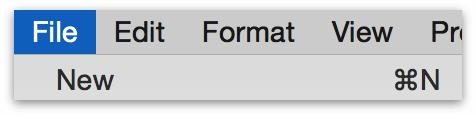
To create a new project, choose File ▸ New (Command-N).
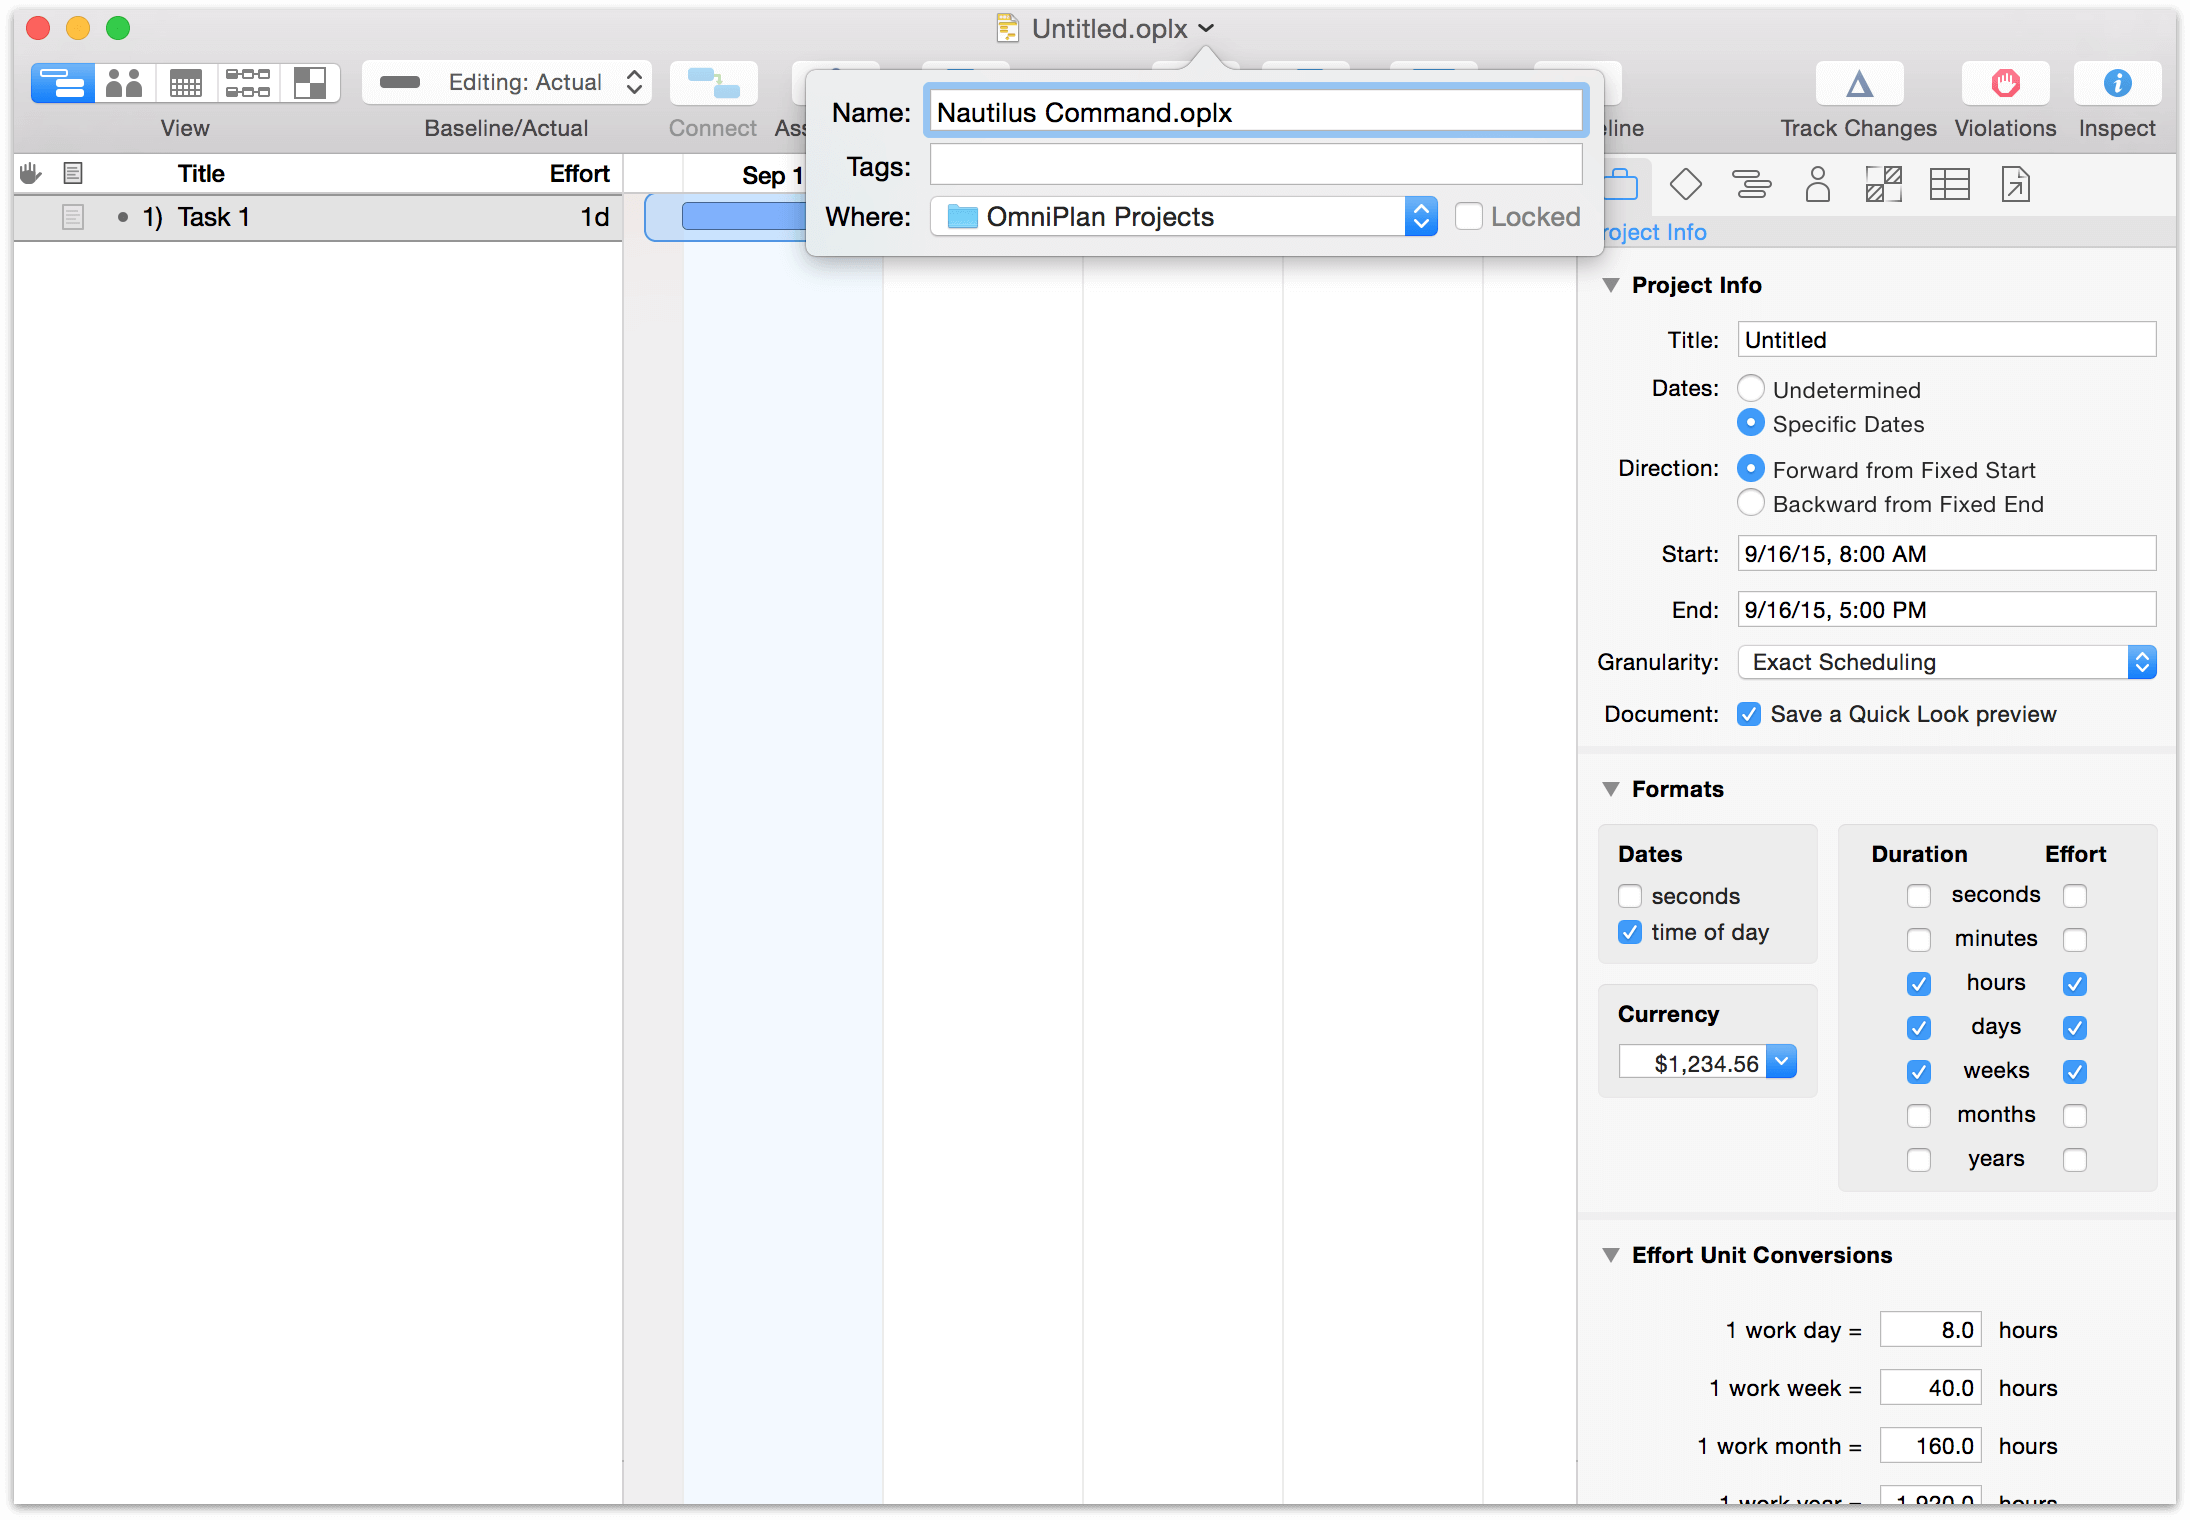
You get a fresh, untitled project document with one task. Save (Command-S) the file to a convenient location, and give it a name (we’ll call ours Nautilus Command, the code name for our upcoming game project).
Step 2: Choosing a Start or End Date
When setting out to build a project, one of the most important aspects is the timeframe. This, in turn, is dictated by any deadlines or start constraints that exist for the project.
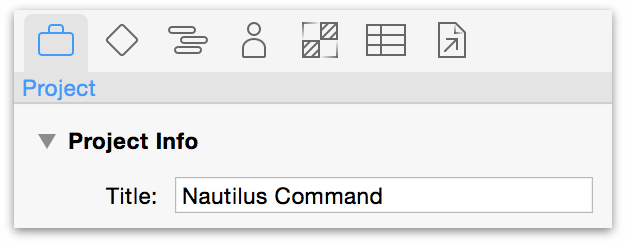
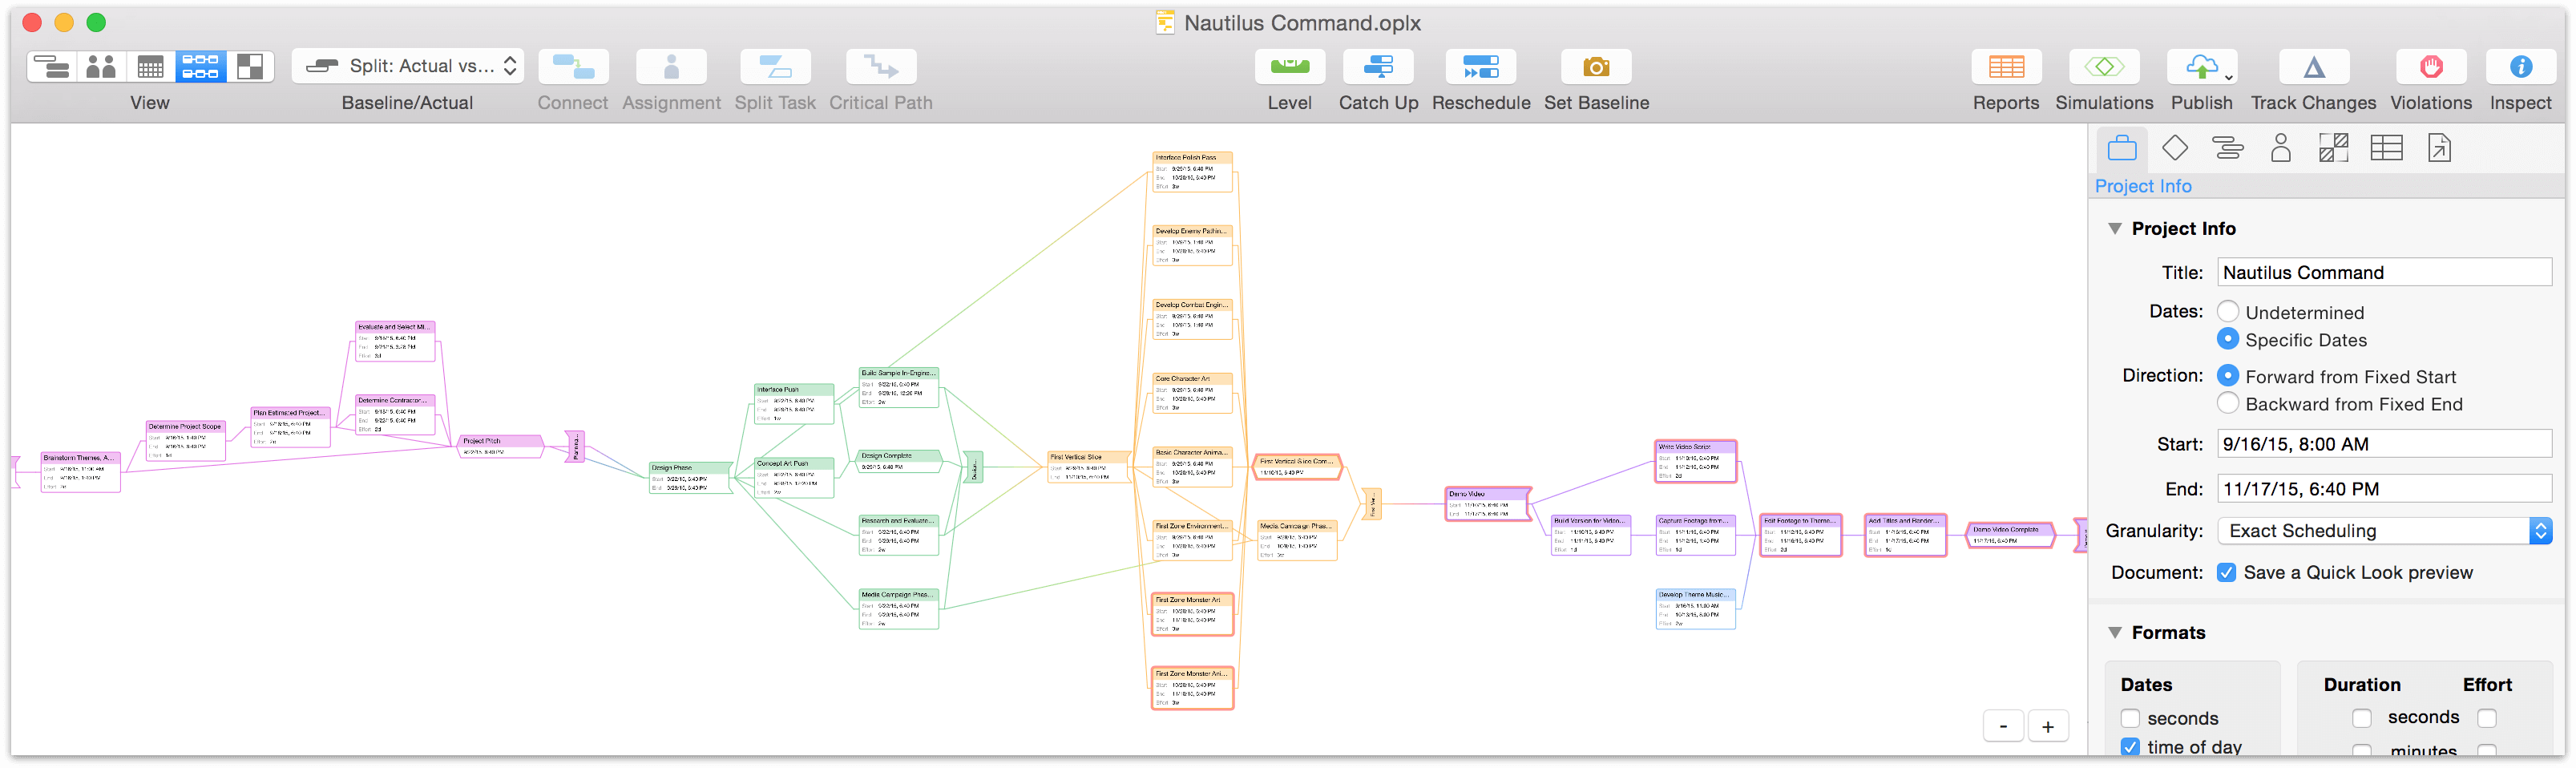
In the case of our game development scheme, we don’t have a hard deadline for the project to be finished — we want it to be done when it’s ready (but as soon as reasonably possible). To indicate this, we’ll go to the Project inspector and set the start date as today.
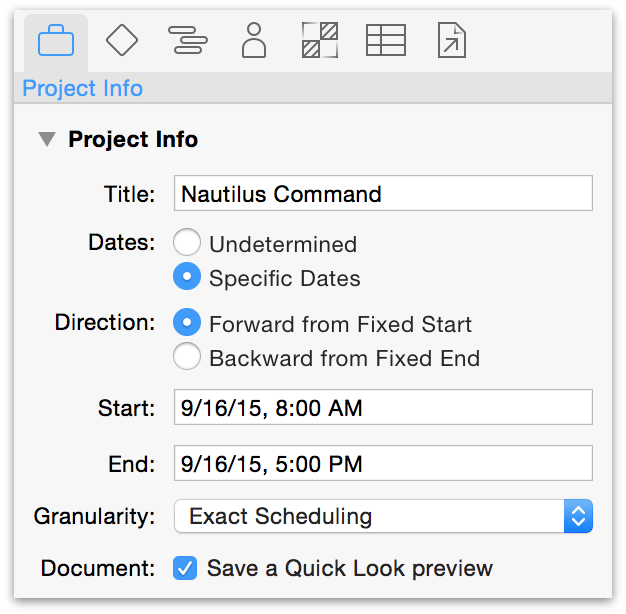
Conveniently, this is the default setting for any new project.
If you’re planning a project in the abstract without a fixed start or end date, you can change the dates from Specific to Undetermined until the timeframe is more set in stone. You’ll get dates that display as T+1d, T +2d... instead.
If you’re planning a project with a specific do-or-die deadline, you’ll want to switch the direction from forward to backward and put the deadline date in the End field. Tasks will be scheduled back from this date, filling in the time from project completion to the present.
If your project has already begun and you are using OmniPlan to describe its progress mid-stream, choose Project ▸ Set Current Editing Date to turn the clock back to when the project began. Continue with the tutorial until your tasks, resources, and their relationships are in place (through Step 12); then set the current editing date back to the present.
Step 3: Creating Milestones
Milestones are the anchor points in your project that mark important shifts in focus or unlocking a new phase of the project. Clarifying these will help break a dauntingly large project down into more manageable sections, and help dictate the tasks leading up to and following the milestone.
To create a milestone, choose Structure ▸ Add ▸ Milestone, or use the keyboard shortcut (Command-Shift-M).
Alternatively, click on the currently existing task (“Task 1”) to select it, then go to the Task inspector. You can change the task type from a regular task to a milestone in the Task Info section here.
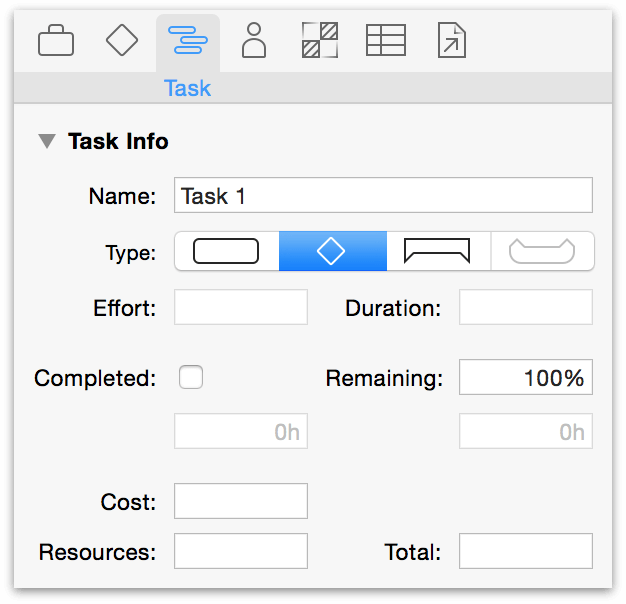
We’ll change the name of “Task 1” by clicking it in Task View or editing the name field in the Task inspector, create a few more milestones for our project, and then go on to reinforce our milestones with tasks.
Step 4: Creating Tasks
Create a task by pressing Return with a task selected, or choosing Structure ▸ Add ▸ Task. To add a task above the currently selected task, hold Shift before pressing Return.
A task is anything that needs to get done in order for the project to move toward completion. Each task has attributes such as start and end dates, a completion percentage, and resource assignments; these show up in the various columns of the task outline, and in the various sections of the Task inspector. Tasks can be grouped together, and a task can be dependent on other tasks.
For now, just create some tasks and name them. Select your first task and press the Return key once (or twice, depending on how your keyboard preferences are set) to create new tasks. If you still have a “Task 1” hanging around, you can just delete it or change its name. When you’re done, if your milestone is not the last item, click the bullet to its left and drag it down to the bottom of the list.
Each task in the outline corresponds to a bar on the Gantt chart.
New tasks appear below the currently selected item in the Gantt view, or at the bottom of the list if no tasks, milestones, or groups are selected.
For our project we’ll create several tasks beneath each milestone that they’re related to.
As you create additional tasks, you’ll see that the task name listed in the outline alongside a few other default columns: Violations, Notes, and Effort. You can add details about each task by clicking the note icon next to its name. Effort represents the number of resource-hours needed to complete the task, while violations appear only when the logic of dependencies between tasks gets out of line.
Step 5: Editing the Work Week
Now that we’re starting to see the project come together, we’ll set tasks aside for the moment and start setting up the work schedule for our project.
Switch to Calendar View. By default, working hours are Monday through Friday from 8:00 to 5:00, with an hour-long break for lunch at noon, but you can move or resize the blocks to adjust the working hours for the project.
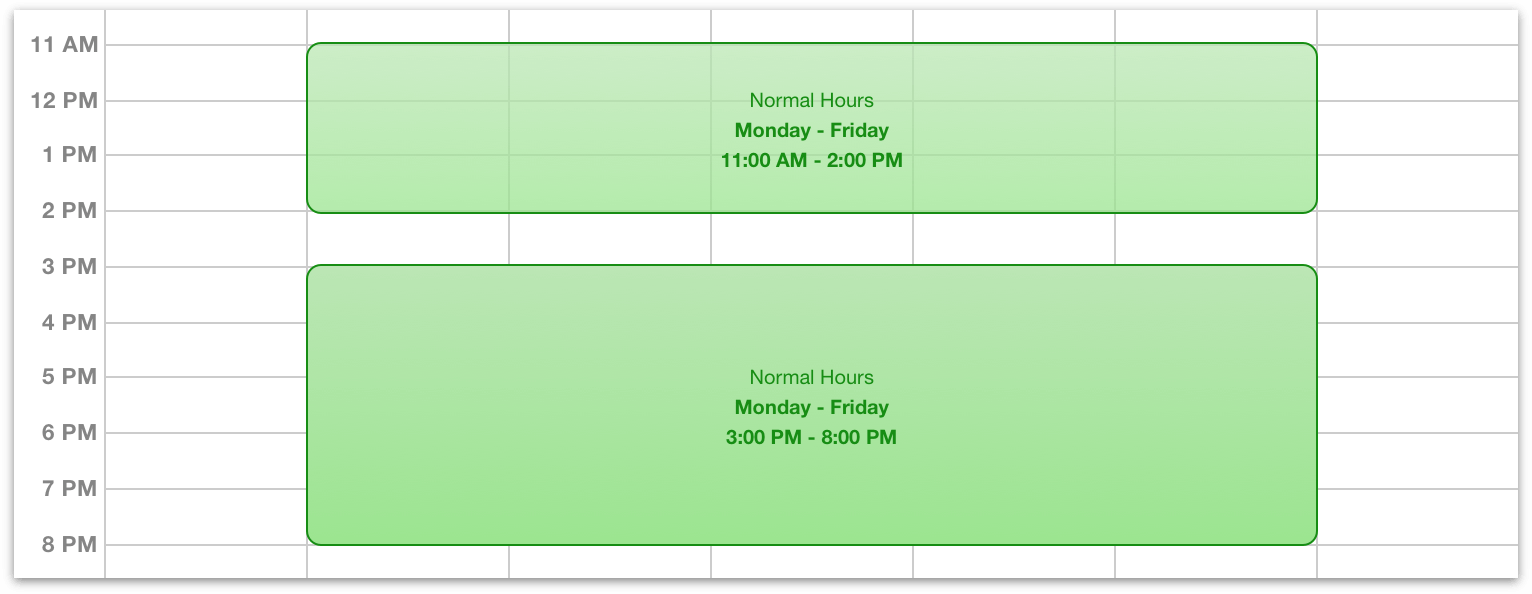
Drag a block to move it, or drag the edge of a block to resize it. Double-click and drag in an empty area to create a new block, or select a block and press the Delete key to get rid of it. The text inside each block updates to reflect the changes you make.
Since we’re working with a bunch of more nocturnal folks, let’s change the schedule to reflect that. Click and drag one of the time blocks on the calendar to bring it to a new position, or drag one of the edges to change the size of the block. We end up with a schedule that fits our needs:
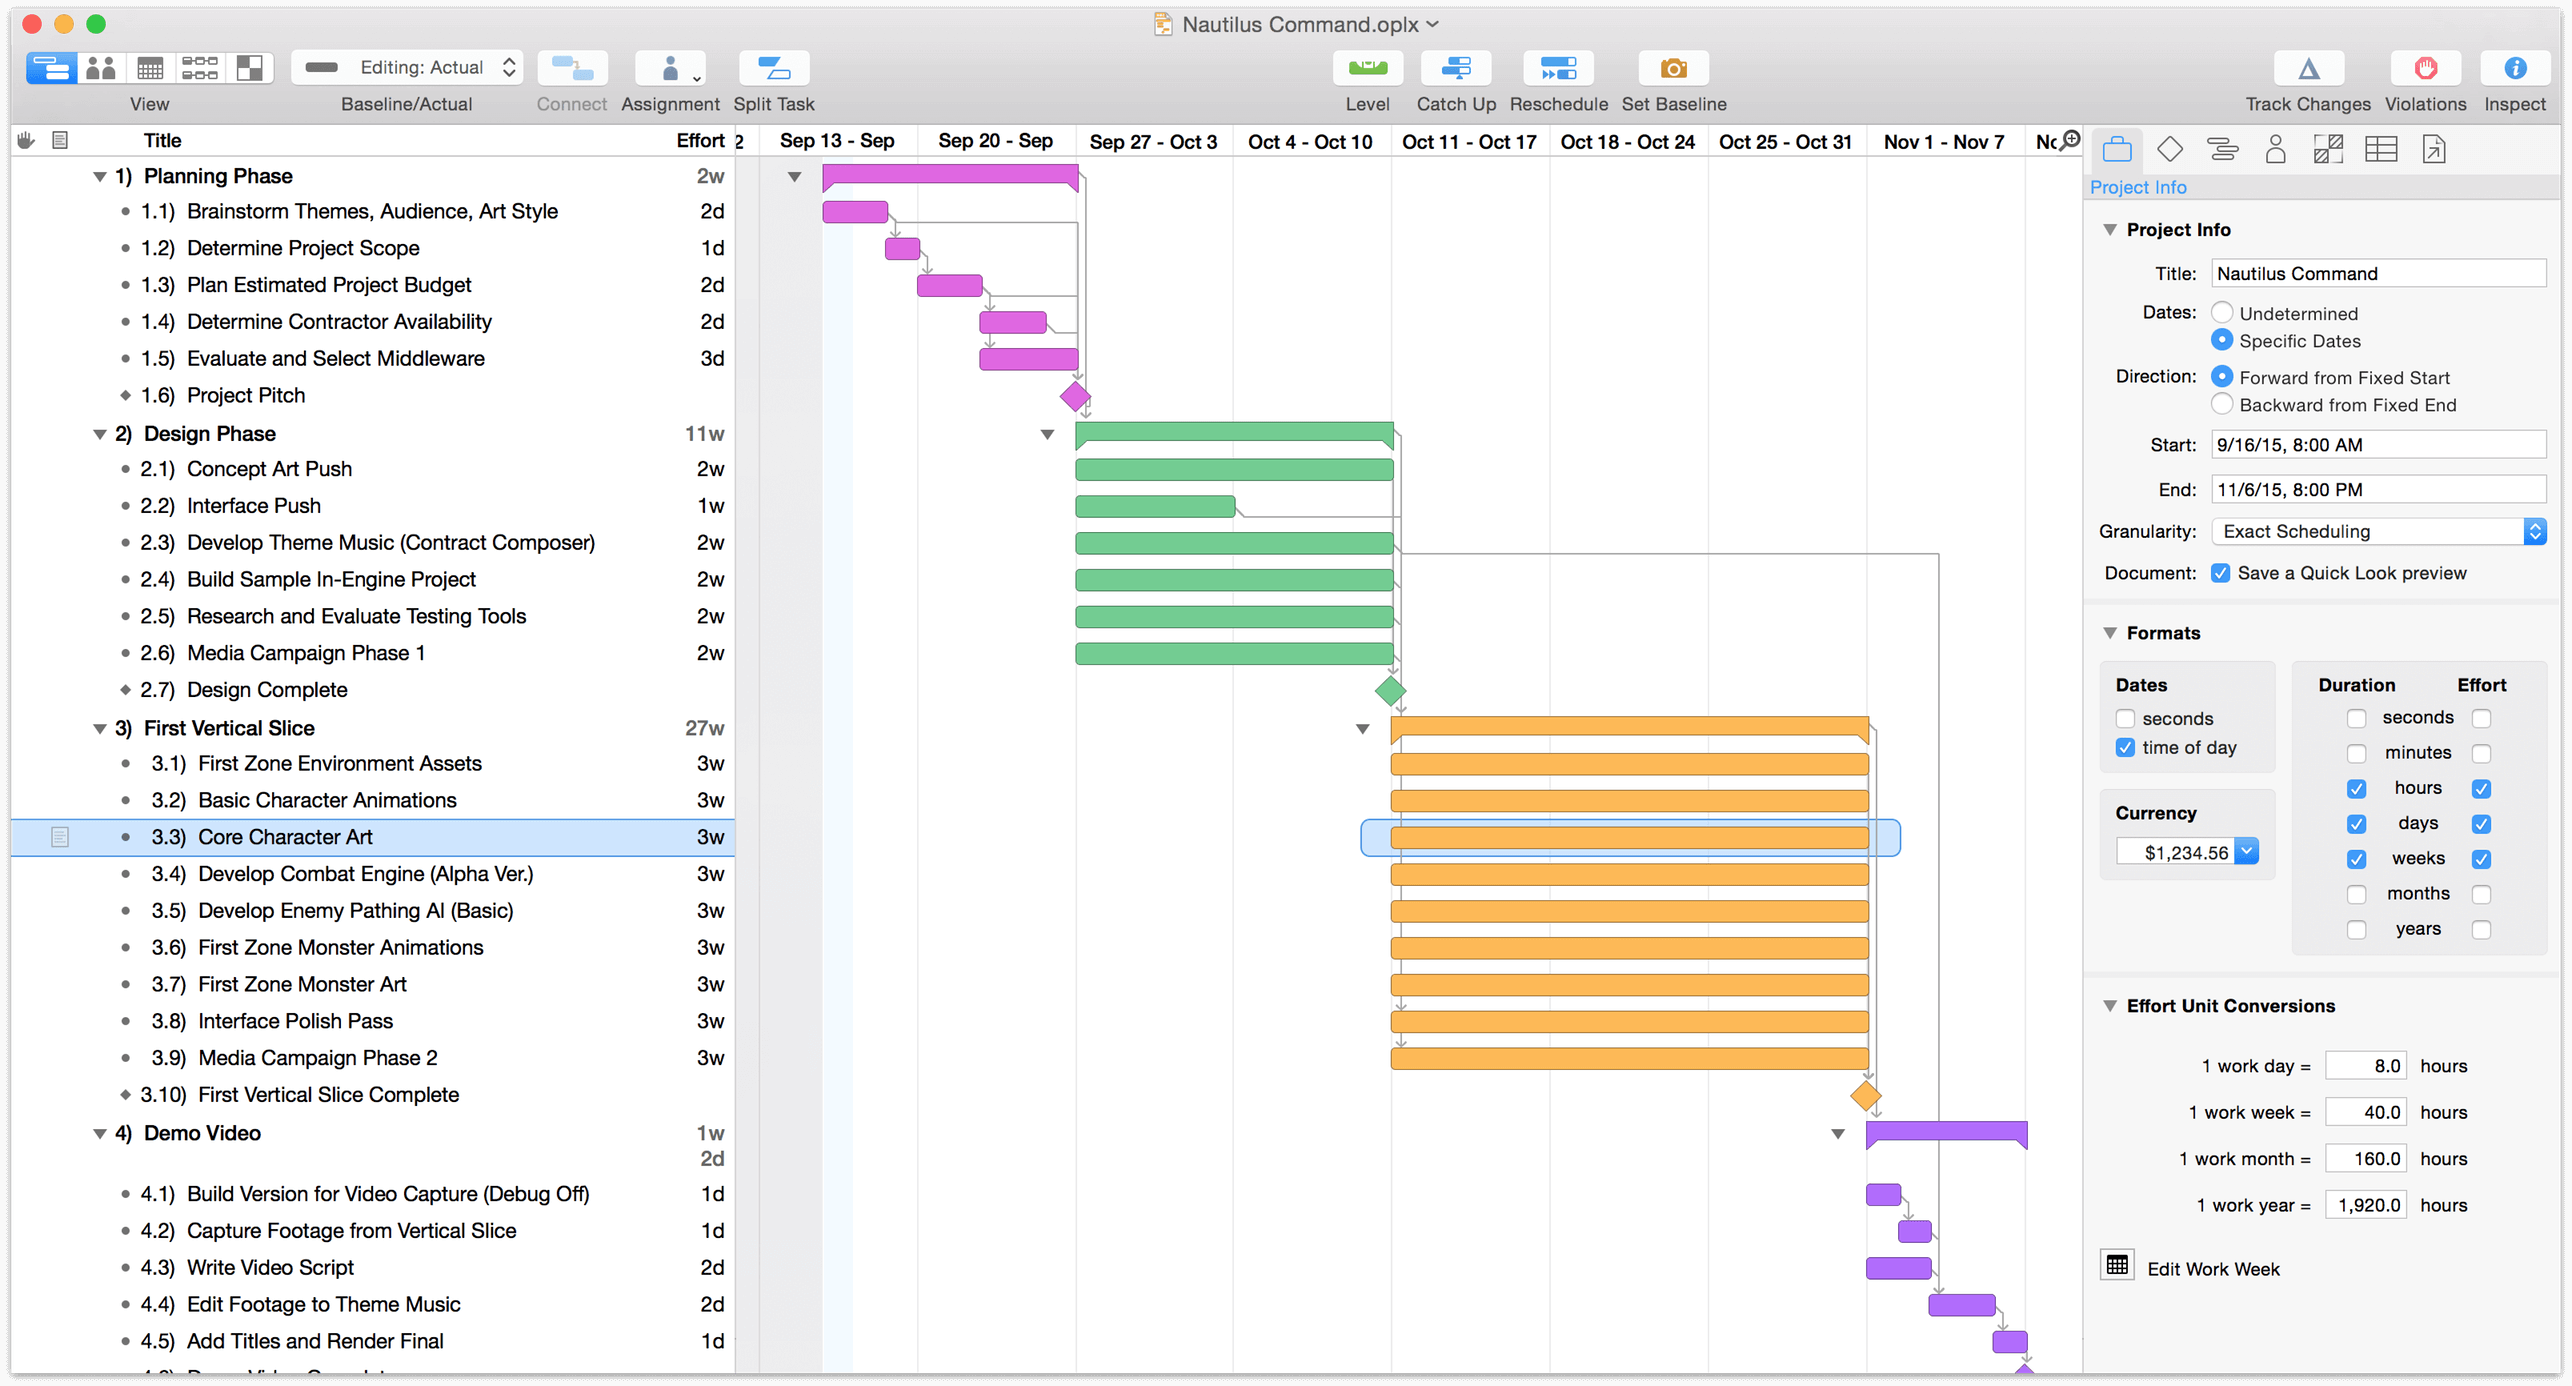
If your average work day isn’t 8 hours long (or your work week doesn’t add up to 40 hours), you should visit the Project inspector’s Effort Unit Coversions section and change the hours per day (or hours per week) setting, so that your task duration and effort calculations will make sense.
Step 6: Setting Schedule Exceptions
Even the most accommodating work week will occasionally have days that are out of the ordinary. Whether it’s a national holiday, a team-wide training seminar, an industry expo or conference, or just a patch of bad weather that keeps folks out of the office, setting exceptions to the regular work schedule can be key to keeping a project on track.
Still in calendar view, choose Extra & Off Hours from the toggle below the resource list. Here you can change the work hours for a specific week, to account for exceptions such as holidays or overtime.
One that we know is in the future for our project is the upcoming Thanksgiving. We can add that to our schedule right now. Use the arrows bracketing the current month to navigate to November, then click on the week of Thanksgiving (the 26th) to access the exceptions calendar for that week.
To quickly remove working time from the schedule, you can Shift-drag, creating a red box that marks normal working time as unavailable.
To add extra hours, double-click and drag to create a blue box which represents available hours apart from the normal working hours.
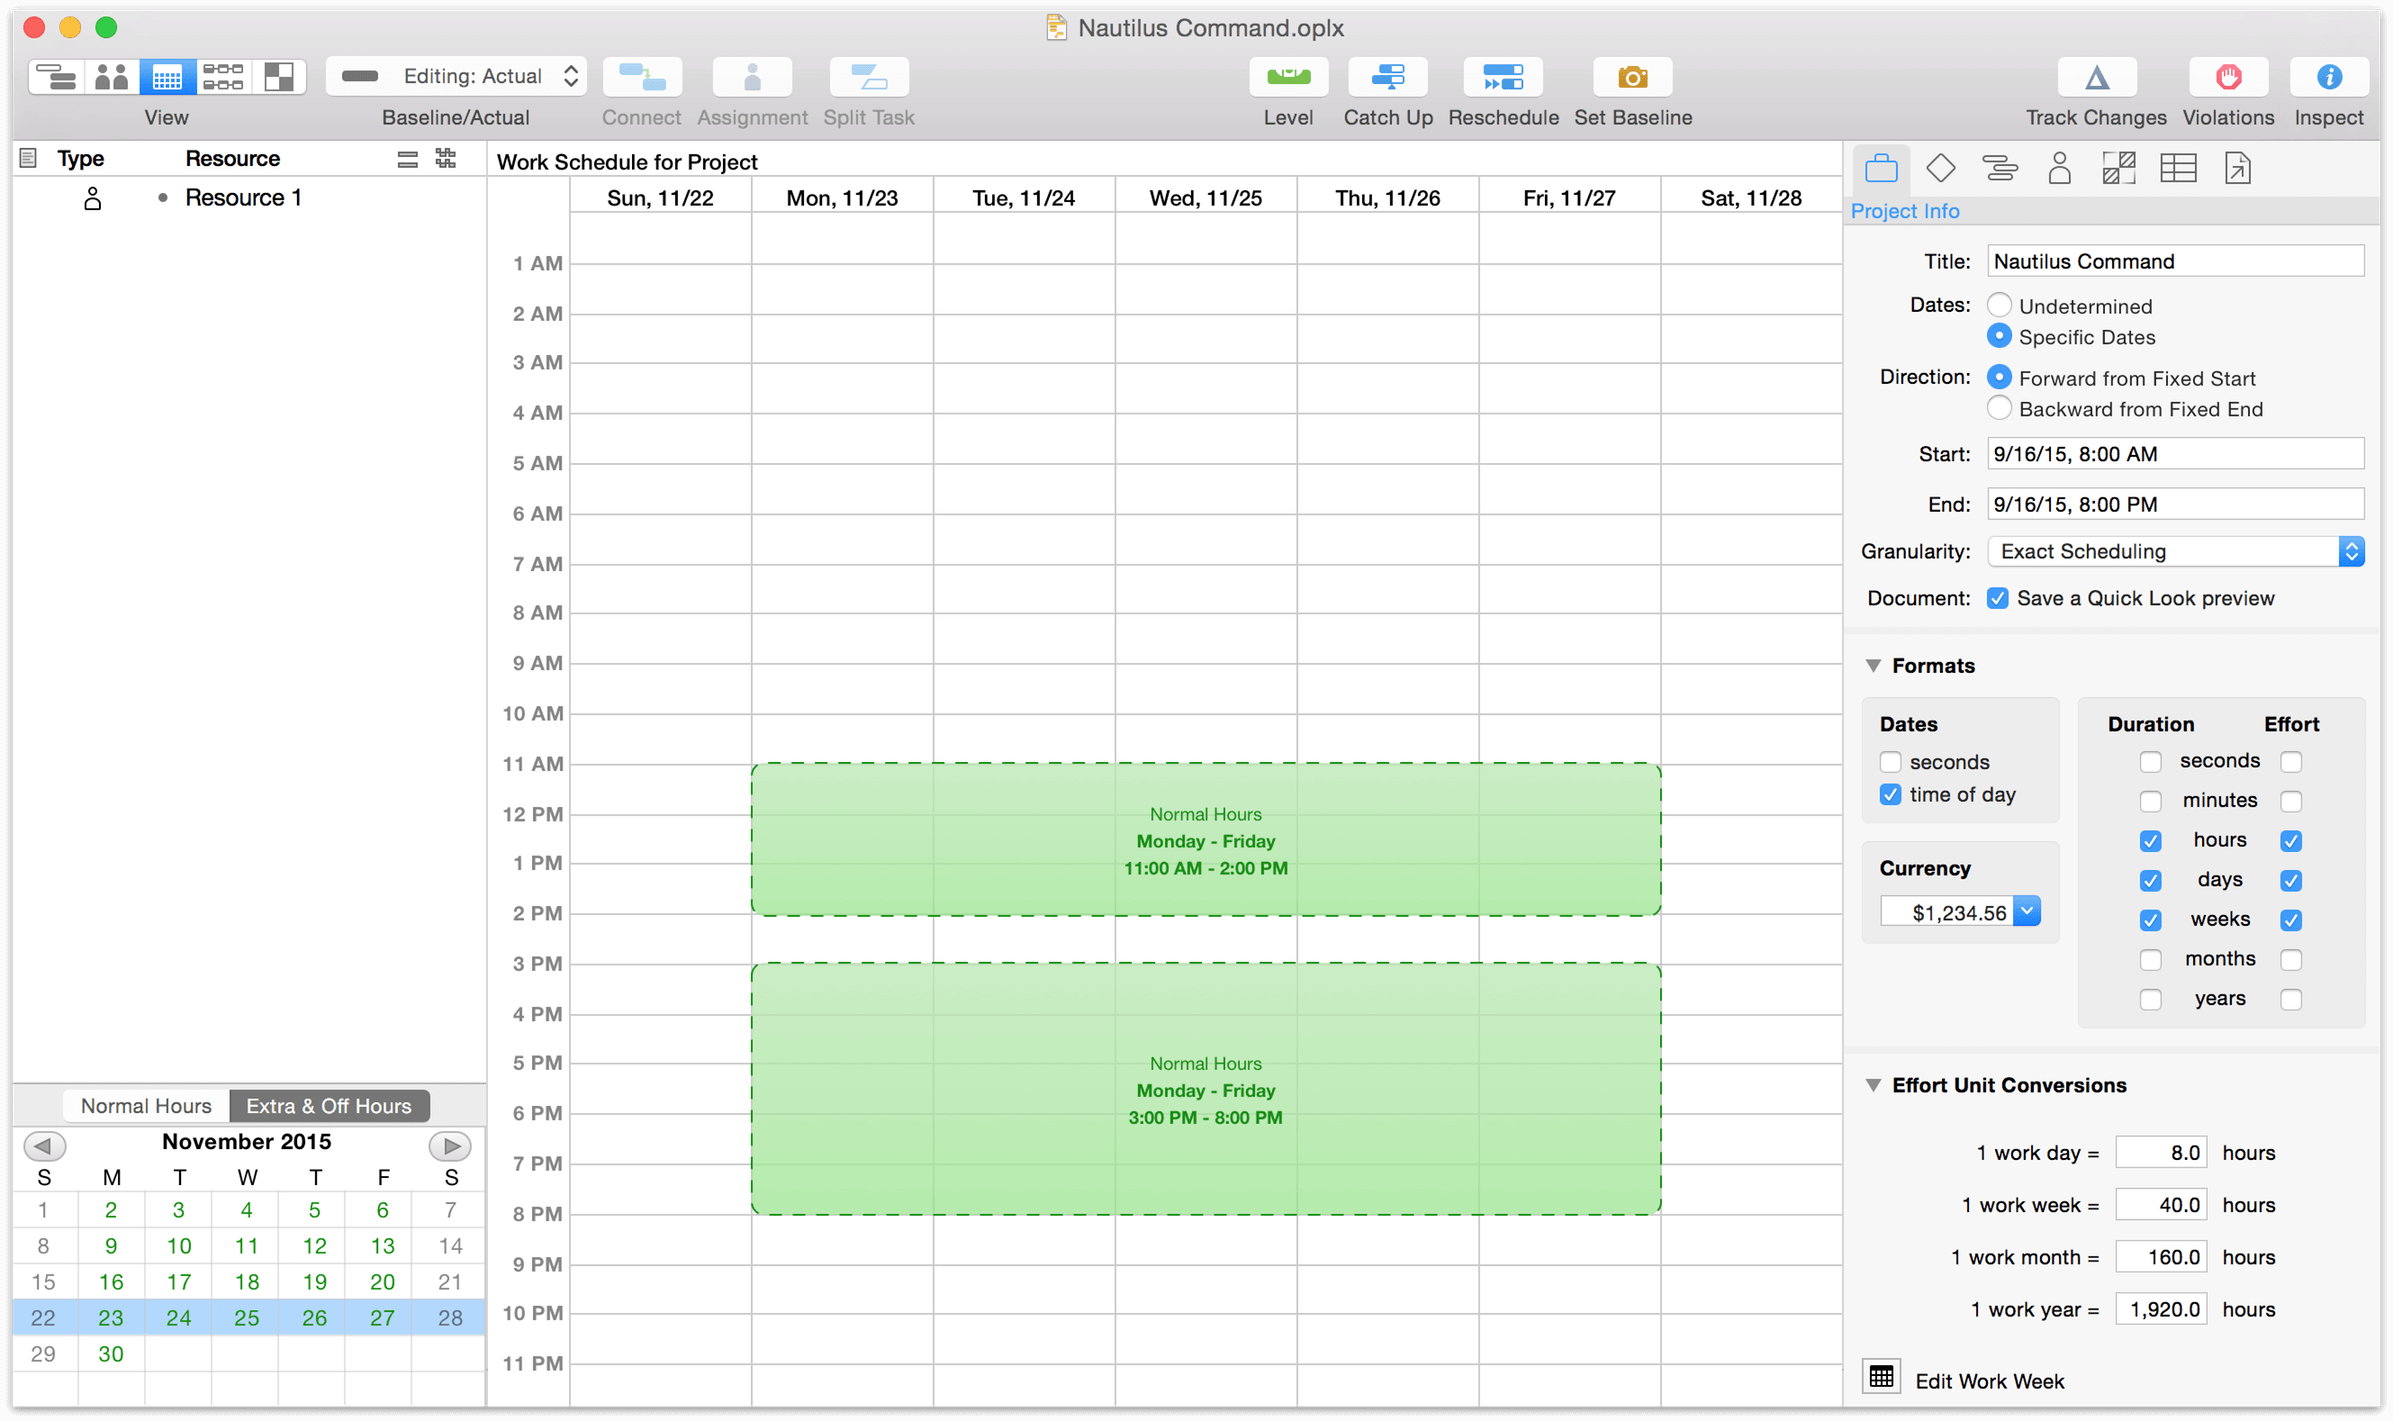
We know we want to take Thanksgiving and the following Friday off, but we can also predict that this week will be crunch mode for the team. We create a block of time that covers the 26th and 27th, and then replace that lost time with overtime hours earlier in the week.
When making changes to the schedule for the whole project, be sure not to have any resources selected in the sidebar. Editing the calendar with a resource selected will change the schedule for that specific resource rather than the project as a whole (see Step 12: Setting Individual Schedule Exceptions for more on how to do this).
Step 7: Setting Task Durations
Now we can begin to scope out how long each task will take.
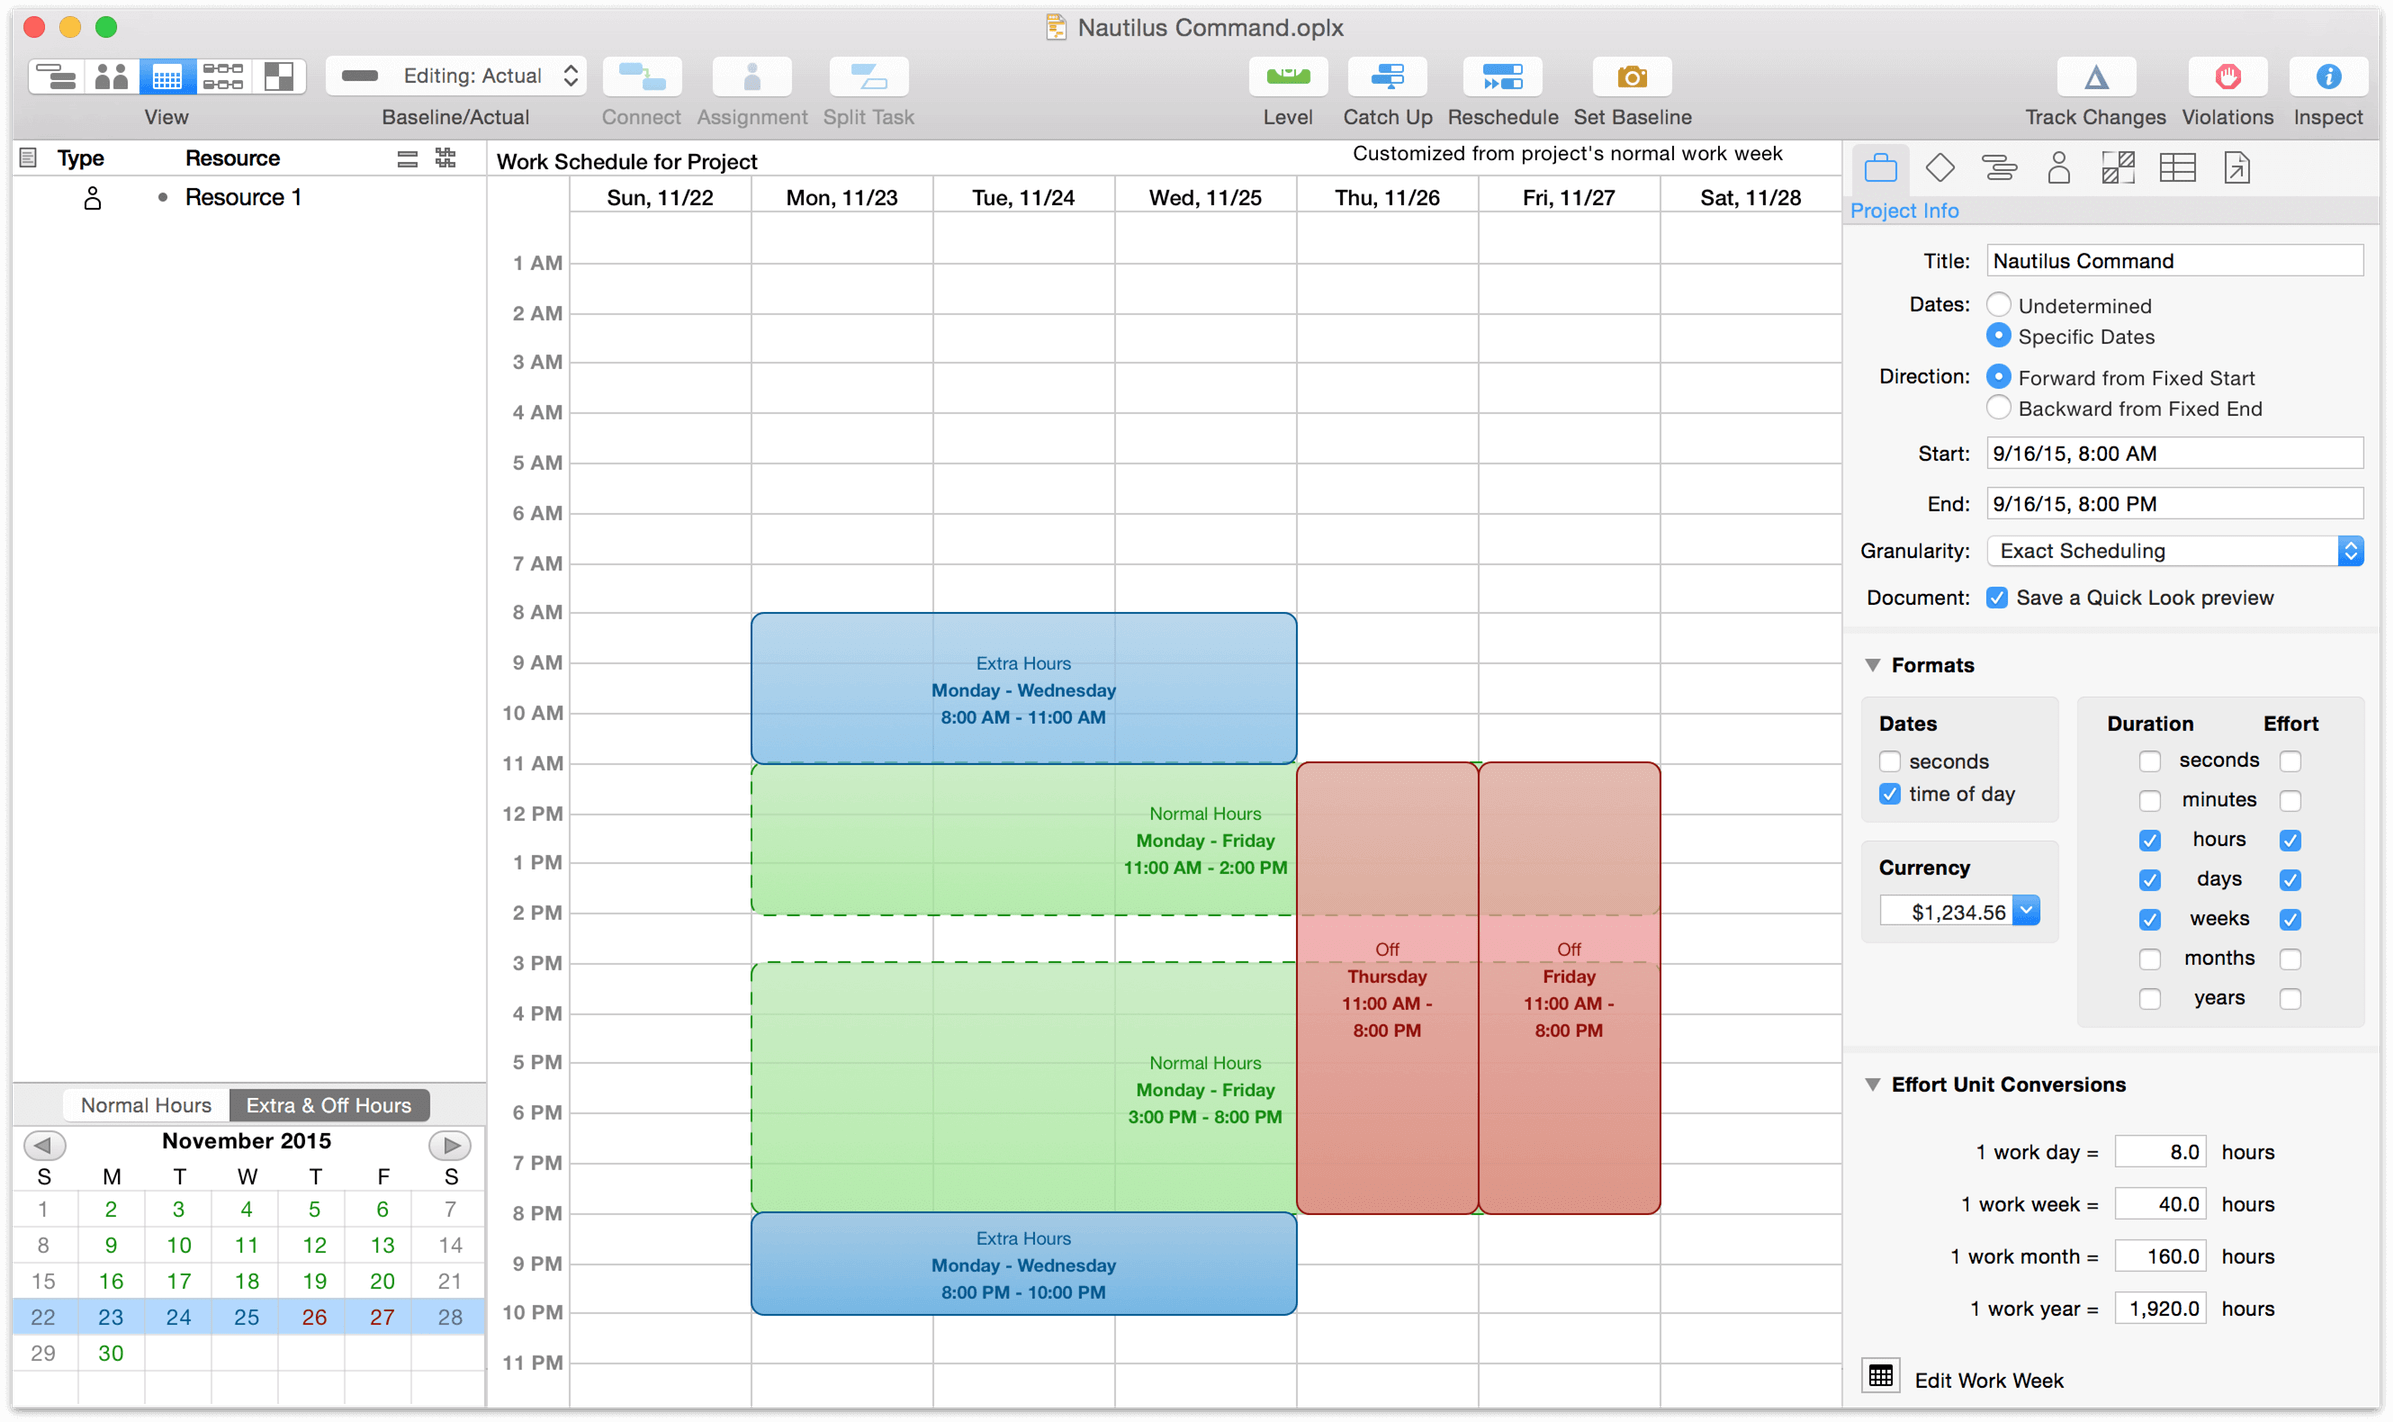
Use the view switcher to get back to task view. Each task takes a certain amount of time to complete. You can set a task’s duration by typing in the Duration column of the task outline, or by clicking and dragging the ridges on the right end of a bar in the Gantt chart. If you’re typing durations, you can use unit abbreviations like 2d (2 days), 1w (1 week), and so on.
The length of the bar in the Gantt chart represents the duration.
Step 8: Grouping Tasks
When tasks are closely related or interdependent it can be useful to put them in a group. Groups help organize a project conceptually, and also act as meta-tasks that can be linked via dependencies to other tasks or groups.
Select some tasks and choose Structure ▸ Group (Option-Command-L) to group them. Grouped tasks are indented in the outline, and represented by a parent task of the “group” type, which can be named like any other task.
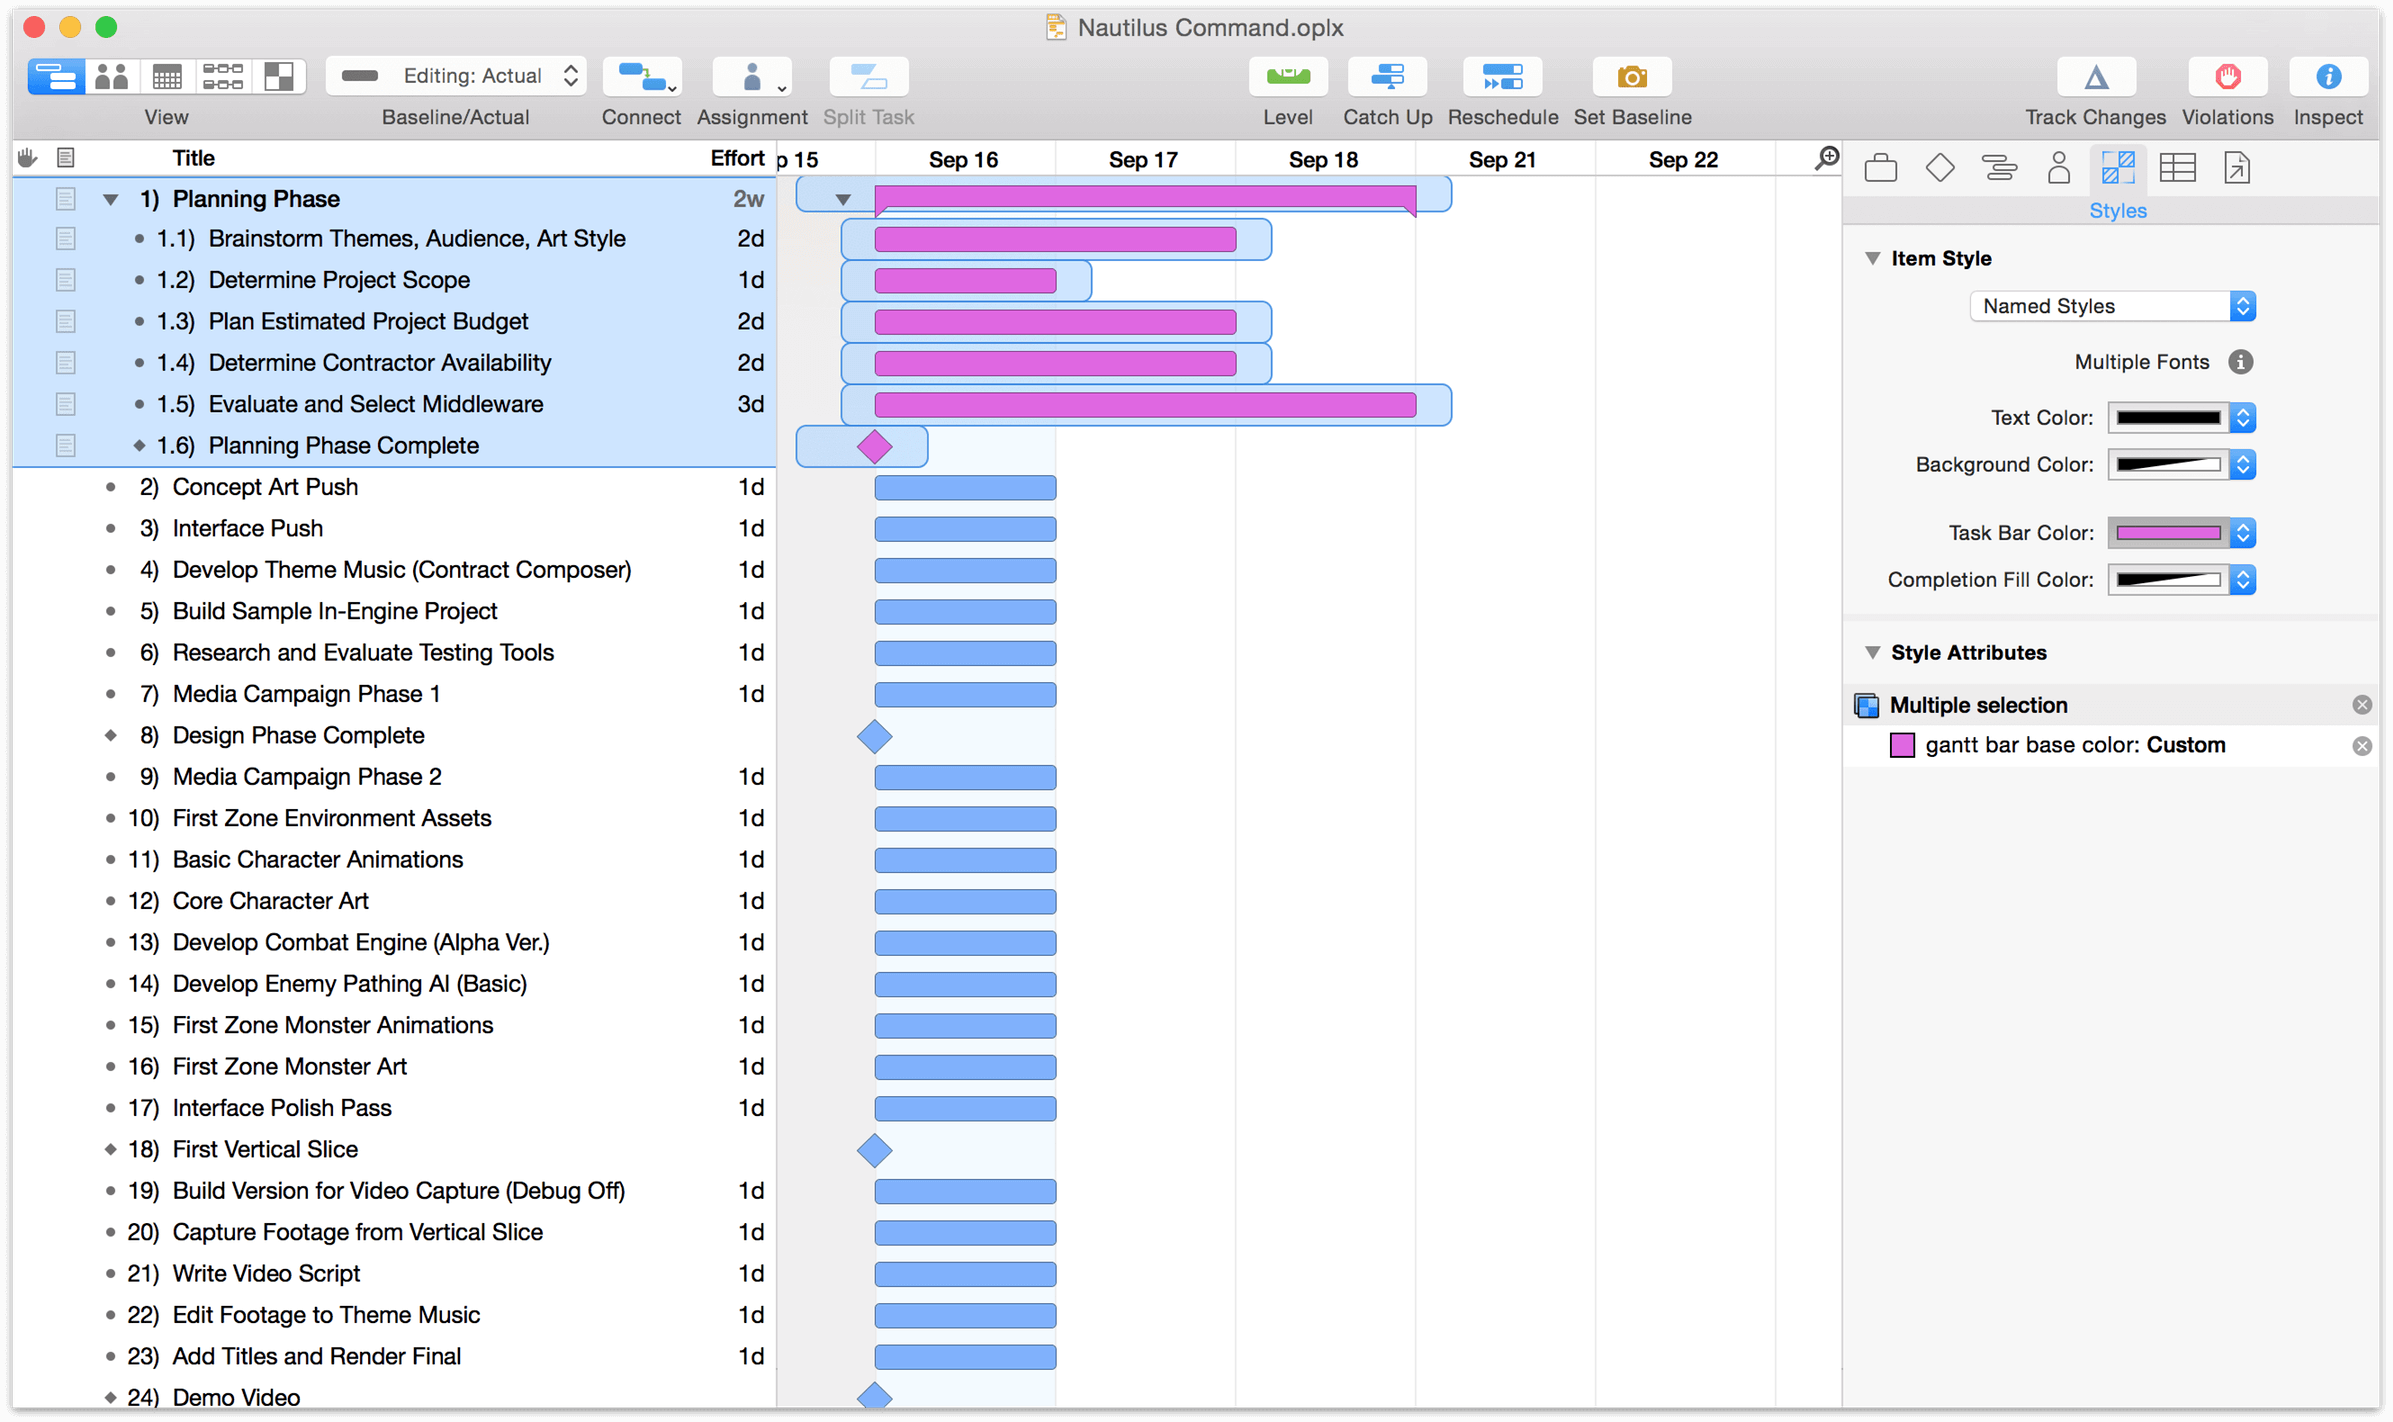
With all of the tasks in the group selected, this would be a good time to add a bit of visual distinction to the group as well. Go to the Styles inspector and choose a color in the Task Bar Color section that will identify all of the tasks in the group.
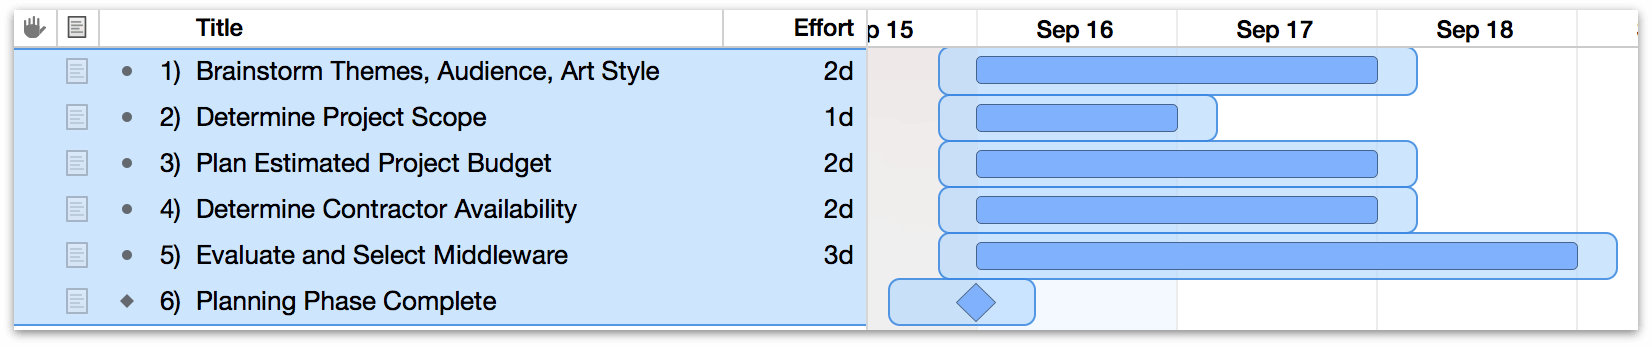
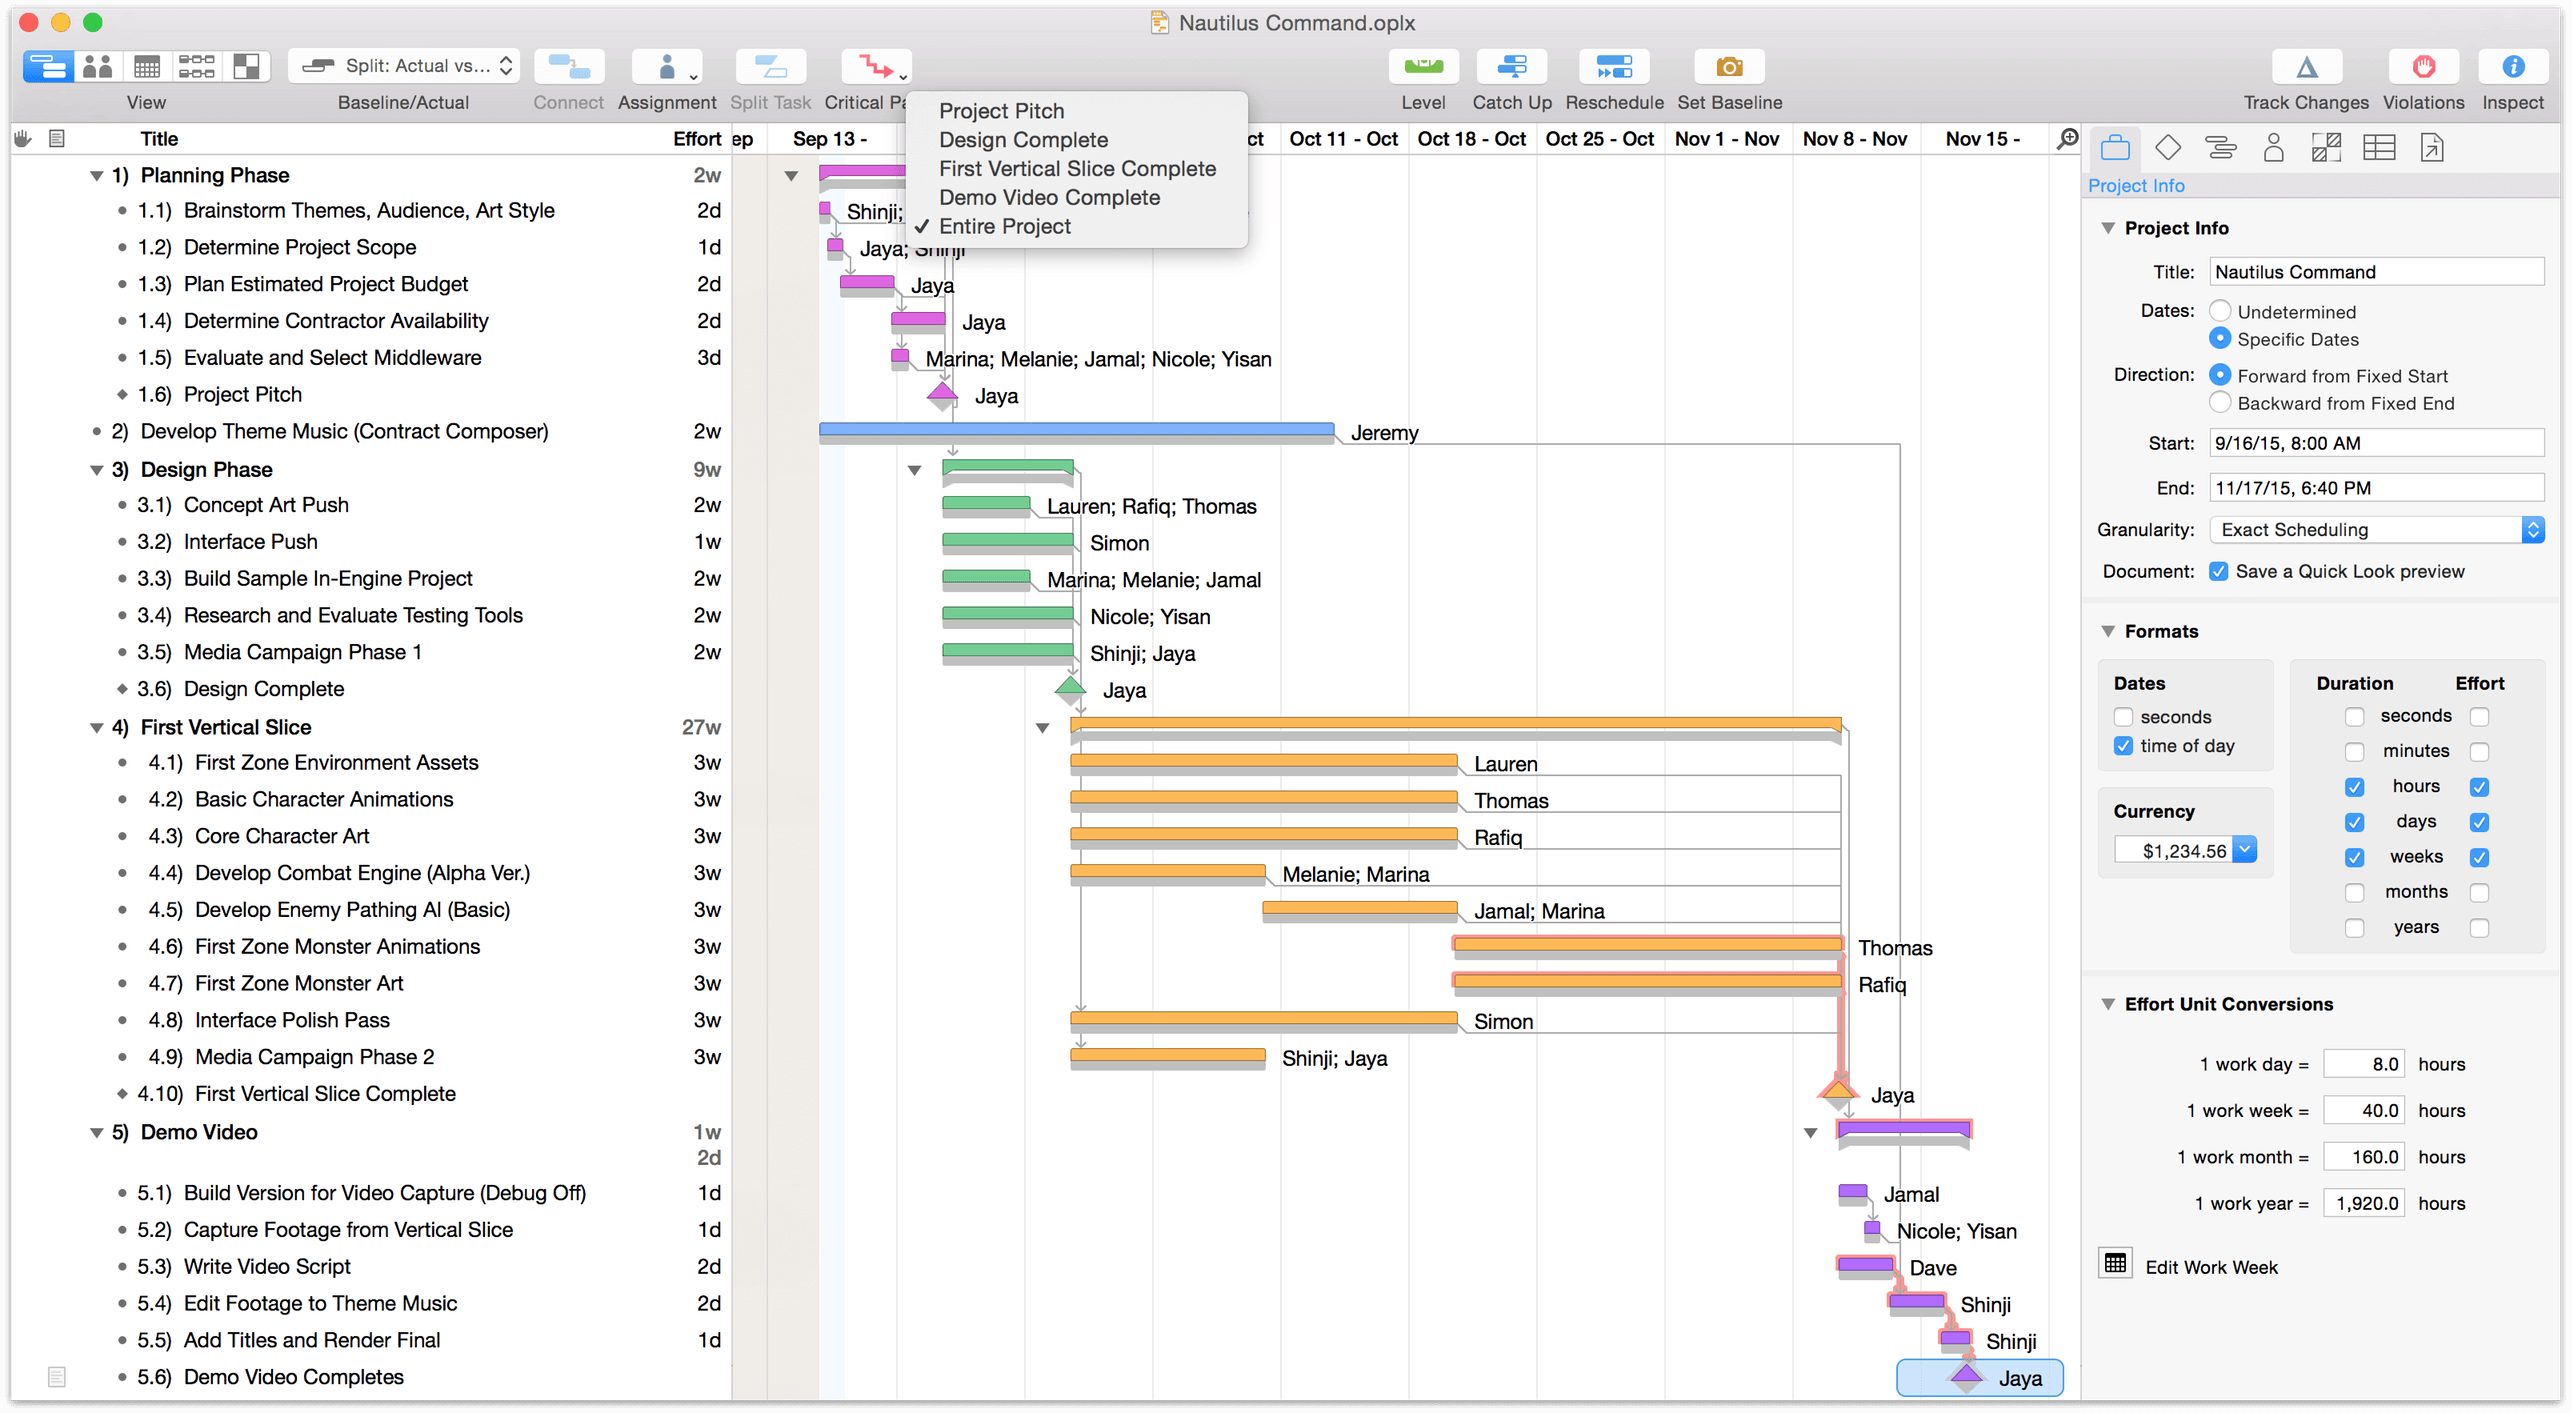
After organizing tasks and milestones into groups and estimating the time required to complete them, we’re starting to get a better picture of how our project will take shape. At this stage our Gantt chart looks something like this:
In the figure above, the scale of the Gantt chart has been changed from days to weeks to get a better idea of the relative durations assigned to tasks. To change the Gantt chart’s scale, Control-click on the date bar and choose a time unit, or drag left or right on the bar to make fine adjustments.
Step 9: Connecting Tasks with Dependency Lines
We can’t complete all of our tasks simultaneously! Even if we had the resources to do so, some parts of the project can’t happen until others are finished. Thankfully, the pieces are now in place to establish the ways that those tasks are dependent on the status of others. There are four ways that dependencies can exist:
- Finish ▸ Start dependencies are the most common type, indicating that when task A finishes, task B can start.
- Start ▸ Finish dependencies indicate that when task A starts, task B can finish.
- Start ▸ Start dependencies indicate that when task A starts, task B can also start.
- Finish ▸ Finish dependencies indicate that when task A finishes, task B can also finish.
Select two tasks which need to be connected, and click the Connection button in the toolbar. A Finish ▸ Start dependency line appears between the tasks, starting from the task which comes first in the outline. You can also draw dependencies right in the Gantt chart by clicking an arrow on the end of a selected task and dragging it to the beginning of the next.
The type of dependency is based on the start- and end-points of the arrow: dragging an arrow from the completion of one task to the beginning of another will create a finish ▸ start dependency, and so on.
As you connect tasks, they automatically reschedule to respect the dependencies.

Milestones, like other types of tasks, can be connected with dependency lines. If you find that your tasks don’t look like they’re as well positioned in the Gantt chart as their dependencies would indicate, you can click drag their rows to rearrange them vertically in the outline for a more natural flow.
Remove dependencies by selecting all the relevant tasks and choosing Structure ▸ Disconnect Tasks (Control-Command-Minus) or Disconnect from the drop-down Connection toolbar button menu.
Step 10: Creating Resources
Now it’s time to start adding the team members, equipment and materials we’ll be using to bring the project to fruition. Every person, piece of infrastructure, and raw ingredient that contributes to reaching the project’s goal is counted as a resource, so let’s get started.
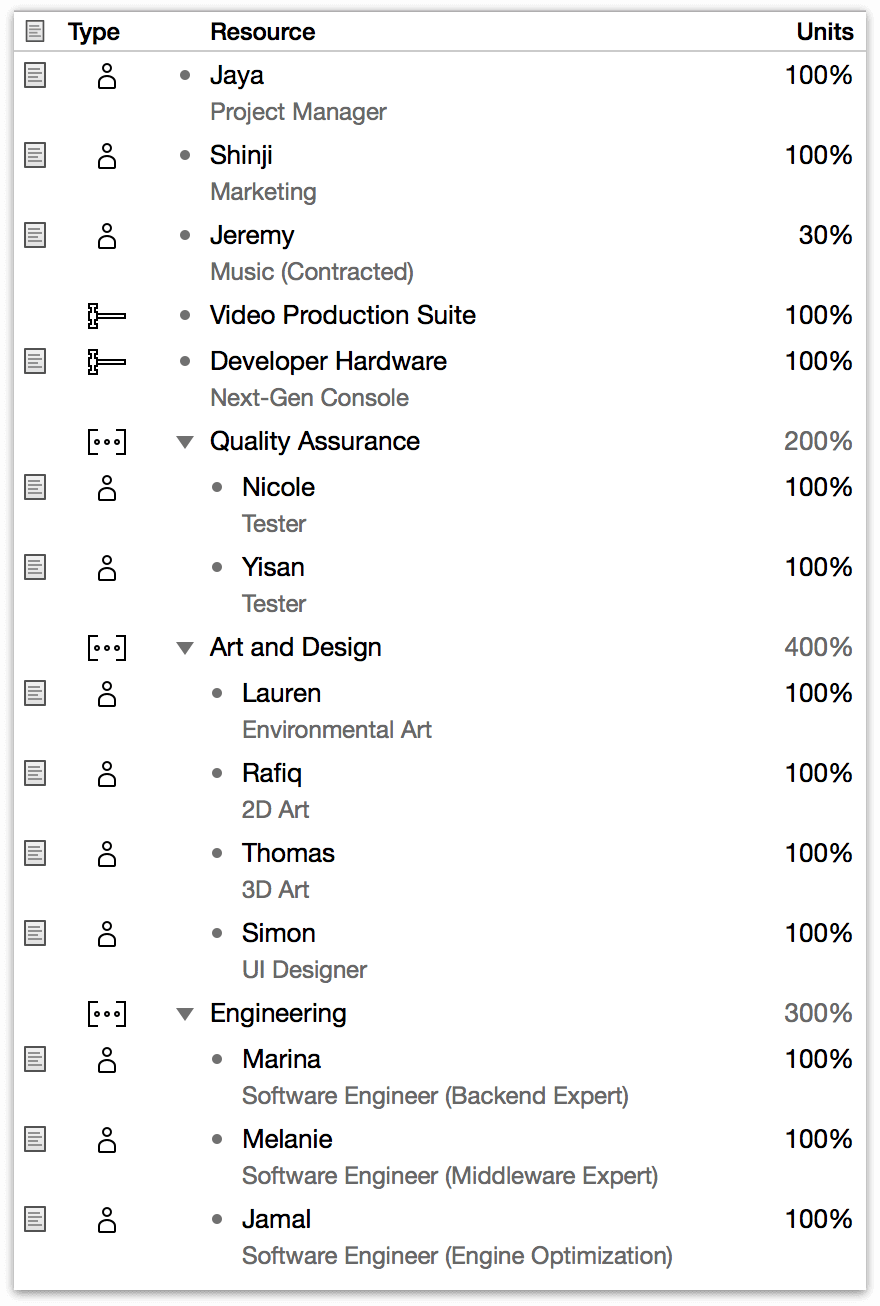
Creating resources works much like creating tasks. Switch to Resource View, which contains the resource outline. Create a few resources (as simple as pressing Return) and name them. Then click the Type icon for each one and choose whether it is Staff (a human team member), Equipment (a piece of gear), or Material (consumable goods). Like tasks, resources can also exist in hierarchical groups.
A timeline appears on the right side of the view for each resource you create, but it is empty until you assign the resource to some tasks.
As with the task outline, the resource outline contains a few default columns alongside the resource’s name and type (as mentioned above). Note offers a handy space for details on the resource (a staff member’s job title, for example), while Units represents the percentage of the resource available for work on this project.
Along with adding notes to our resources, this is a good time to start considering costs. Adding the Cost/Hour and Cost/Use columns to the resource outline and entering relevant cost information (like a team member’s hourly wage) will help us start planning the budget of the project when it comes time to assign resources to tasks.
Another useful property of staff resources is email address, which can be set in the Information section of the Resource inspector. A staff member’s email address is used as their unique identifier across all projects they’re participating in, which is particularly important when balancing workloads across multiple projects or comparing projects with Dashboards in OmniPlan Pro.
Step 11: Assigning Resources
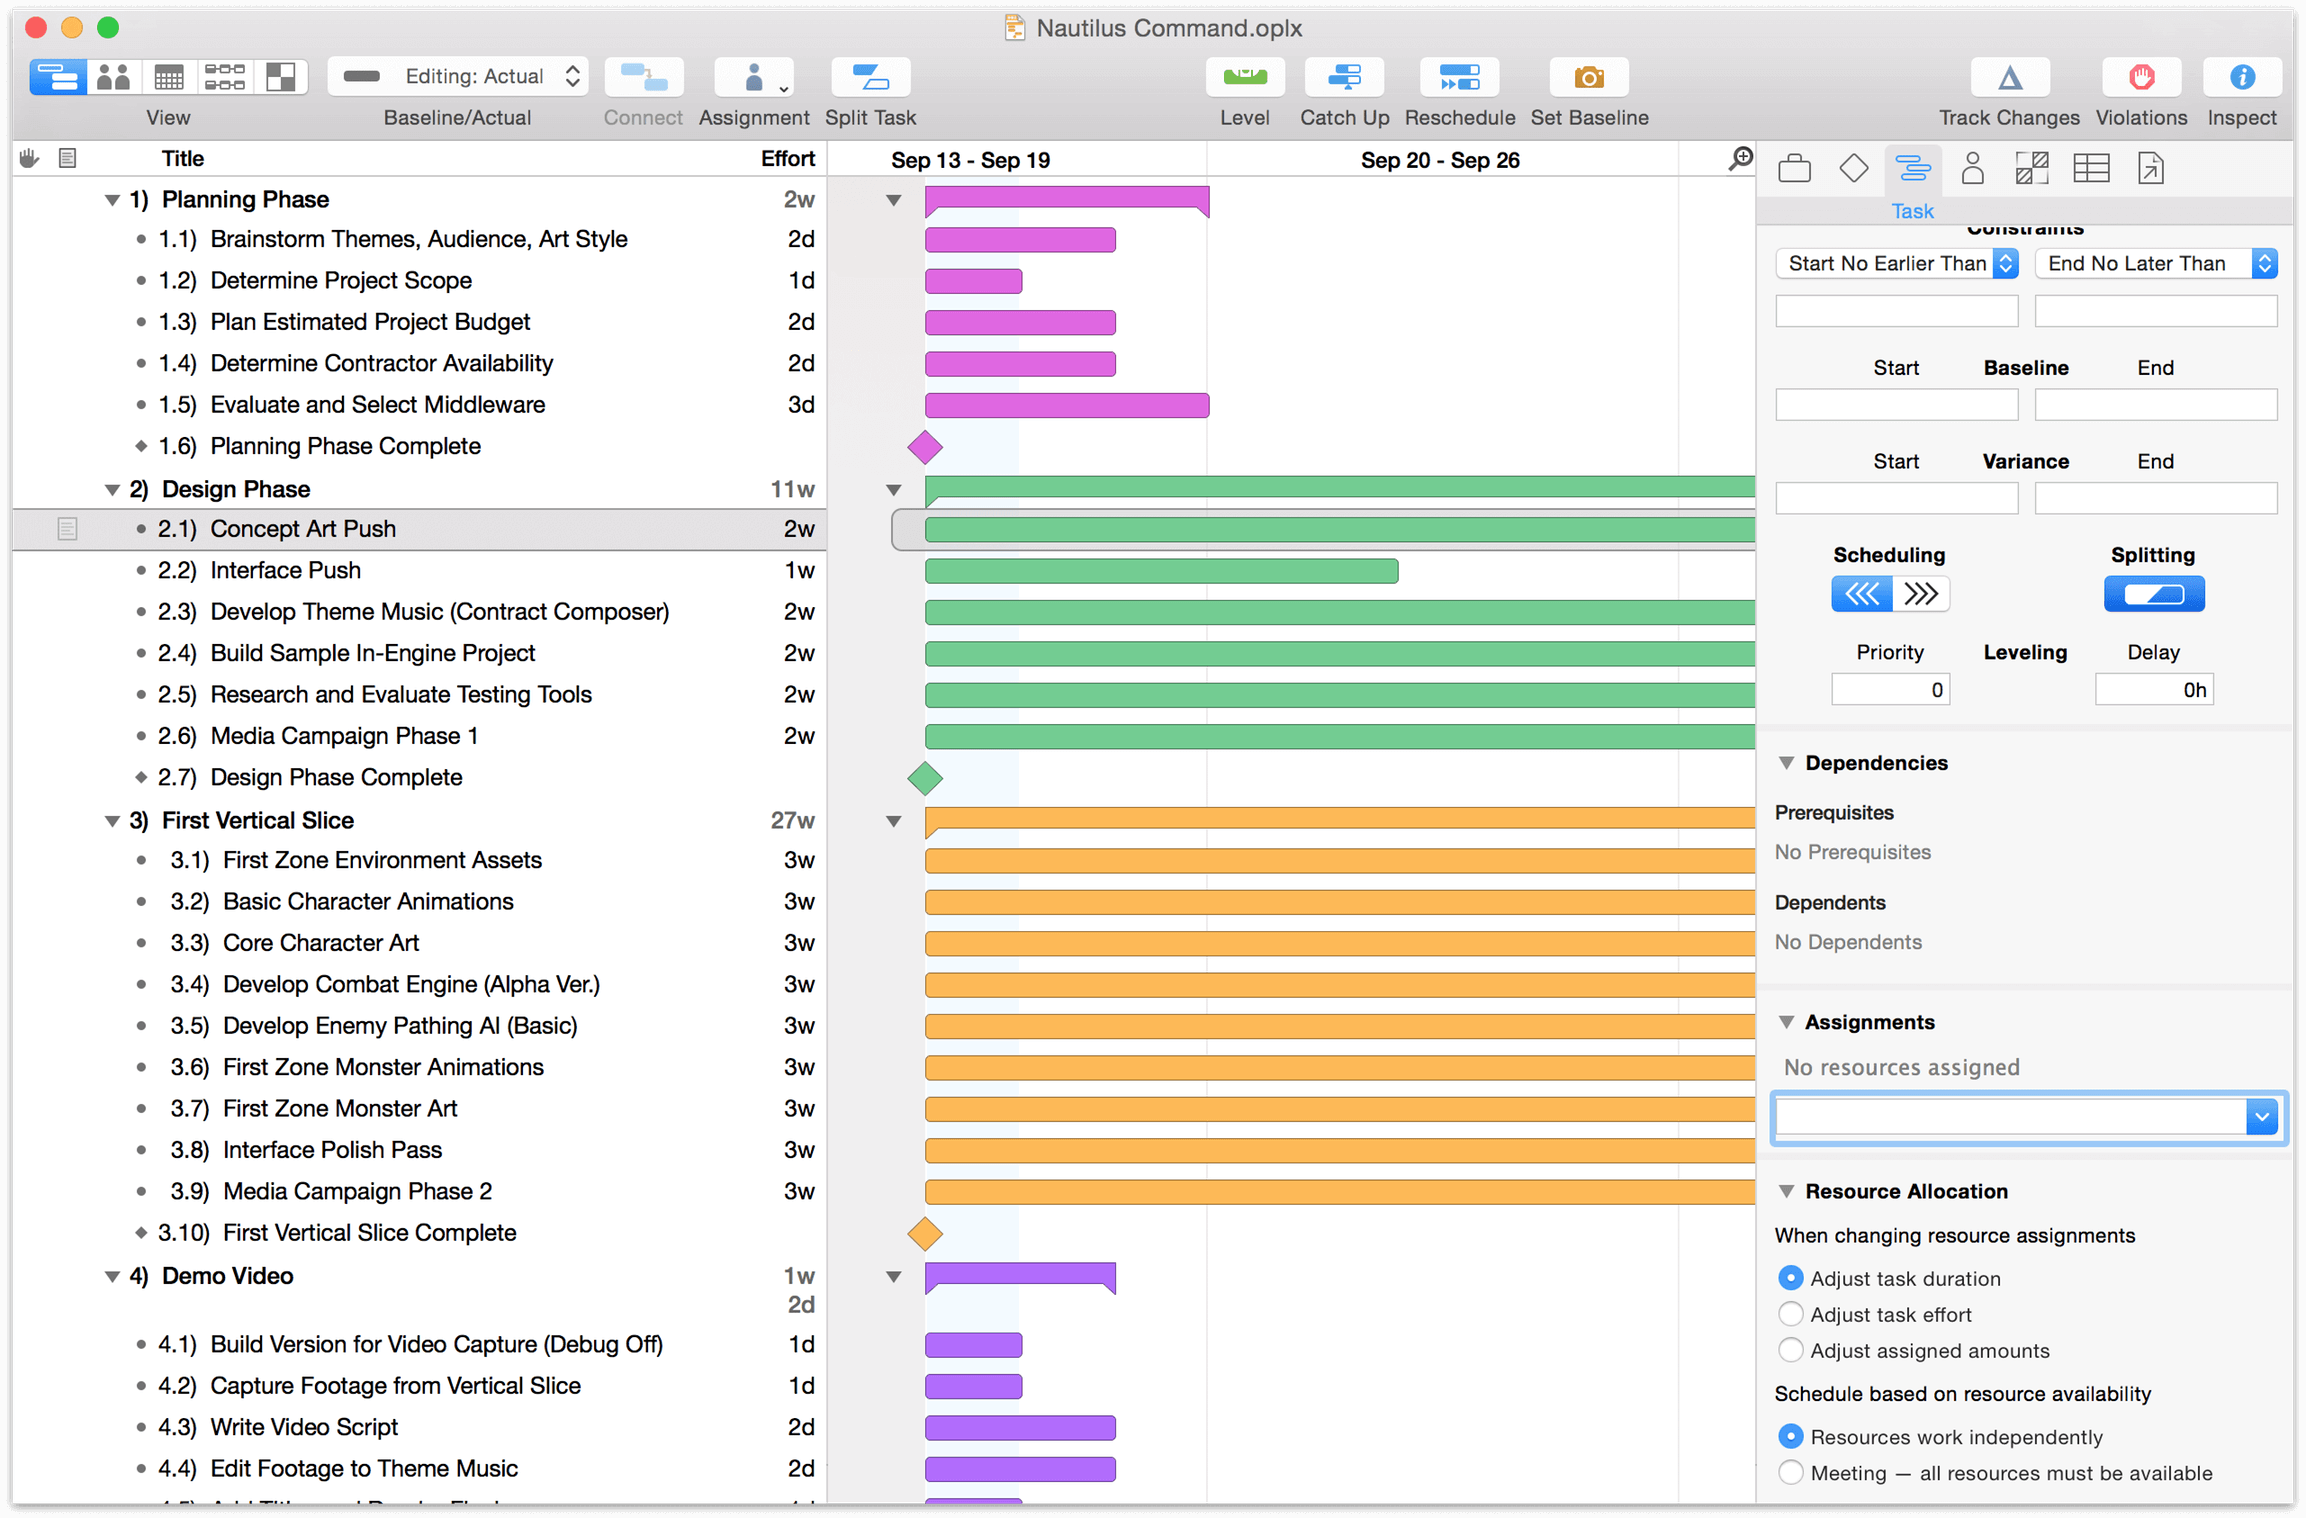
You can assign resources to tasks from Task View or from Resource View.
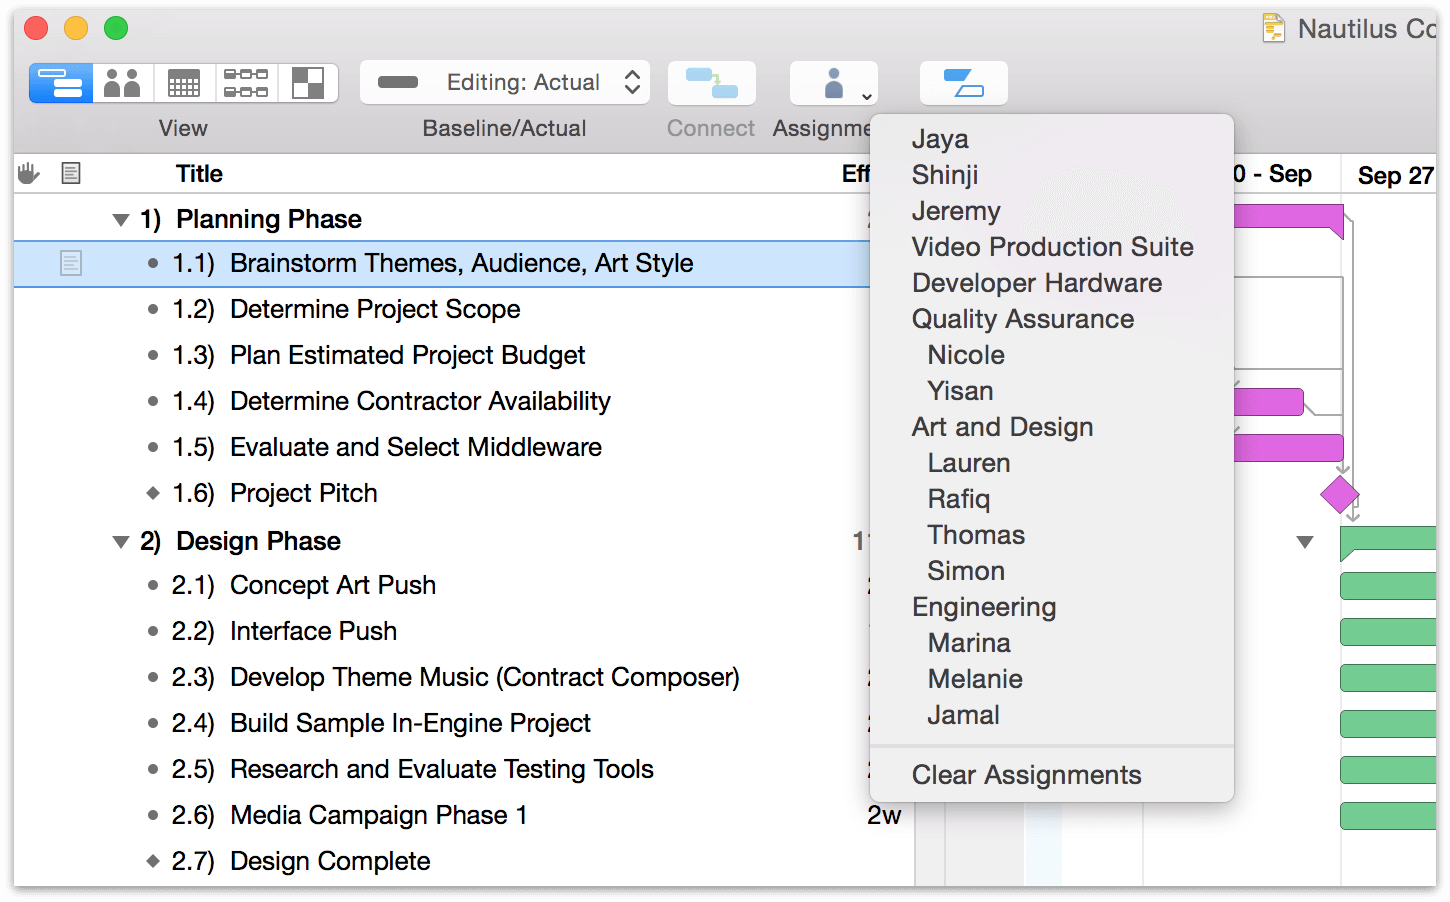
In Task View, you can select the task and then use the Assignments section of the Task inspector to select which resources should be assigned to it.
Or you can just pop open the menu on the Assignment button in the toolbar.
In resource view, you can assign a task by dragging it from the Unassigned timeline (or the sidebar) into a resource’s timeline.
When you begin assigning resources to tasks, you’ll notice some task durations visibly shift in the Gantt chart. This is because of duration’s relationship with effort. Effort is the number of resource-hours needed to complete the task, while duration is the amount of time the task actually requires given the resources assigned to it. With multiple staff members assigned full time to a task, its duration in real time will diminish from that originally allocated.
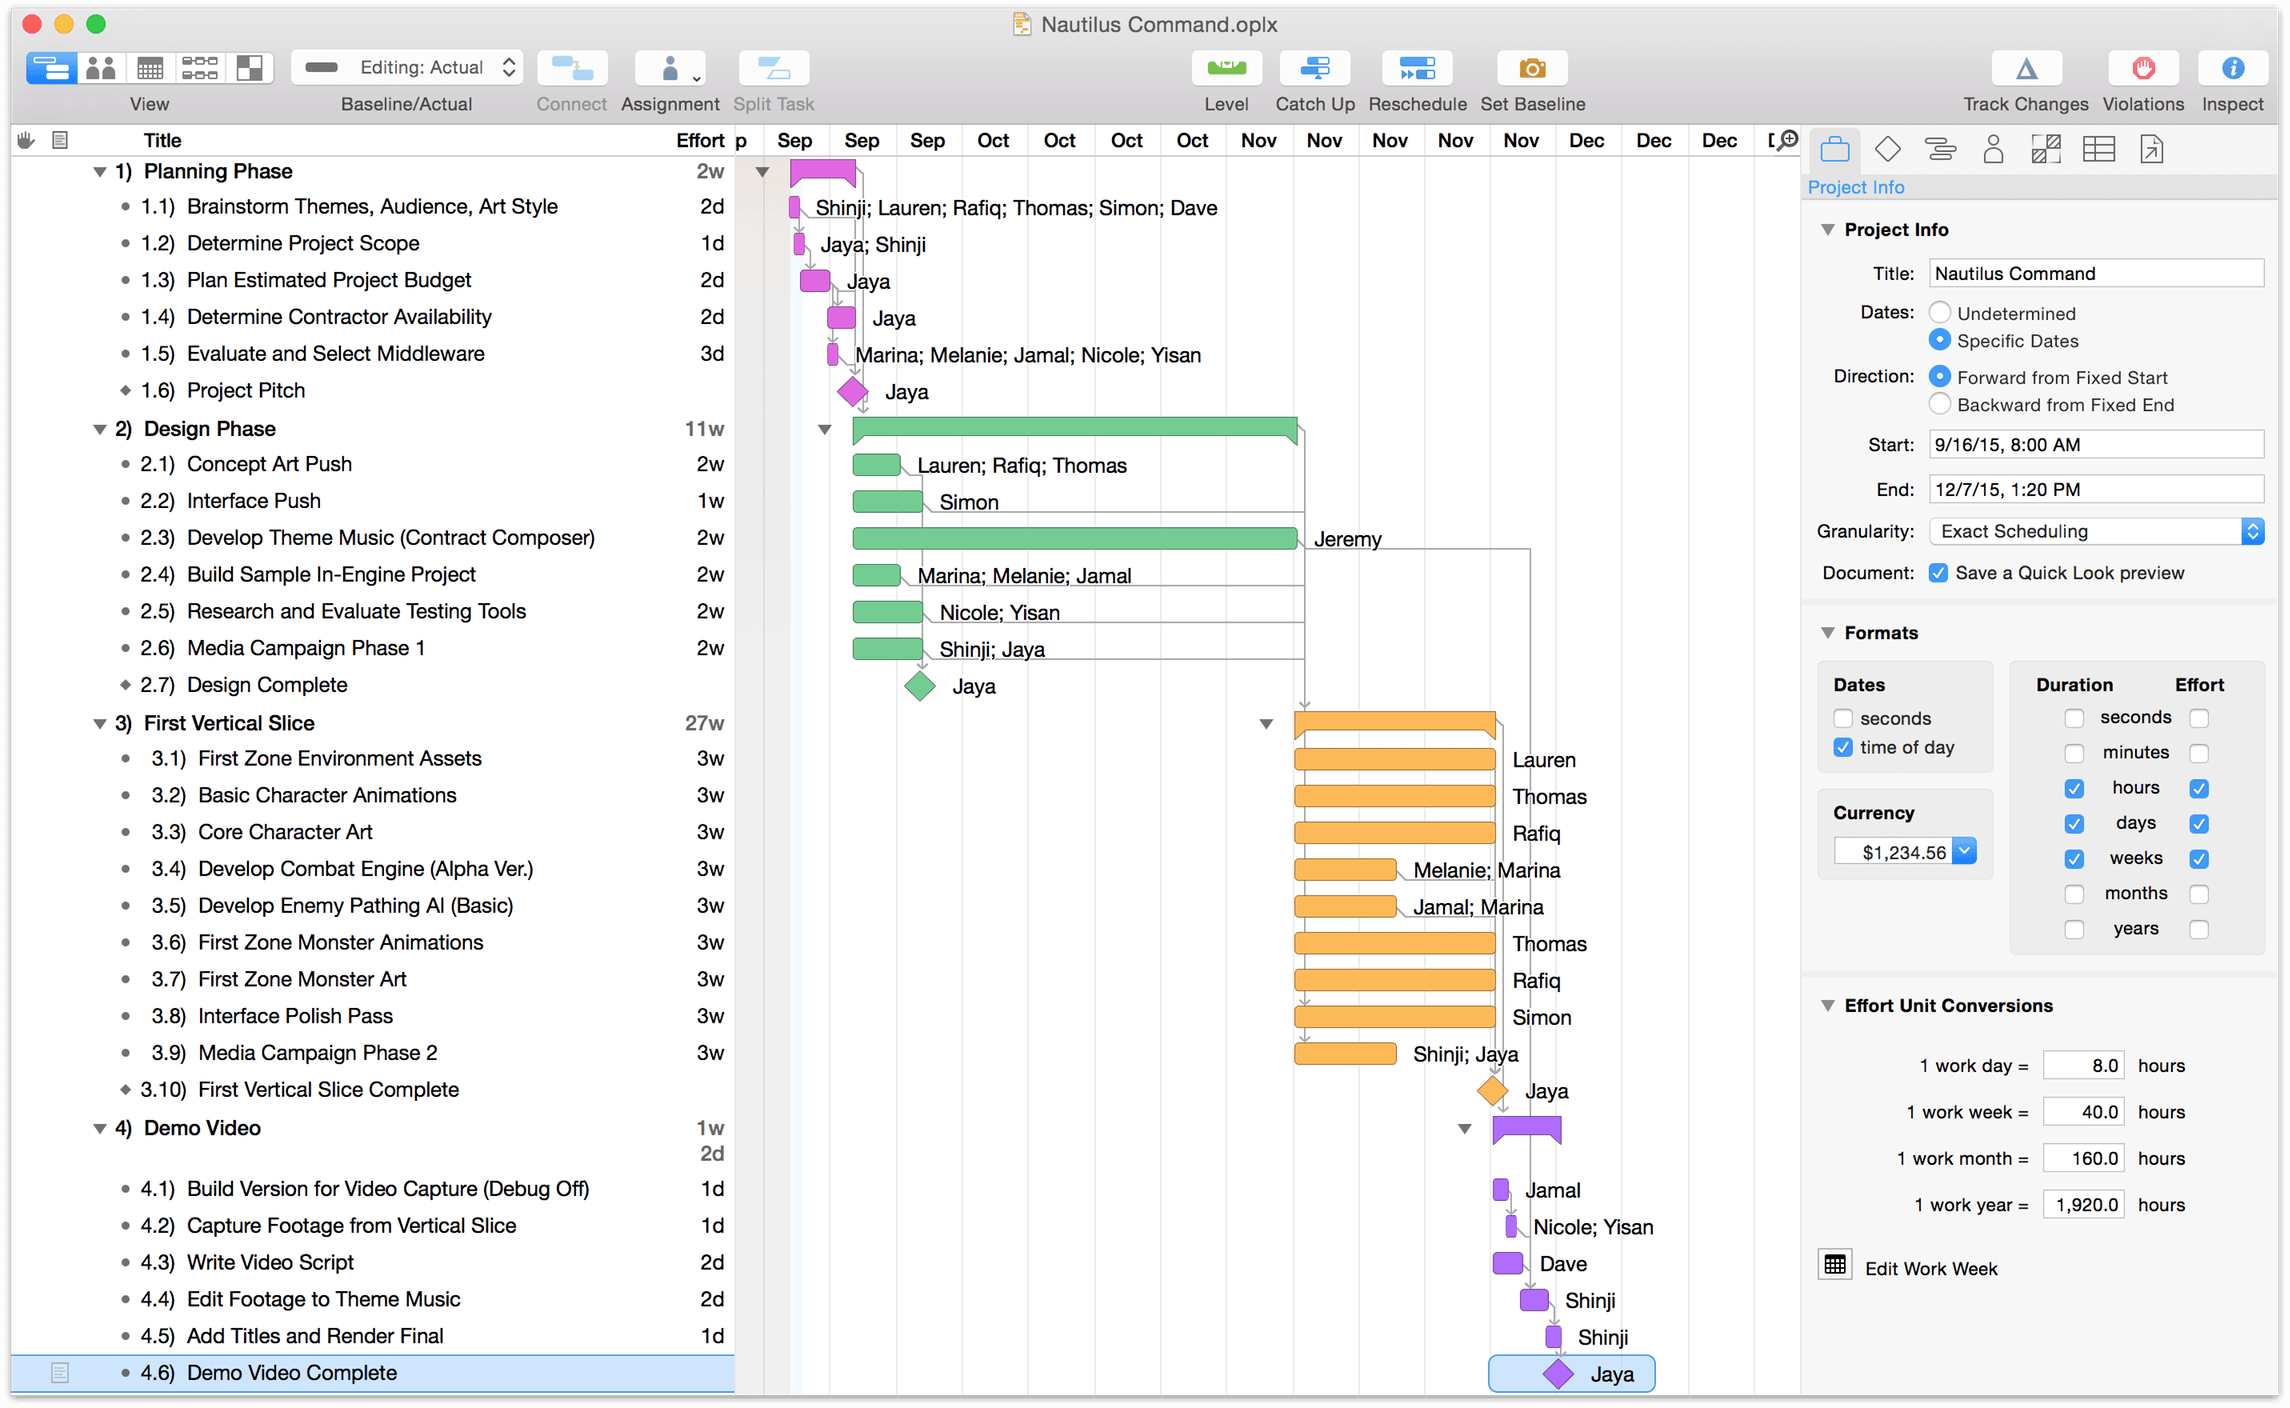
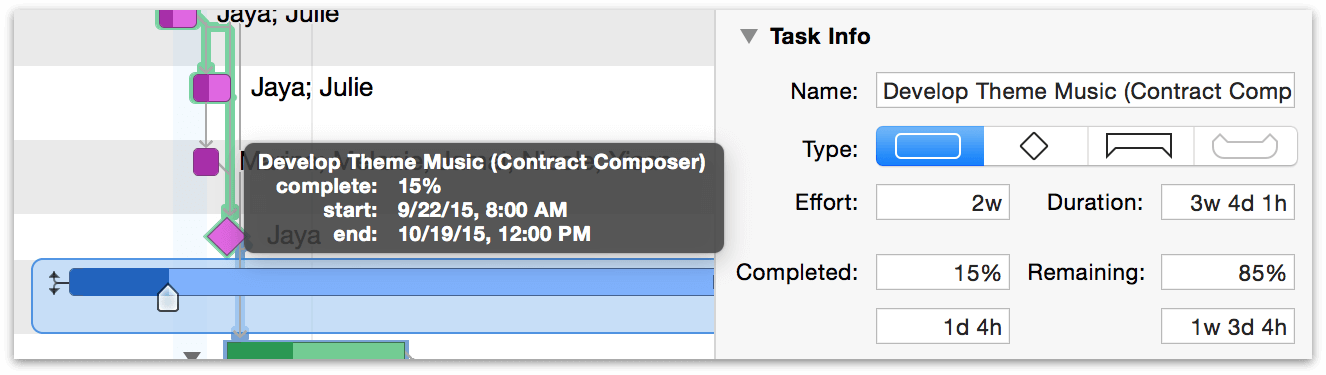
As we start building out our relationship of dependencies and resources, we can see a potential problem area: since our contract musician Jeremy has other projects on his plate, he can only contribute 30% of his time to our game. A task that should take two weeks turns to more than six. We’ll want to find a way to avoid this delay; we can ask him to start work earlier, or incentivize him to devote more of his time to our project.
Step 12: Setting Individual Schedule Exceptions
Individual staff members may have personalized work schedules, and they’ll almost certainly have individual needs for time off. In the calendar view, choose a resource in the sidebar and create a regular weekly schedule for the resource just as you did for the project as a whole; then choose Extra & Off Hours from the toggle below the resource list and repeat the process for exceptions.
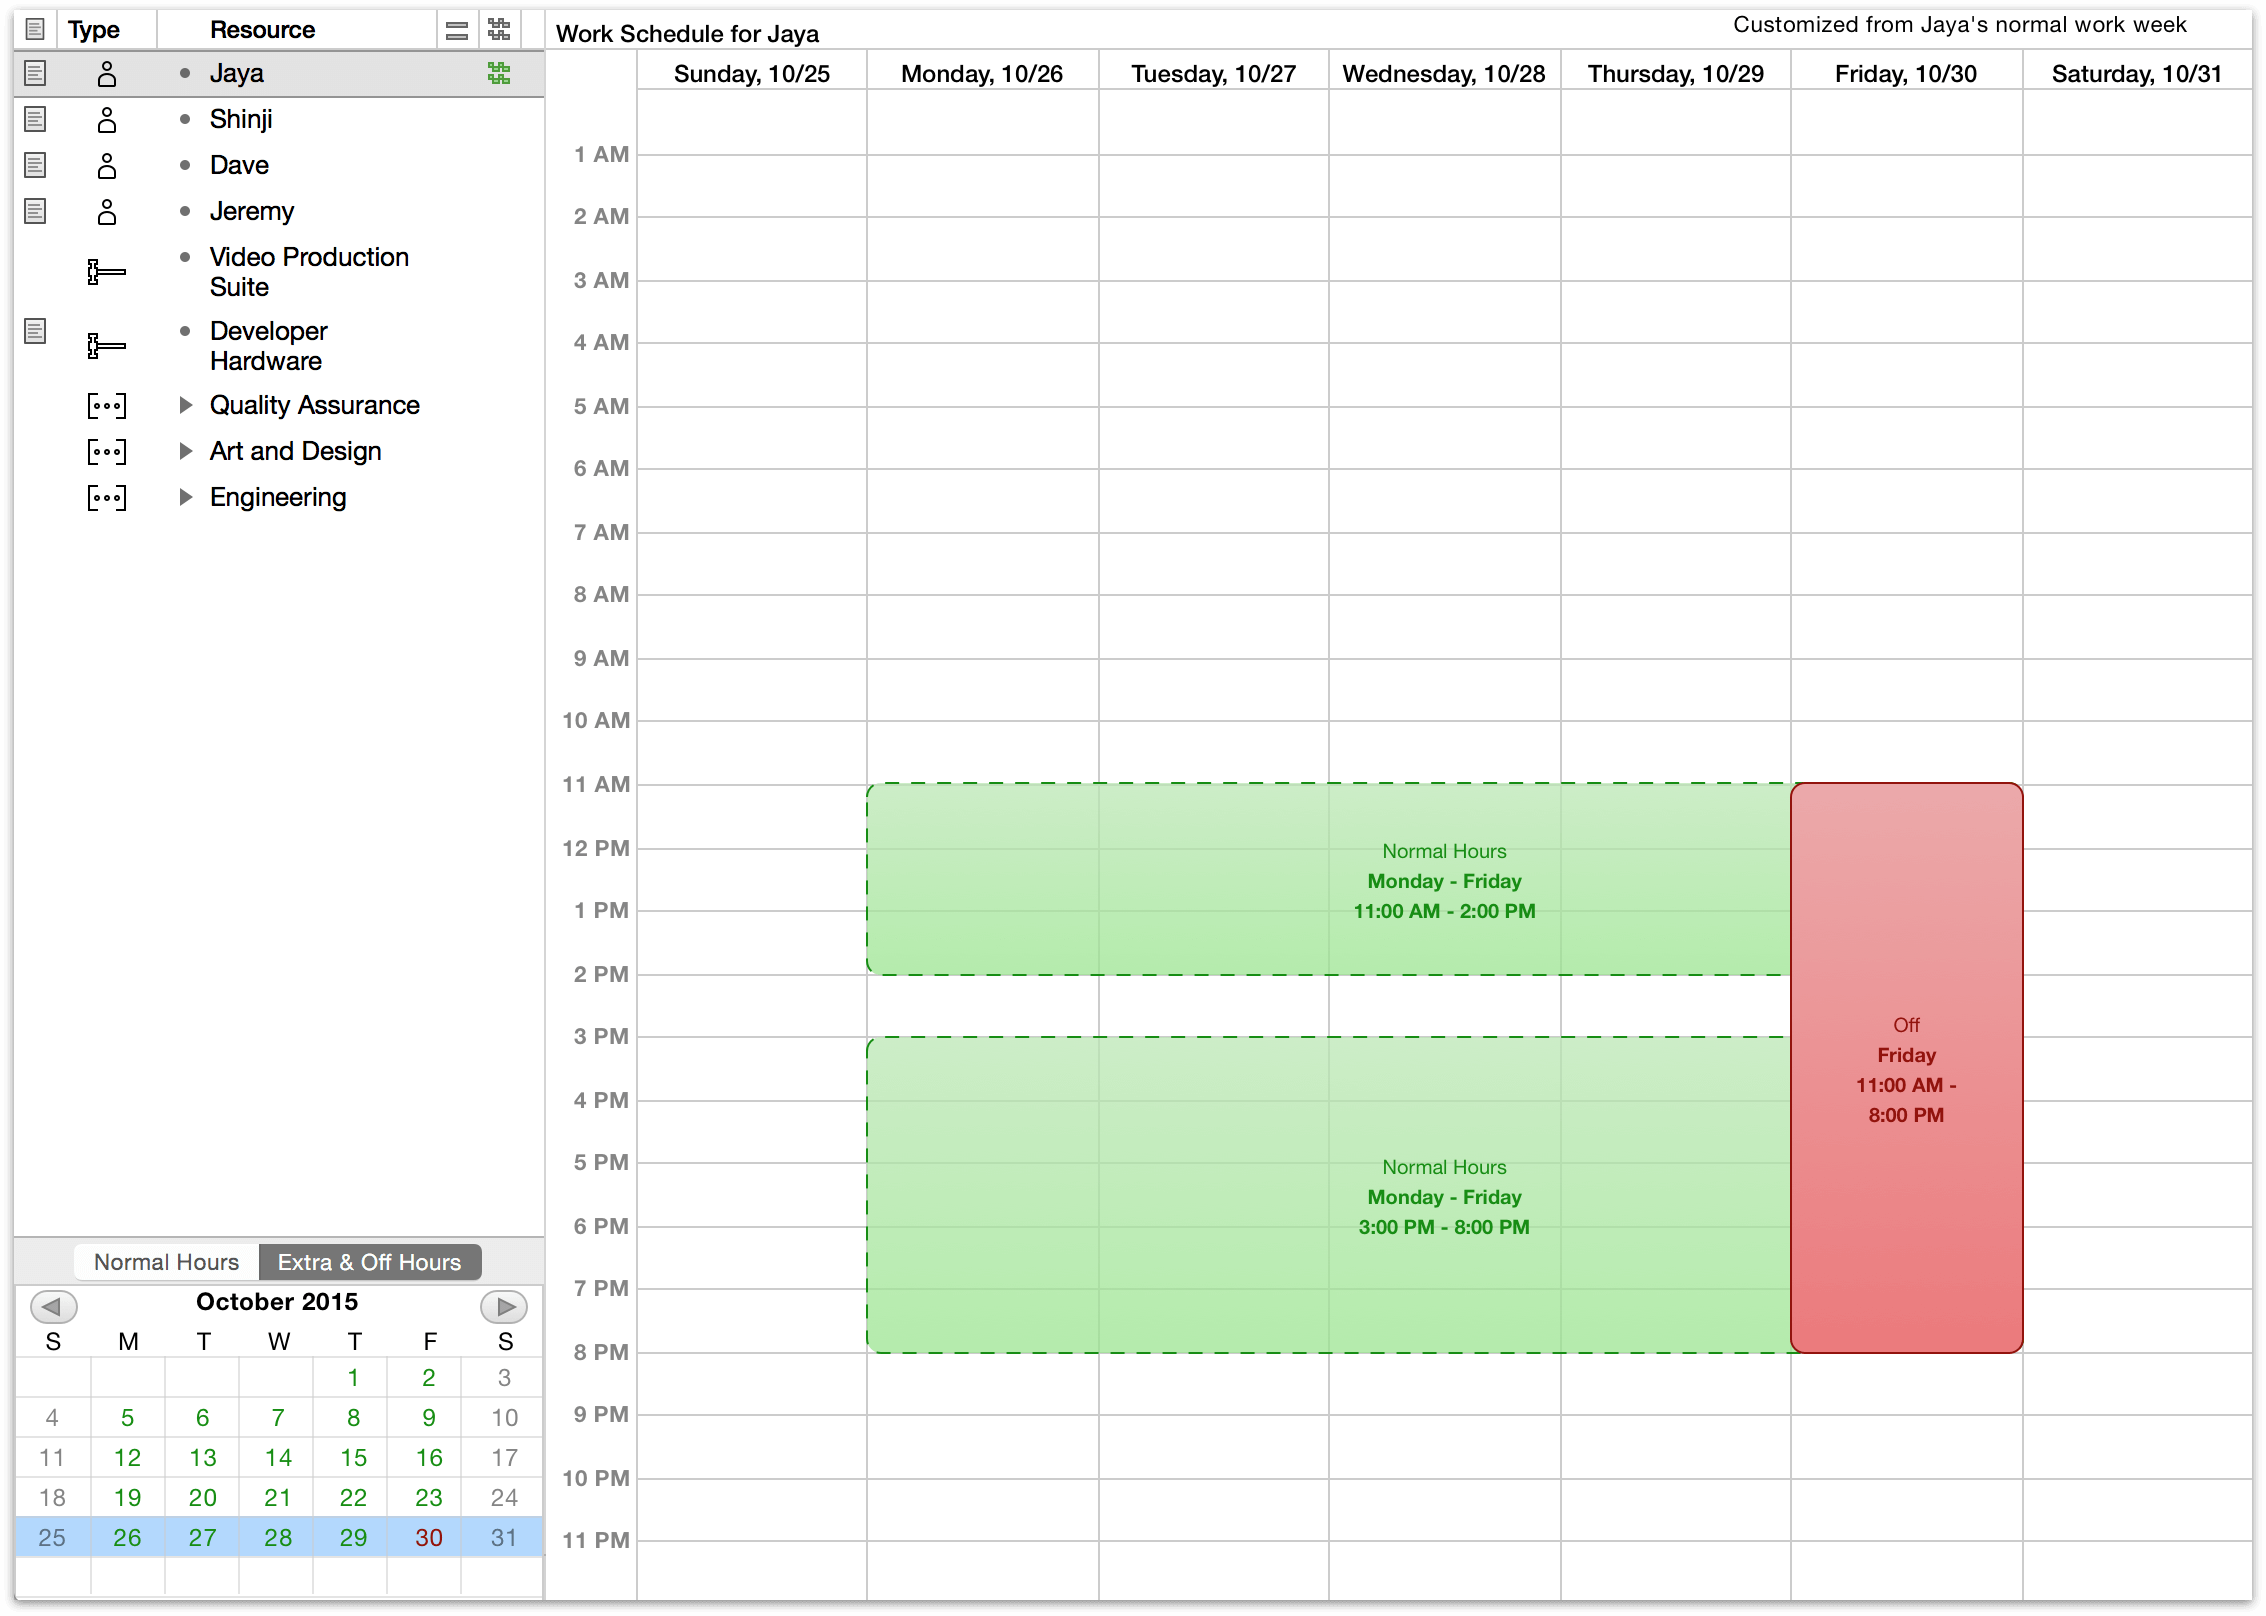
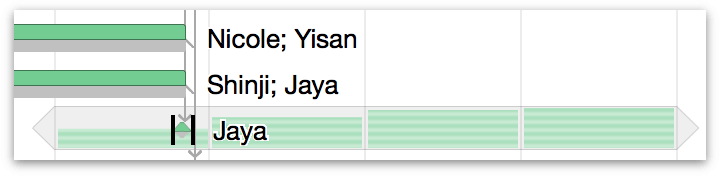
Here we’ve edited Jaya the Project Manager’s off hours to give her a free day to celebrate her anniversary.
Step 13: Leveling Resources
Once we have a calendar of working hours, a set of established tasks and milestones, and a team of people with the tools they need to complete them, OmniPlan can optimize the efficiency of work that’s happening through a process called leveling.
Resource leveling analyzes your project and figures out the most efficient way to arrange it, taking into account things like dependencies and the amount of resources available.
If you make some manual changes to the schedule, like rescheduling incomplete tasks, setting up dependencies, or changing resource assignments, you should then level the project again to make sure your resource usage is balanced out.
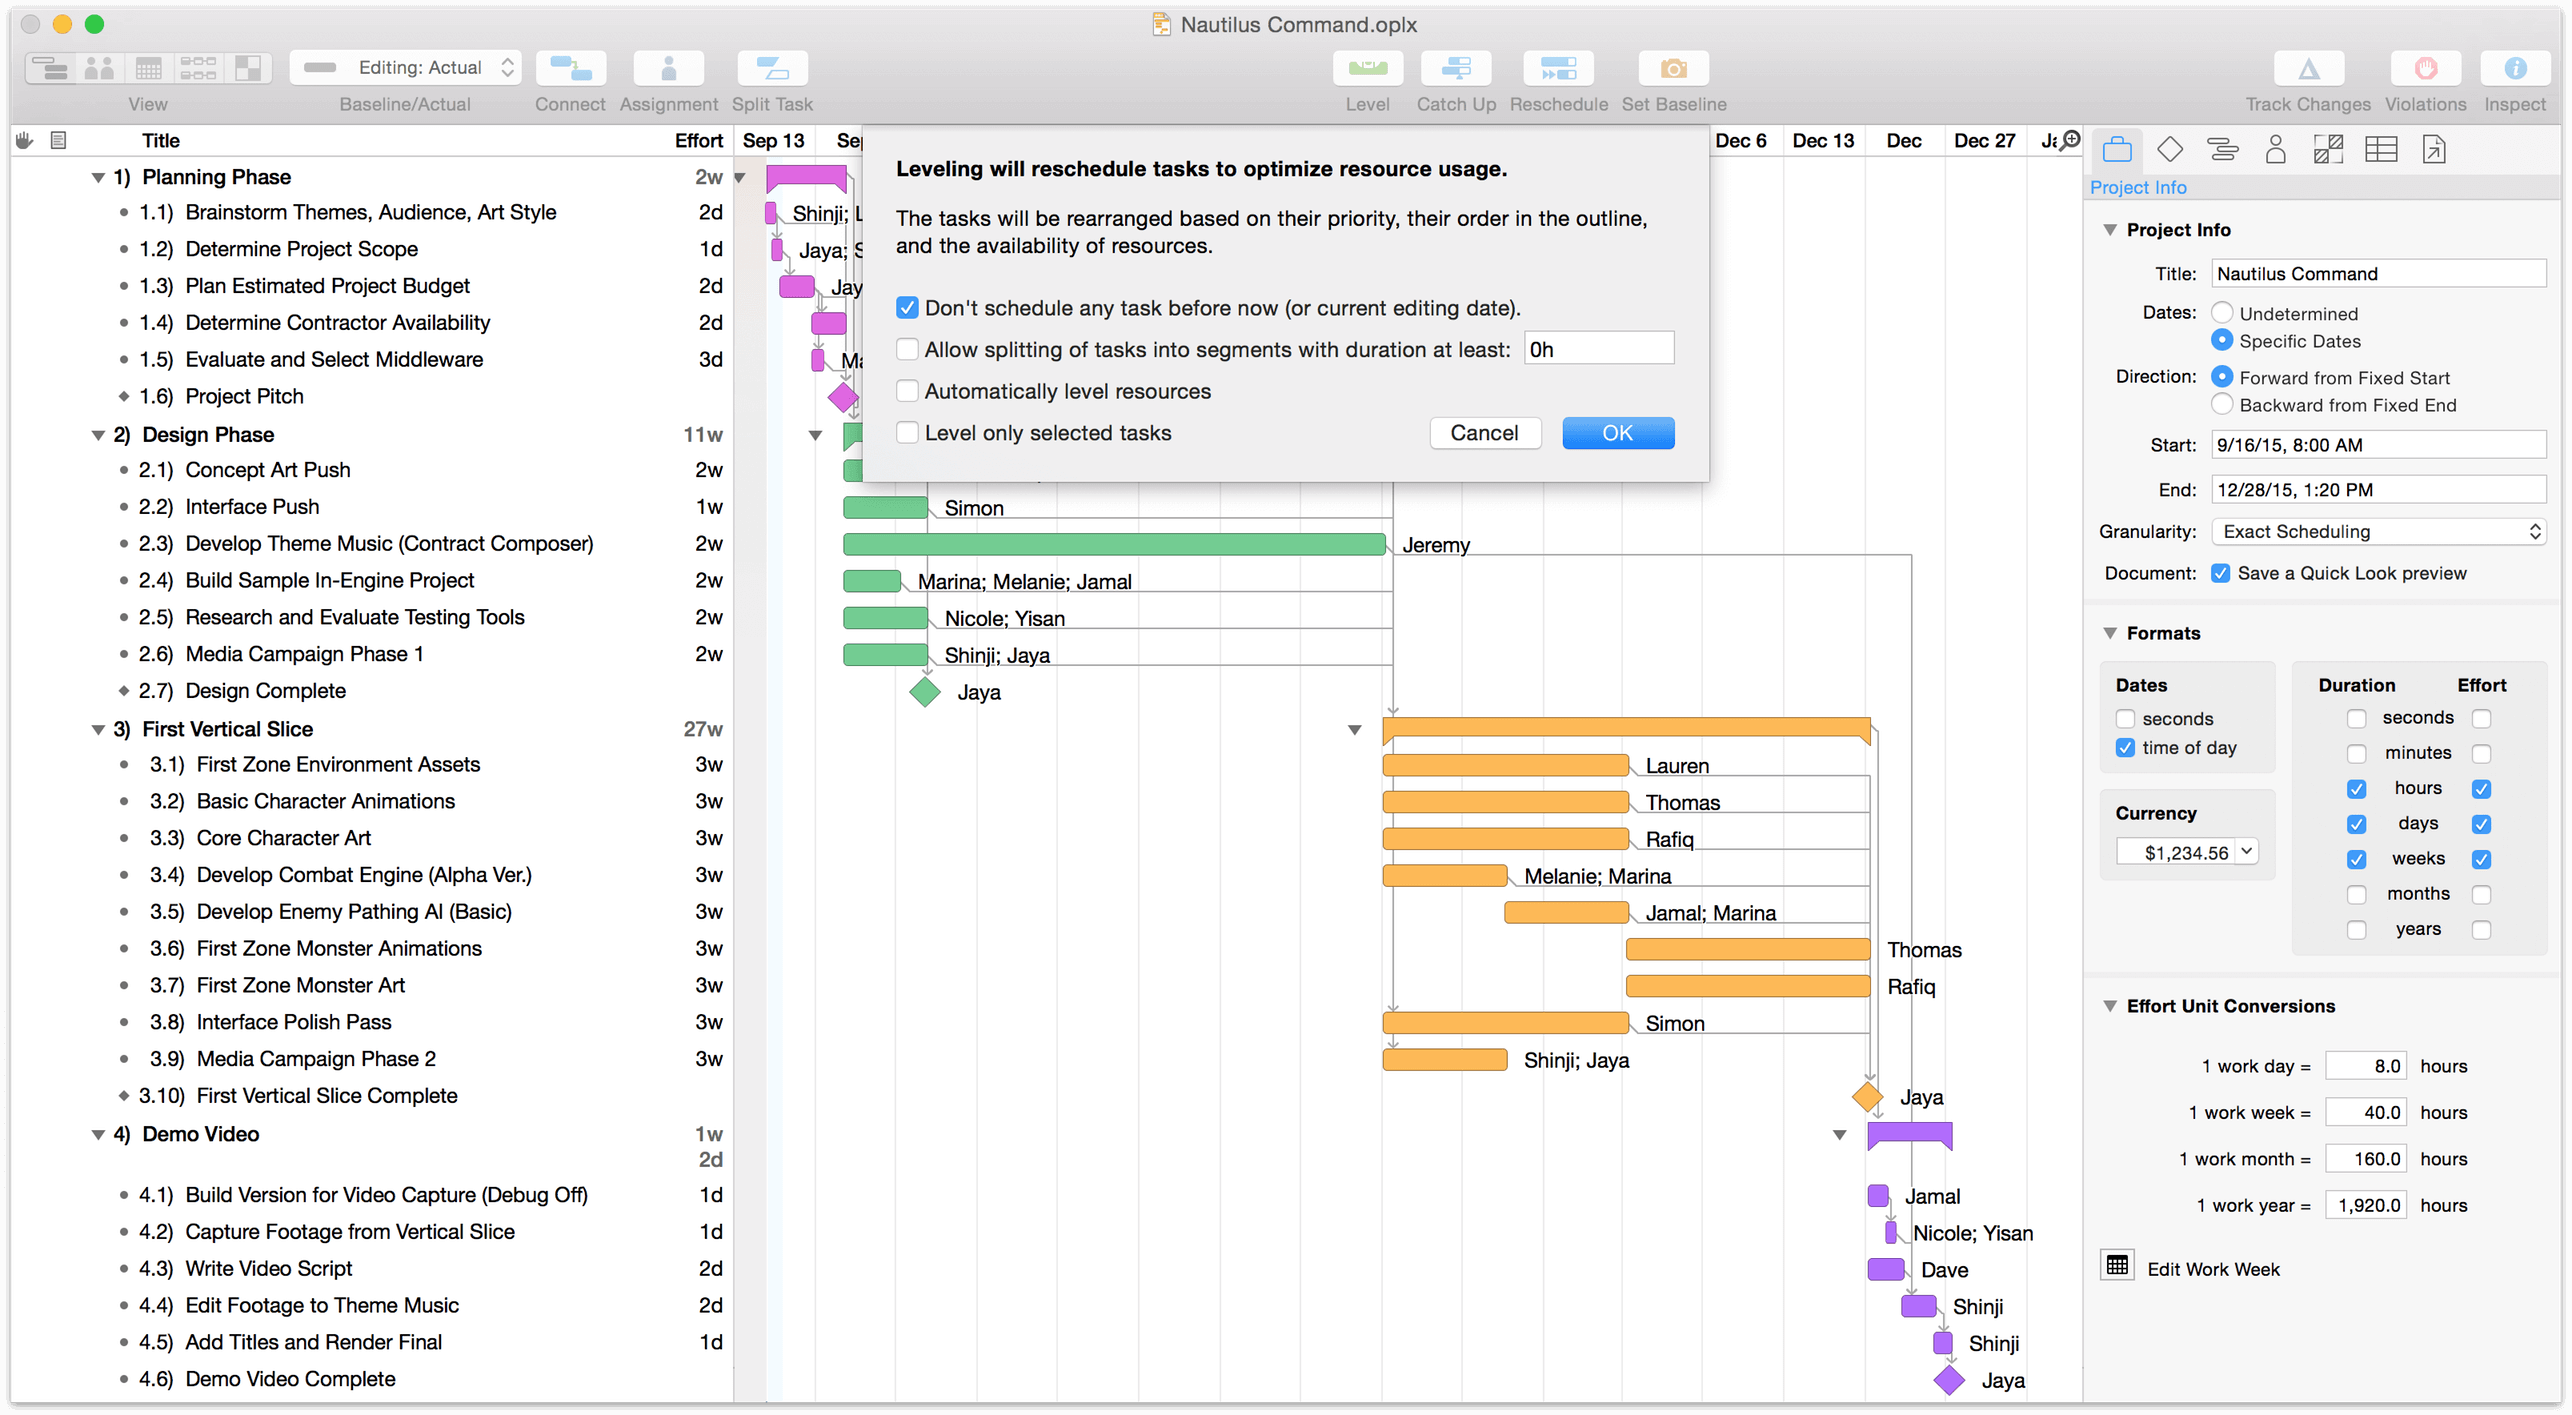
To level the resource workload for your project, choose Level in the toolbar or choose Project ▸ Level Resources (Shift-Command-L). The leveling dialog appears, with options to customize the leveling process; for now, leave these in the default configuration and click OK.
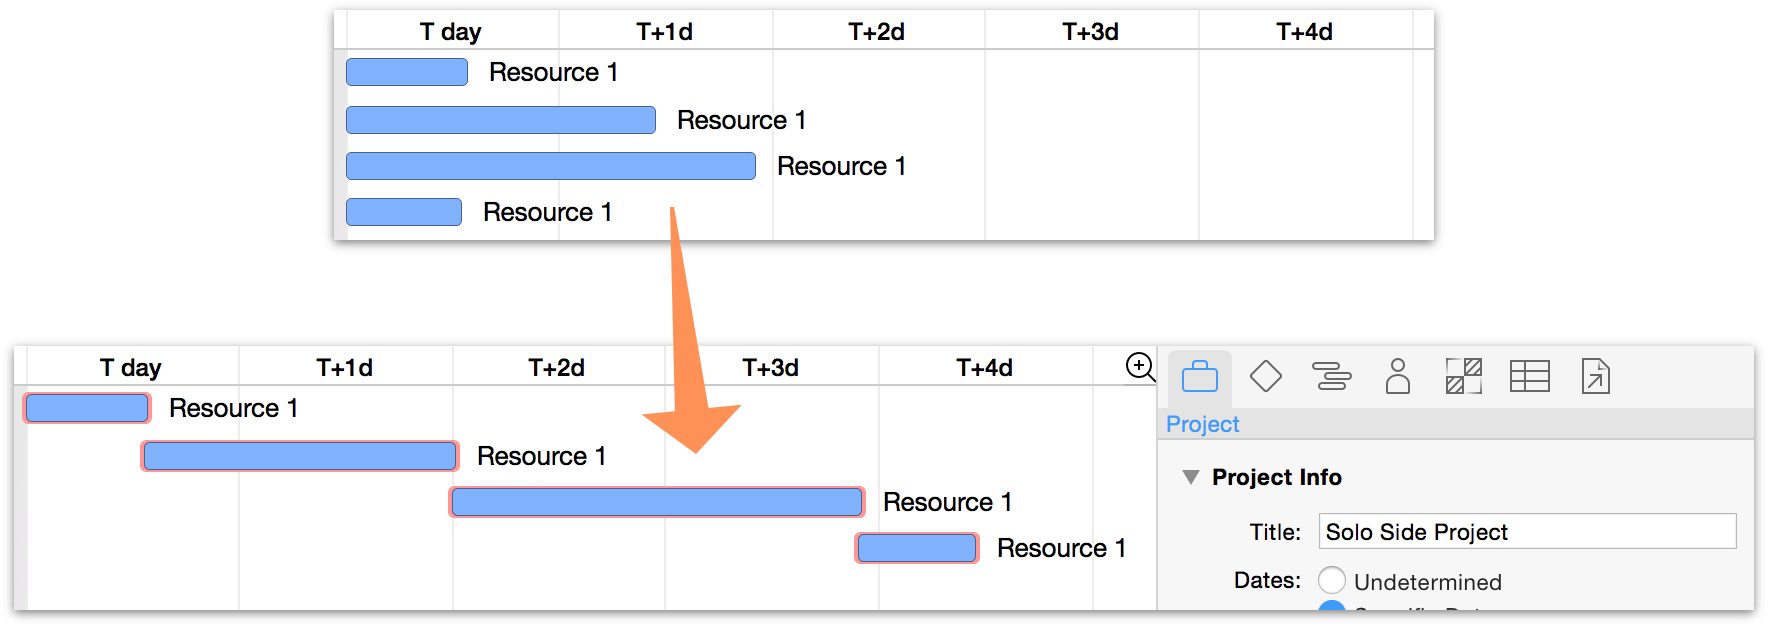
Unless your staff is already in the optimal configuration you’ll see the tasks in the Gantt view shift to accommodate the most efficient use of your resources’ time.
You can set OmniPlan to dynamically respond to updates in your project by automatically leveling resources every time you make a change. If you would prefer this, you can enable automatic leveling in the Project menu.
Step 14: Setting the Baseline
With tasks set and resources assigned and leveled, the state the project is in now may be a glimpse at its fate in the best of all possible worlds — one where unforeseen hindrances don’t bog down progress, and where optimistic estimations rule the day.
This is the world that is captured when we set a baseline for progress, a feature used to compare how the project is actually doing against initial expectations, so milestones and resource allocation can be adjusted accordingly.
When you have a schedule set up and leveled properly, and the project is ready to begin, choose Project ▸ Set Baseline. This copies the schedule you created into a baseline schedule. The baseline schedules remain unchanged as you update the actual schedule; as the project goes on you can keep track of how closely it is following the original plans.
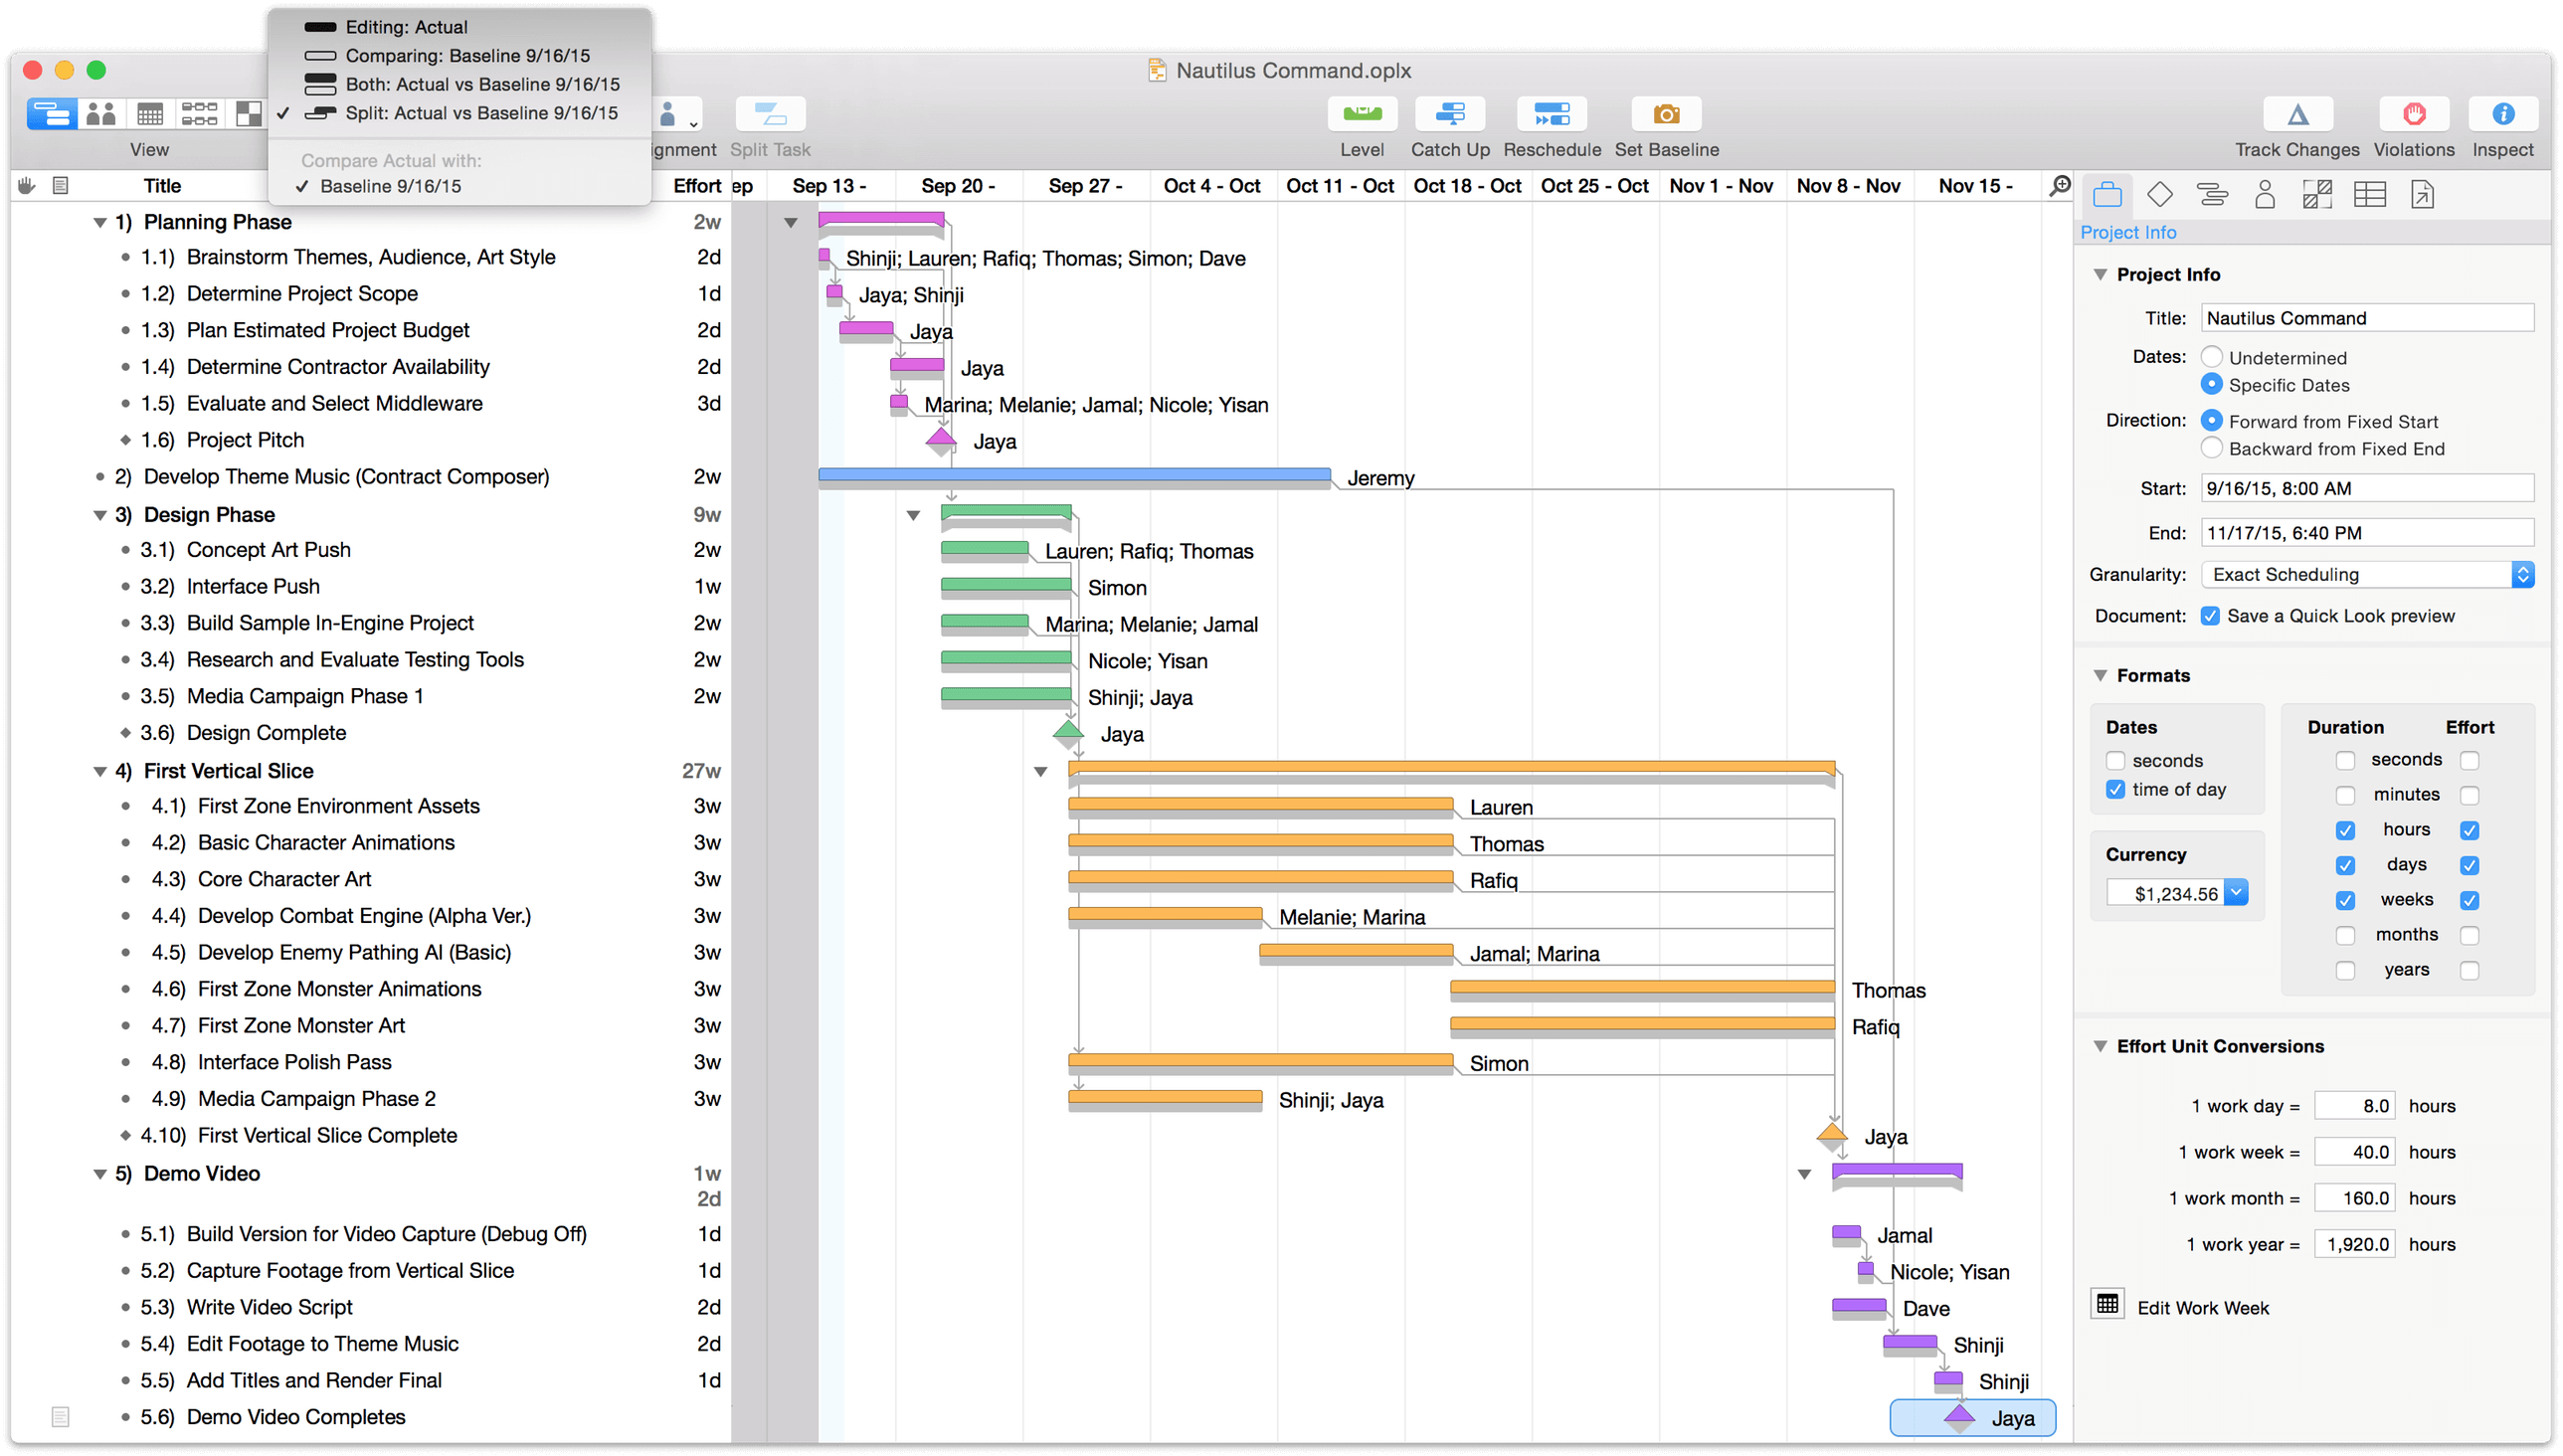
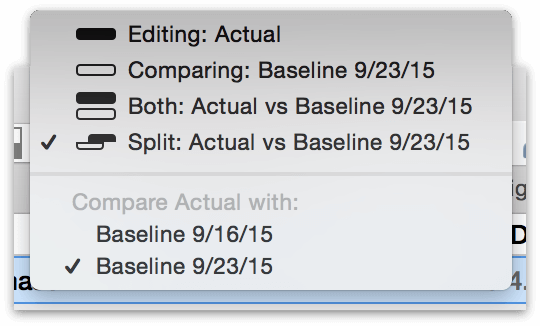
You can choose Split or Both from the Baseline/Actual menu on the toolbar to compare the baseline schedule to the actual schedule.
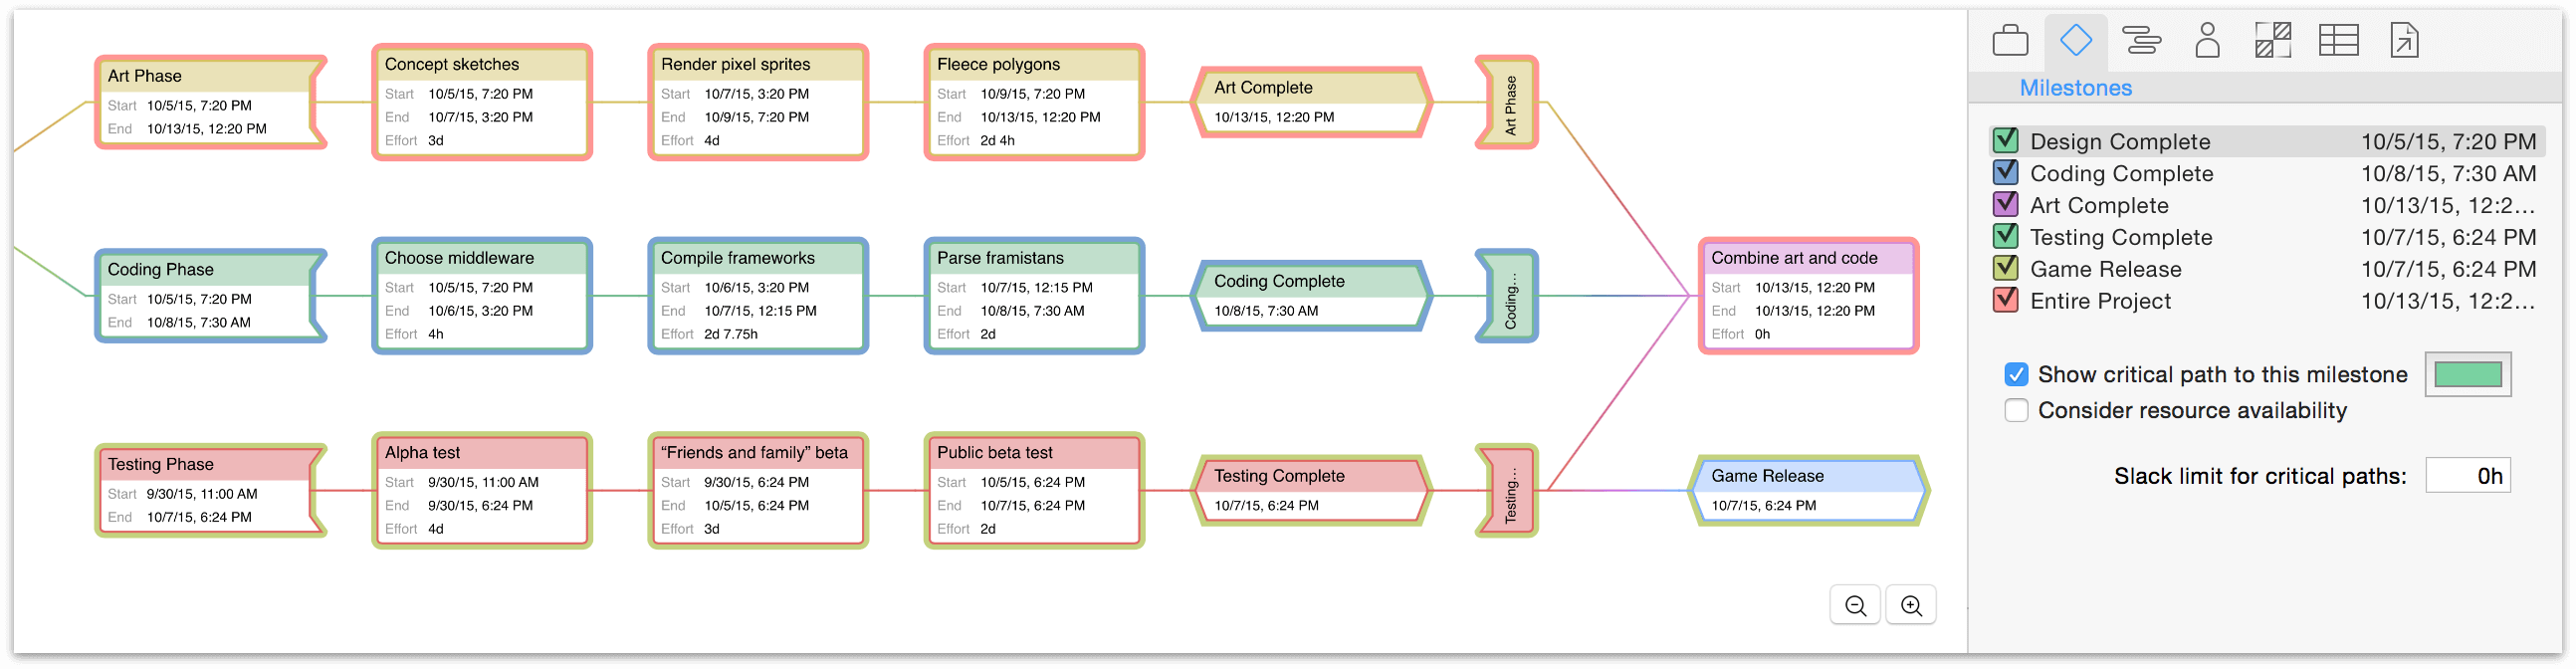
Step 15: Checking the Critical Path
Choose View ▸ Customize Toolbar to add the Critical Path button to your toolbar display.
The Critical Path button in the toolbar highlights the series of tasks and dependencies which determine the project’s duration (critical paths can also be charted to specific milestones rather than the project as a whole). If any of the tasks on a critical path ends up taking more or less time than planned, then the duration of the project as a whole will change as well. Usually, these are the tasks you most need to make sure are on track.
Most of the tasks in a simple linear project will be on the critical path, because they are almost all in one continuous chain. On the other hand, projects with multiple resources working in parallel (such as our example project here) often have some tasks that can suffer a delay without affecting the deadline.
Step 16: Updating Task Completion
As progress on the project continues, inevitably some tasks will be completed outside the timeframe initially projected. It’s a good idea to review the project in OmniPlan periodically and update it to reflect the new situation.
You can update progress of individual tasks by editing the percentages in the Completed column or the Task Info section of the Task inspector. Or, just drag the completion handle on a bar in the Gantt chart.
If everything is going as planned, you can click the Catch Up toolbar button to bring the completion percentage of every task (or just the selected tasks) to a selected date.
If you have tasks which were planned to be complete by now, but aren’t, you can click the Reschedule toolbar button to move them forward. Afterward, remember to level the project.
Step 17: Moving Forward
In a perfect world, progress through a project would involve nothing more than tracking task completion until the final milestone is reached. Reality seldom cooperates so neatly; thankfully, OmniPlan has tools to help adjust to anything fate has in store.
As you begin to adapt your new project to the realities of your work environment, several paths lie ahead to assist in making sure you reach that final milestone unscathed:
- Maintaining Your Project is a great next step, packed with tools for addressing common scenarios you’ll encounter.
- Reporting and Printing is another useful stop for when you’re accountable for presenting your project and progress to others.
- If your project is one among many you have to track, or there are other stakeholders assigned to update it, OmniPlan Pro’s Collaboration and Multi-Project Review are here to help.
When you have the time, continuing to develop your first project as you explore the rest of the manual is a great way to discover all of OmniPlan’s bits and pieces. And of course, we’re always here to help.
Chapter 103
Maintaining Your Project
The moment you’re ready to begin your project in earnest is the moment the real world starts to intrude on the ideal version of your plan. When variables begin to shift, adjusting aspects of the project to suit new circumstances is key to keeping things on track.
Resolving Violations
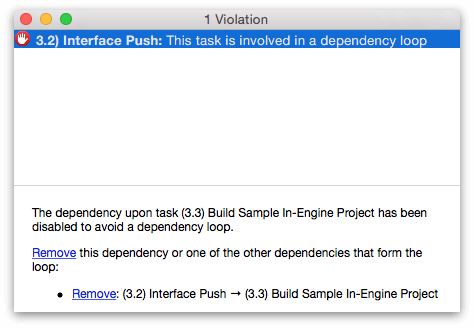
Occasionally situations will emerge that break the rules of logic you’ve set up for your project. When one of these occurs, OmniPlan will let you know by indicating a violation related to the adjacent task. A red icon appears in the Violations column of your task outline, and the Violations Window appears.
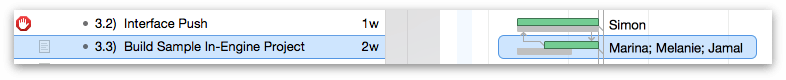
To see this in action, try creating a circular dependency in which two tasks both depend on each other. Because this is logically impossible, a violation will occur.
The Violations Window
If a violation has appeared in your project, the Violations Window will appear to let you know what’s wrong. You can also access it by clicking on the icon in the Violations column of Task View, the Violations button in the toolbar, or with the keyboard shortcut Shift-Command-V.
This window lists all of the violations in the project, along with explanations of why they have occurred. Most violation explanations include links you can click to immediately resolve the problem.
If the automated resolution provided by the Violations Window isn’t what you want, tips at the bottom of the window will help determine the source of the problem so you can fix it based on your scheduling needs.
Scheduling and Leveling
The Task inspector’s Scheduling method indicates how OmniPlan should determine when a task is to occur in the project.
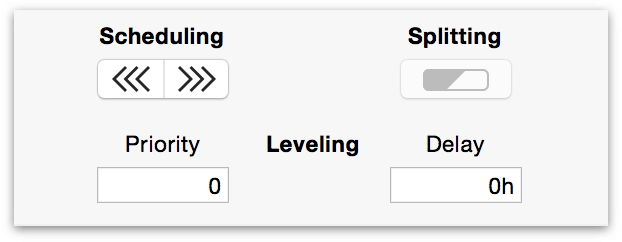
By default and prior to leveling, new tasks are scheduled as early as constraints allow (“As Soon As Possible”, or ASAP). This means the task is placed at the very earliest time possible, taking into consideration start and end constraints, and dependencies on other tasks. Resource availability is not taken into consideration, so resources may end up overutilized (this is why leveling is an important additional step).
A task can also be scheduled As Late As Possible (ALAP), which defers it until the latest possible time based on other constraints.
A task’s Start and End dates can be defined as temporally immovable by locking them (with the lock icons above the Start and End date fields in the Schedule section of the Task inspector, or by holding Command and clicking either end of the task’s bar in the Gantt chart). A locked date (Start, End, or both) will not be affected by leveling.
To schedule a task that has (or should have) already happened, choose Project ▸ Set Current Editing Date and enter the date when work on the task began. This changes the contextual “insertion point” for the project to that date—newly created tasks originate there by default. When finished adding tasks relative to that date, set the editing date back to the present.
When you level the project (or whenever a change is made, if Project ▸ Automatically Level Resources is selected), OmniPlan rearranges tasks which have resources assigned to make sure no resource is being used at more than 100% of its availability. Tasks moved back by resource leveling are scheduled by resource availability.
During leveling, OmniPlan has to make an educated decision about which task should get access to a resource first, and which tasks should be pushed back by a resource dependency. In judging which task to put first, the following criteria matter, in this order:
- Requirements to end by a certain time, such as locked end dates, constraints, or being a prerequisite to a task with such a requirement.
- Task Priority, as set in the Priority column of the task outline.
- Position in the task outline; tasks that are higher in the outline are scheduled earlier.
Duration and Effort
Duration and effort are two key concepts intimately involved with the process of scheduling tasks and leveling your project for optimal efficiency.
Duration is how long a task takes in actual working hours in the schedule. If the task begins at 8:00 and ends at 12:00, that’s a duration of 4 hours. Note that non-working times don’t count; if a task starts one afternoon and doesn’t complete until the next morning, or spans a lunch break, only the working hours are counted. Also note that the resources assigned to a task may have different working hours than the project as a whole, and thus the displayed duration of a task may not match up exactly with the amount of effort it takes.
Effort is the total amount of working time put into a task by all assigned resources. A task with a duration of 4 hours, with 2 resources assigned at 100%, has an effort value of 8 hours. Note that Material resources don’t contribute to effort, only Staff and Equipment resources do.
The duration and the effort of a task can change depending on the resources you assign.
Each task has a setting in the Resource Allocation section of the Task inspector which controls whether to keep the duration fixed, the effort fixed, or both.
When you assign or unassign staff and equipment resources, the value that isn’t fixed re-calculates its value; the other field stays the same. Regardless of which value is calculated, you can always edit either value manually.
If both values are fixed, then assigning resources changes the assigned percentage.
What Makes Duration and Effort Change
Multiple factors influence both duration and effort. The most common variables are described below; adjusting them can help bring a project in line with the desired timeline for completion.
- Number of Assigned Resources
- Assigning more resources to a task generally causes the task to take less time, because the required effort gets completed sooner.
- Efficiency of Assigned Resources
- Assigning less-efficient resources to a task causes the duration to be longer than the effort, because the resource takes more time to achieve the same amount of effort.
- Assigned Amount and Available Units
- Assigning fewer units of a resource to a task causes the duration to be longer than the effort, because less of the resource’s time and energy is being spent on that task. This situation is common when a resource is split between multiple tasks at one time. The amount of a resource you can assign to tasks depends on the resource’s available Units (set in the Resource Info section of the Resource inspector or the Units column of the Resource outline). Assigning more of a resource than is available causes a violation and shows up as overutilization in the Resource timeline.
Using Critical Paths
Looking at a project or milestone’s Critical Path in the Gantt chart or Network View is a great way to get a feel for the tasks involved that are most important to on-time completion of the goal. Identifying tasks that are part of the critical path (and vice versa) helps prioritize work to ensure that deadlines are met.
By default, OmniPlan determines the critical path by taking into account the dependency relationships between tasks, and the amount of free (slack) time there is between them.
-
On the dependency side, an unbroken chain of tasks with Finish ▸ Start dependencies represents a simple critical path to project completion. Tasks that are independent won’t be on the path at all, since they can occur at any time during the project.
-
On the slack side, hammock tasks or tasks with a set start date before which other work has been completed can lead to periods in the project where nothing is happening. The length of these periods that determine whether the critical path is affected is set in the Milestones inspector.
One other potential factor affecting critical paths is resource availability. You can choose whether or not to consider it in the display of your critical paths using the Milestones Inspector; that section also contains information on the impact of resource availablility on your critical paths, as does the Scheduling and Leveling section, earlier in this guide.
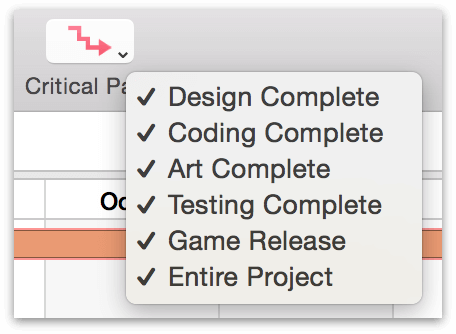
OmniPlan can display critical paths both for the entire project, and for individual milestones. To turn on critical paths, click the Critical Path button in the toolbar; to choose which critical paths to display, click the arrow in the corner of the button and choose the milestones you want, or choose them in Milestones Inspector.
Updating Task Completion
If everything is going according to plan, just click the Catch Up button in the toolbar.
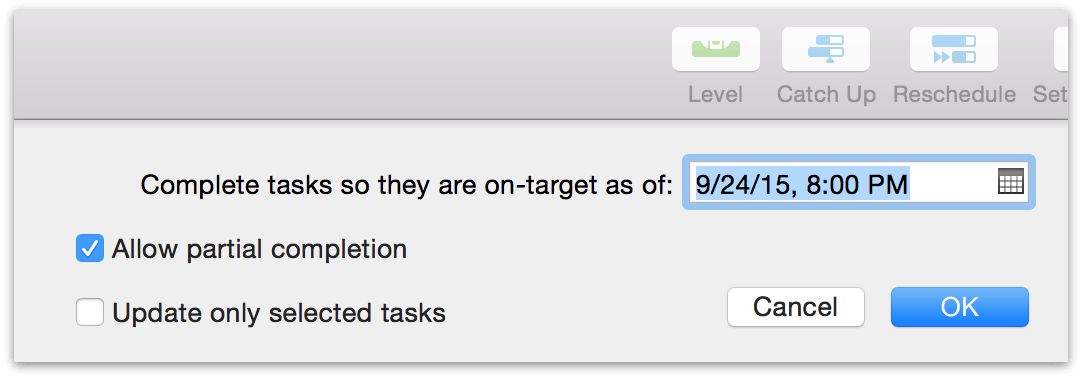
Choose a date and time (today by default), whether to allow tasks to be marked partially complete, and whether to update all tasks or just the selected ones.
When you click OK, the tasks’ completion percentages are updated to the specified date and time.
To mark a task 100% complete, you can use Shift-Option-=. Conversely, Shift-Option-– can be used to mark a task as 0% complete.
Rescheduling Incomplete Tasks
When a task isn’t as complete as it was scheduled to be, you can use the Reschedule toolbar button to quickly determine the best place for it in the current situation.
Clicking the Reschedule button brings up the following dialog.
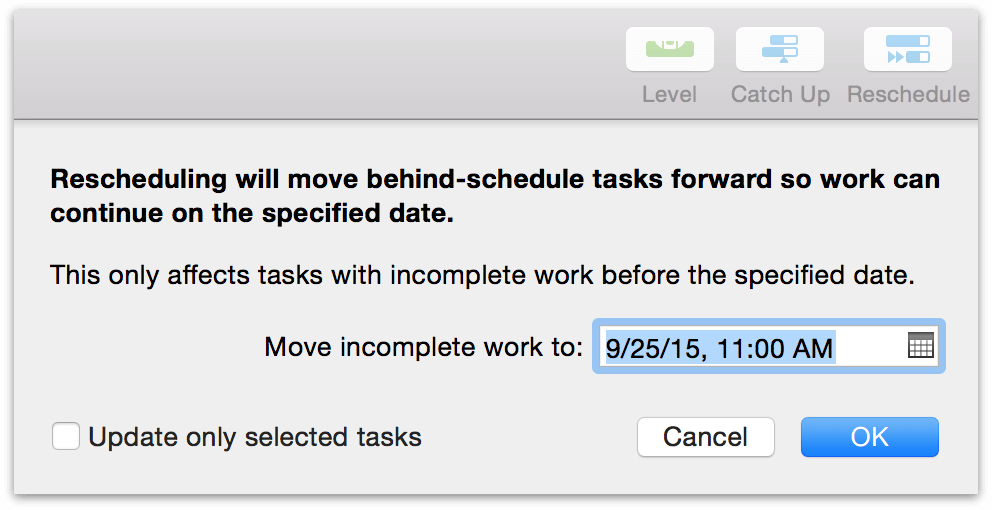
Choose a date and time to reschedule the incomplete tasks, and whether to update all tasks or just the selected ones.
When you click OK the incomplete tasks move — and the whole schedule updates — so that work can continue from here.
Note that this only moves tasks with incomplete work that was scheduled for before the date you specify; tasks in the future aren’t affected.
Gauging Progress with Baselines
Once you have finished setting up a project and you’re ready to start implementing it, you can set a baseline schedule. The baseline represents the original intentions of the project, for comparison with the actual schedule. The actual schedule, by contrast, is the way a project turns out in real life. Before the baseline is set for a project, the baseline and actual schedules are the same. After the baseline is set, further changes affect the actual schedule only.
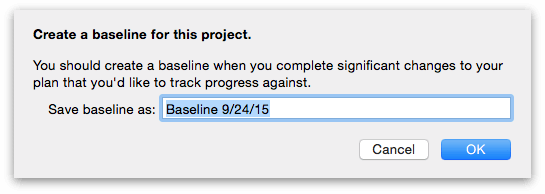
To set a baseline, click the Set Baseline button in the toolbar. You’ll be prompted with a field to name the baseline; the default name is today’s date.
When you click OK, the baseline schedule is set and any further changes are applied to the actual schedule instead.
Choose Split Schedule or Both Schedules to see the baseline and actual schedules together, so you can compare them.
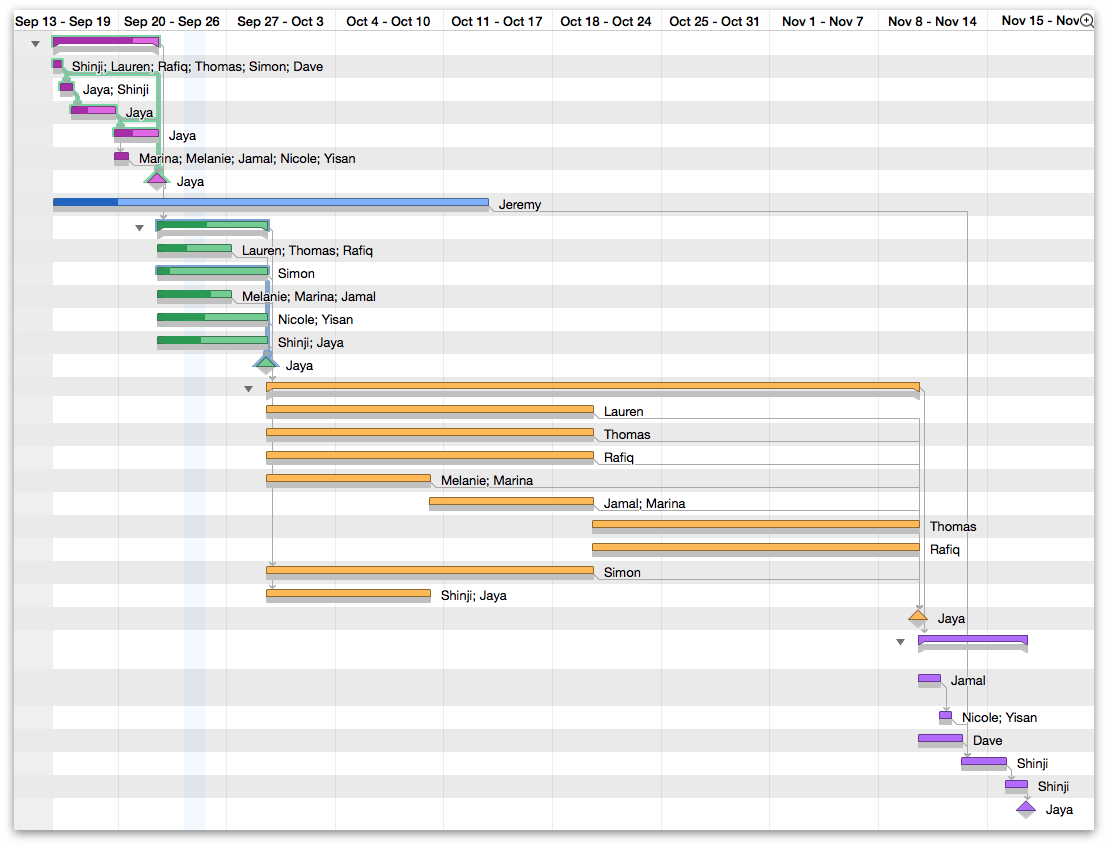
OmniPlan 3 supports not just a single baseline, but as many as you want — so at any given point in the project, you can take a snapshot that sets a new standard from which the actual project can proceed. You can compare a given baseline with the current actual schedule using the Baseline/Actual menu in the toolbar.
Using Simulations to Estimate Milestone Completion (PRO)
OmniPlan 3 Pro includes tools for calculating the degree of certainty that a milestone will be complete by a given deadline, using Monte Carlo simulations based on estimations of the effort required to reach the goal. The results of these simulations can help identify where things might fall behind (or even be ahead of schedule).
To run a simulation, switch to Task View and choose the Simulations button in the toolbar. The settings you choose here (and the simulation itself) will affect all tasks and milestones in the project.
The level of certainty the simulation provides is determined by the amount of effort estimated as required for completion of the tasks within each milestone. If you haven’t manually set effort estimates for tasks, you’ll want to either do that, or use the handy Auto-Estimate Effort feature (also found in the Monte Carlo popup menu).
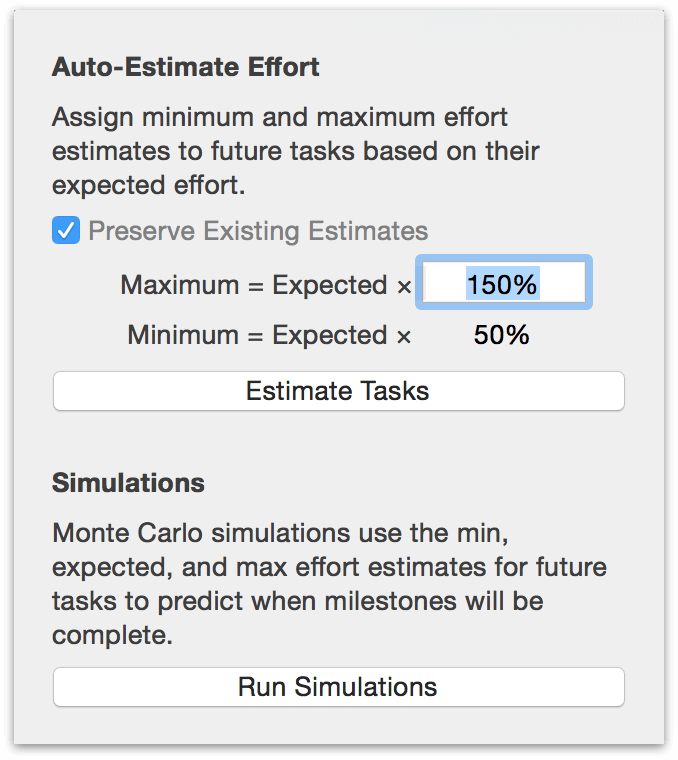
Running a simulation without setting minimum and maximum effort estimates (either manually or automatically) results in a prediction that your milestones will be completed exactly as they’re scheduled, 100% of the time. Not very useful, right? For best results, be sure to have a spread of possible efforts included (auto-estimating effort makes this easy).
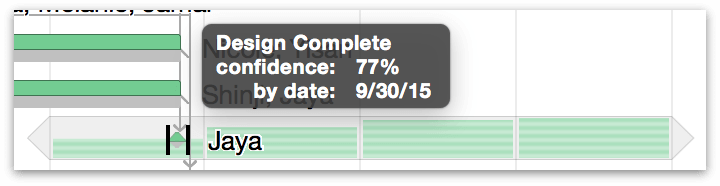
Once the simulation is complete, a set of horizontal bars appears on days surrounding each milestone (represented as a small diamond); one bar equals 20 percent confidence that the milestone will be complete on that day (5 bars on a day means that according to the simulation, a milestone is 100% likely to be completed on that day). Hover over the bars on each day for greater detail.
Using AppleScript (PRO)
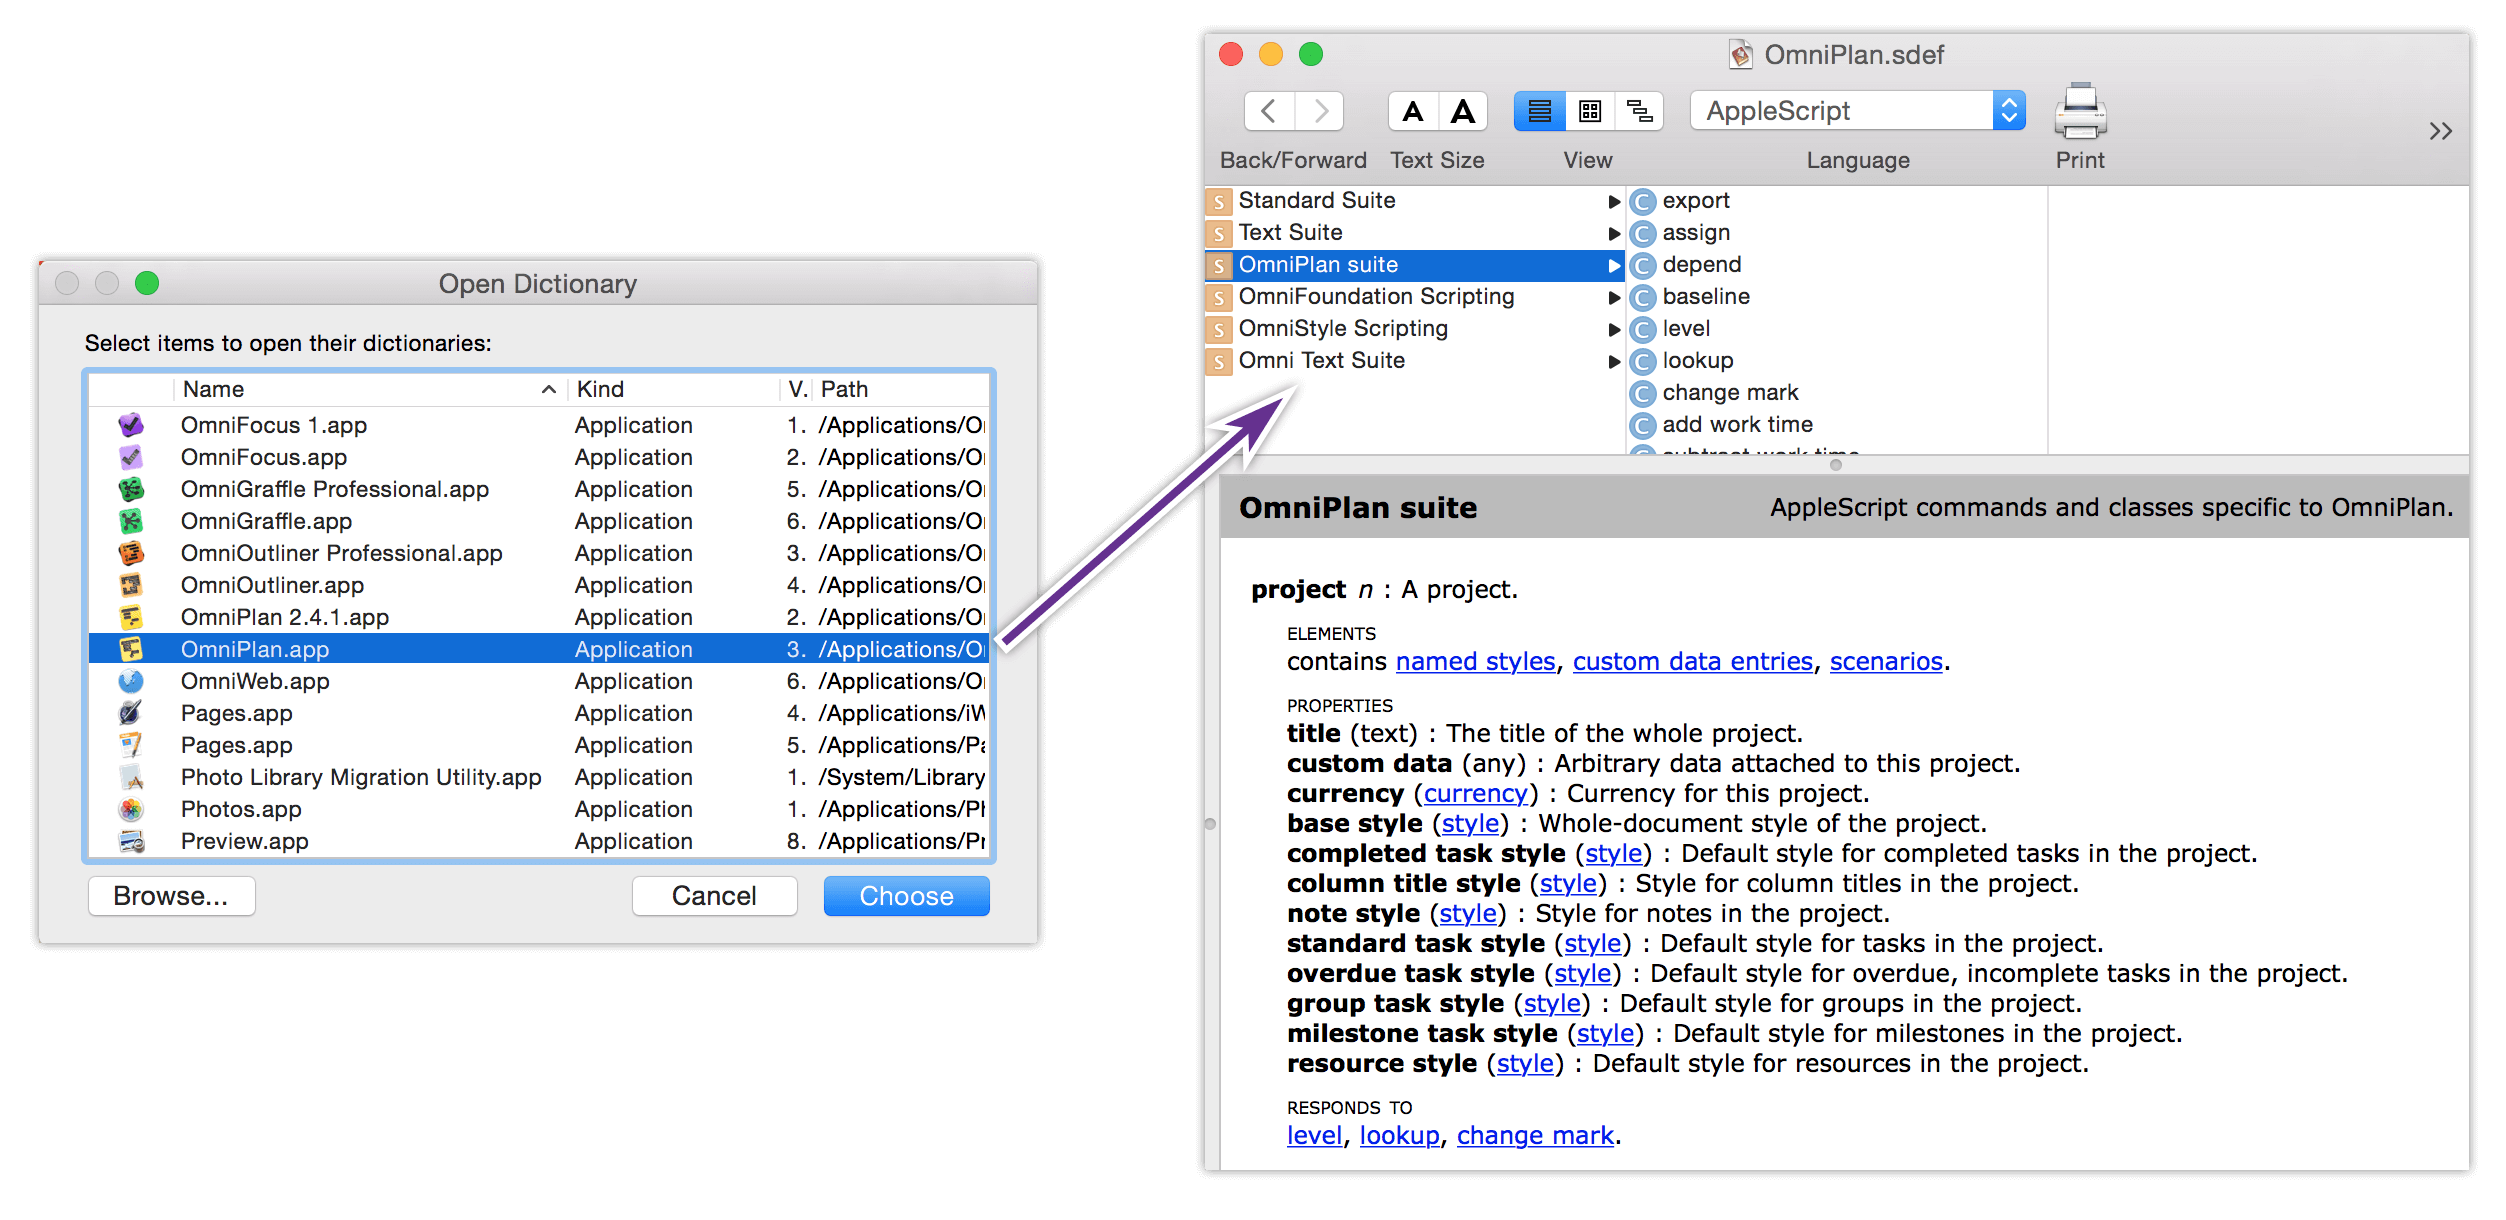
With OmniPlan Pro you have access to powerful scripting tools using the built-in AppleScript library. To access the dictionary of scripting commands specific to OmniPlan, open AppleScript Editor and choose File ▸ Open Dictionary (Shift-Command-O), then choose OmniPlan.app from the list that appears.
Single-User File Sync with OmniPresence
If you’re solely responsible for managing projects that you would like to keep up-to-date between multiple devices, you can take advantage of cloud-based storage services to keep your OmniPlan files in sync across both Mac and iOS.
While there are many such services available, Omni offers a fully supported solution that is designed to meet the needs of most users: OmniPresence paired with Omni Sync Server.
-
OmniPresence is a free utility that you install on your Mac for synchronizing files. OmniPresence runs in the background, watching a “connected folder.” It makes sure the files inside are in sync with files in the cloud (a WebDAV server of your choice), and with your OmniPresence-enabled iOS apps.
On iOS, OmniPresence is built into all of our current document-based apps, including OmniPlan 2. You’ll access OmniPresence folders and files from within the app’s respective Resource Browsers. The result is that all of your OmniPresence-enabled devices detect changes wherever you make them, and constantly sync up to keep your files up to date.
To learn more about connecting with OmniPresence in OmniPlan for iOS, see the OmniPlan 2 for iOS User Manual.
To get started with OmniPresence for Mac, you’ll need to download OmniPresence for Mac from our website.
OmniPresence sync isn’t a replacement for the multi-user collaboration features of publication and subscription to a server repository in OmniPlan Pro. OmniPresence exists as a cloud storage space to keep files up-to-date between devices; it doesn’t track changes to those files, doesn’t support publishing actions, and is not intended for multiple users to access simultaneously.
If your project requires editing by multiple contributors, consider the collaborative features offered in the Pro upgrade.
-
Omni Sync Server is a set of cloud storage servers maintained by The Omni Group. It is essentially a custom WebDAV server that functions as a central hub for all your syncing needs; it’s what OmniPresence connects to when shuttling files between your Mac and iOS devices.
With Omni Sync Server, we never ever look at your data without your permission. For example, when our Support Humans are working with you to restore a corrupt file or isolate a particular issue you’re having with our server. Beyond that, you can rest assured that your data is safe and secure on Omni Sync Server.
To use Omni Sync Server, you’ll first need to sign up for a free account. If you don’t have an account already, head over to our website and sign up for an Omni Sync Server account.
How Synchronization Works
Before diving in to the nuts and bolts of getting everything set up on your Mac, it’s worth taking a moment to discuss how syncing with OmniPresence works.
With OmniPresence turned on, the WebDAV server you designate (either Omni Sync Server or your own or a third-party WebDAV server) manages synchronization so that your files are always up to date. With each subsequent sync, OmniPresence compares your local files and applies any differences to your files on the server. This ensures that your files are not just up to date, they’re available wherever—and whenever—you need them.
We’ve also built in an automatic sync mechanism. When you save an OmniPlan file to an OmniPresence-enabled folder (or when an Auto Save occurs), OmniPresence updates the file on the sync server. At a bare minimum, OmniPresence checks in with Omni Sync Server every hour and compares files in your sync folder. If nothing has changed, OmniPresence quietly goes back to watching over your files. This helps ensure that your OmniPlan files are always safe, secure, and most importantly—up to date.
Installing OmniPresence
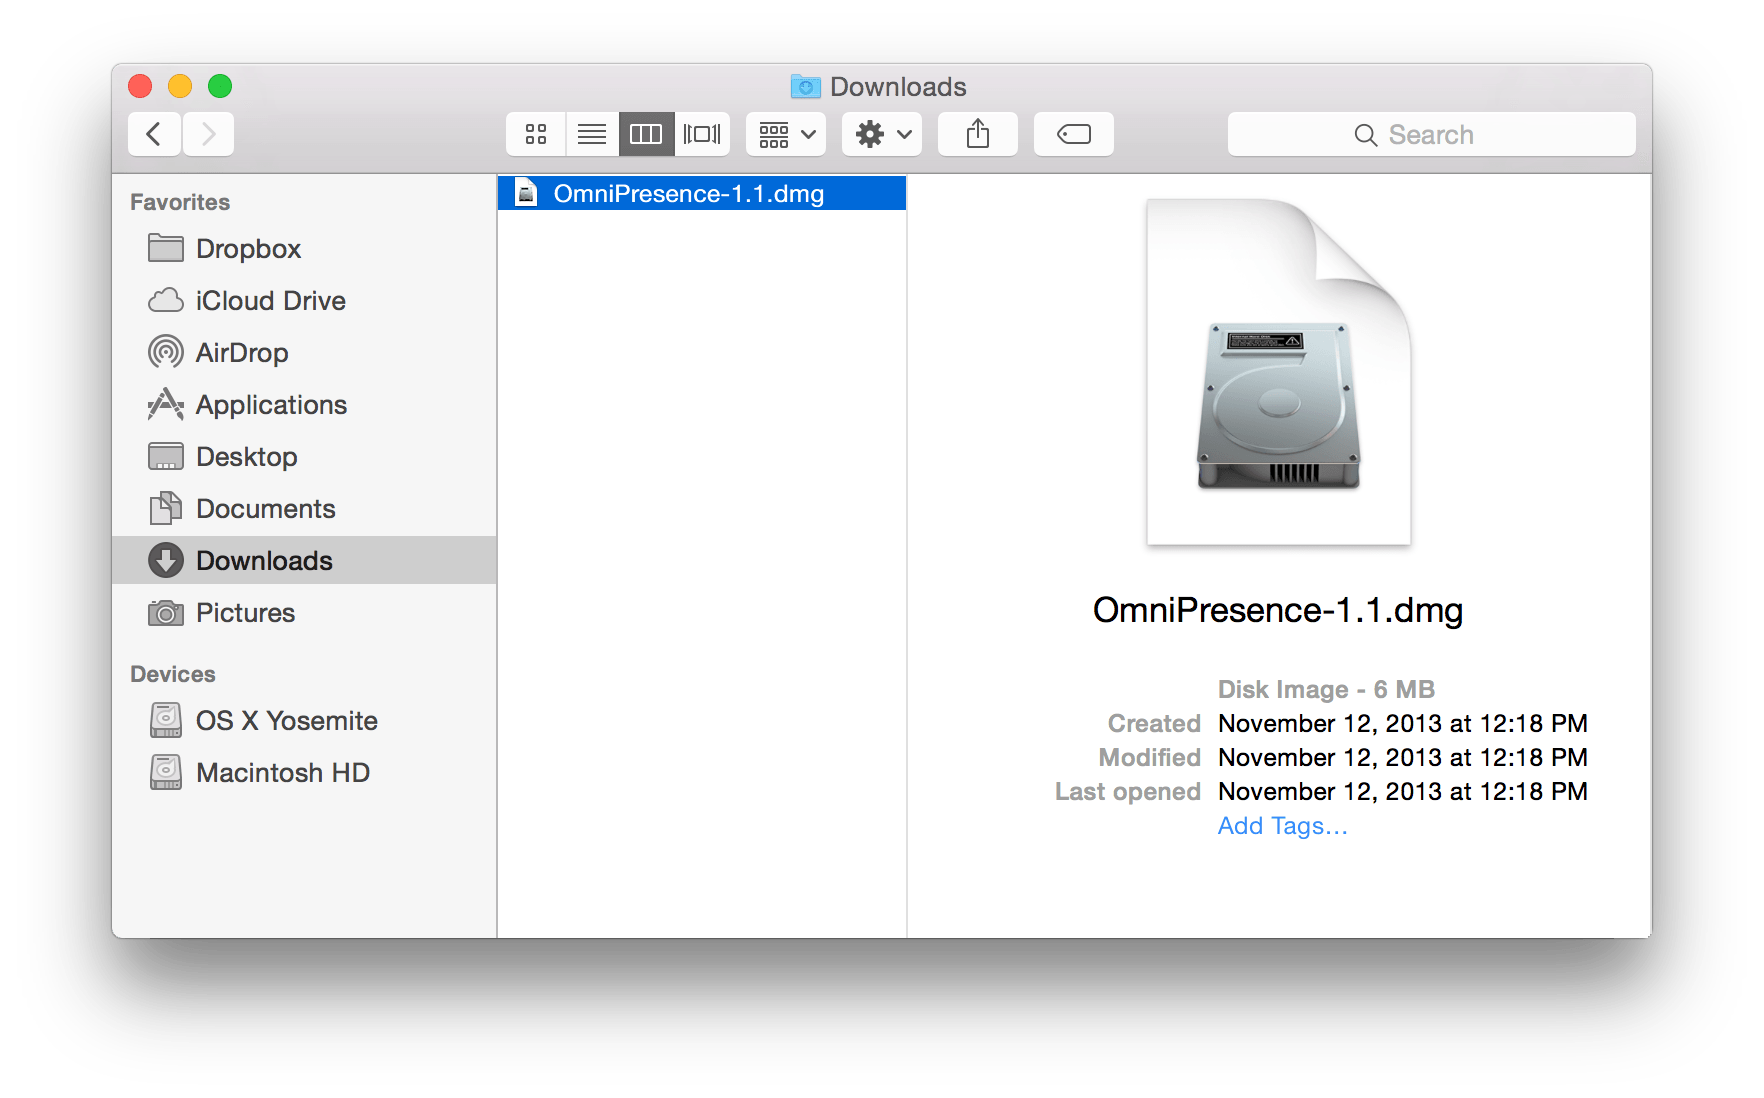
If you clicked the earlier link to download OmniPresence for Mac (or this one right here), you’ll find the installer package in the Downloads folder on your Mac.
To install OmniPresence, follow these steps:
- Open a Finder window and go to the Downloads folder on your Mac.
-
Locate and then double-click the file, OmniPresence-1.4.dmg.
The filename you see might be slightly different. As of this writing, OmniPresence for Mac is at version 1.4 (thus the filename, OmniPresence-1.4.dmg). If you see a different number in the filename, don’t be worried; just go ahead and double-click that one. It just means that our engineering team have been hard at work to improve OmniPresence for Mac.
-
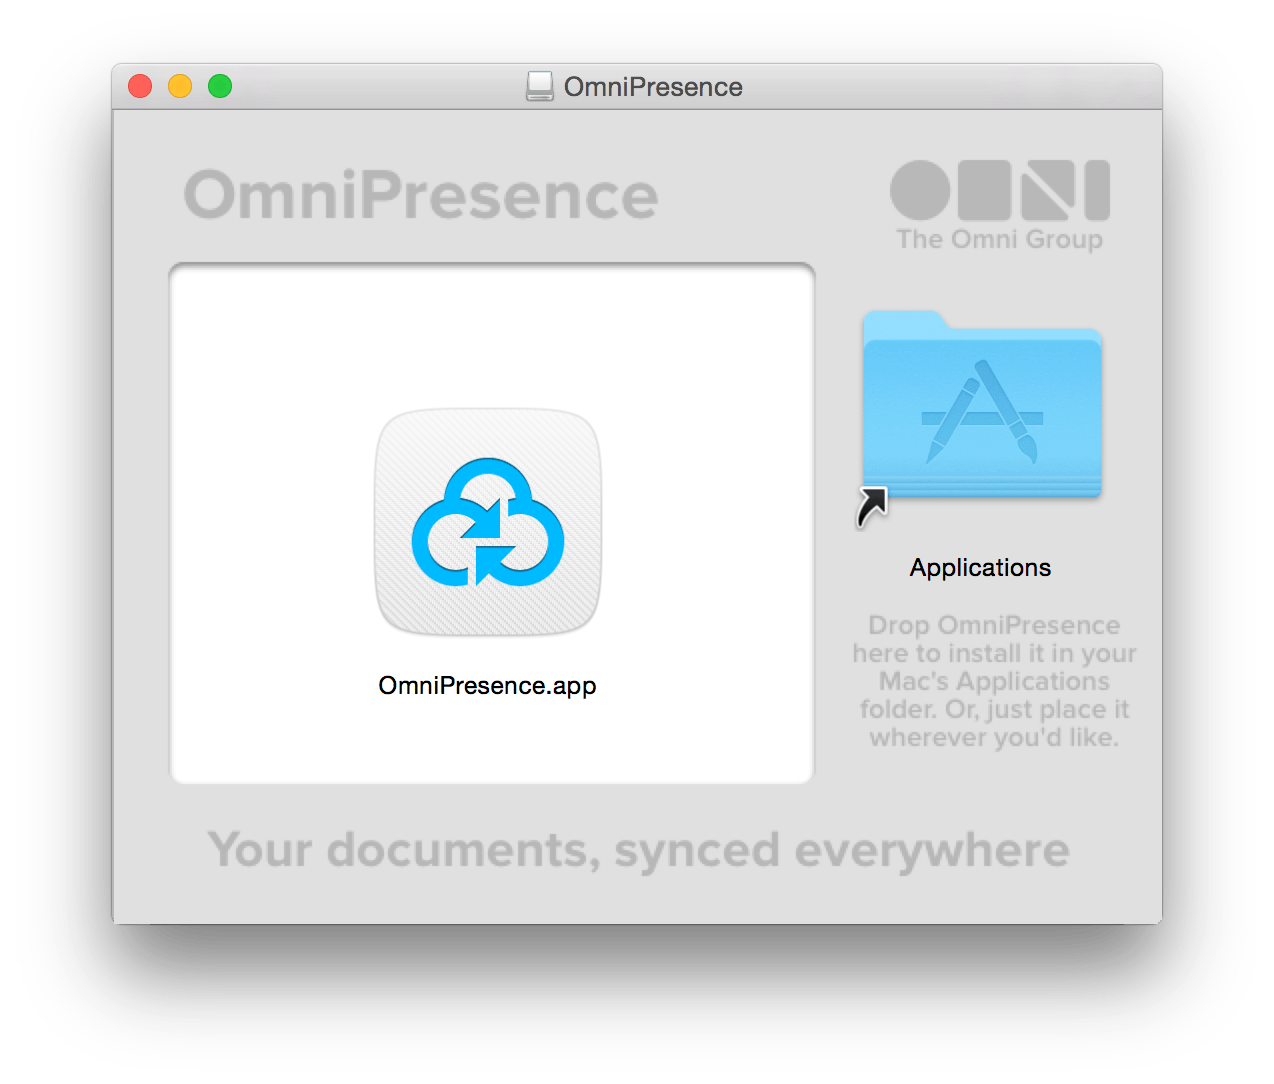
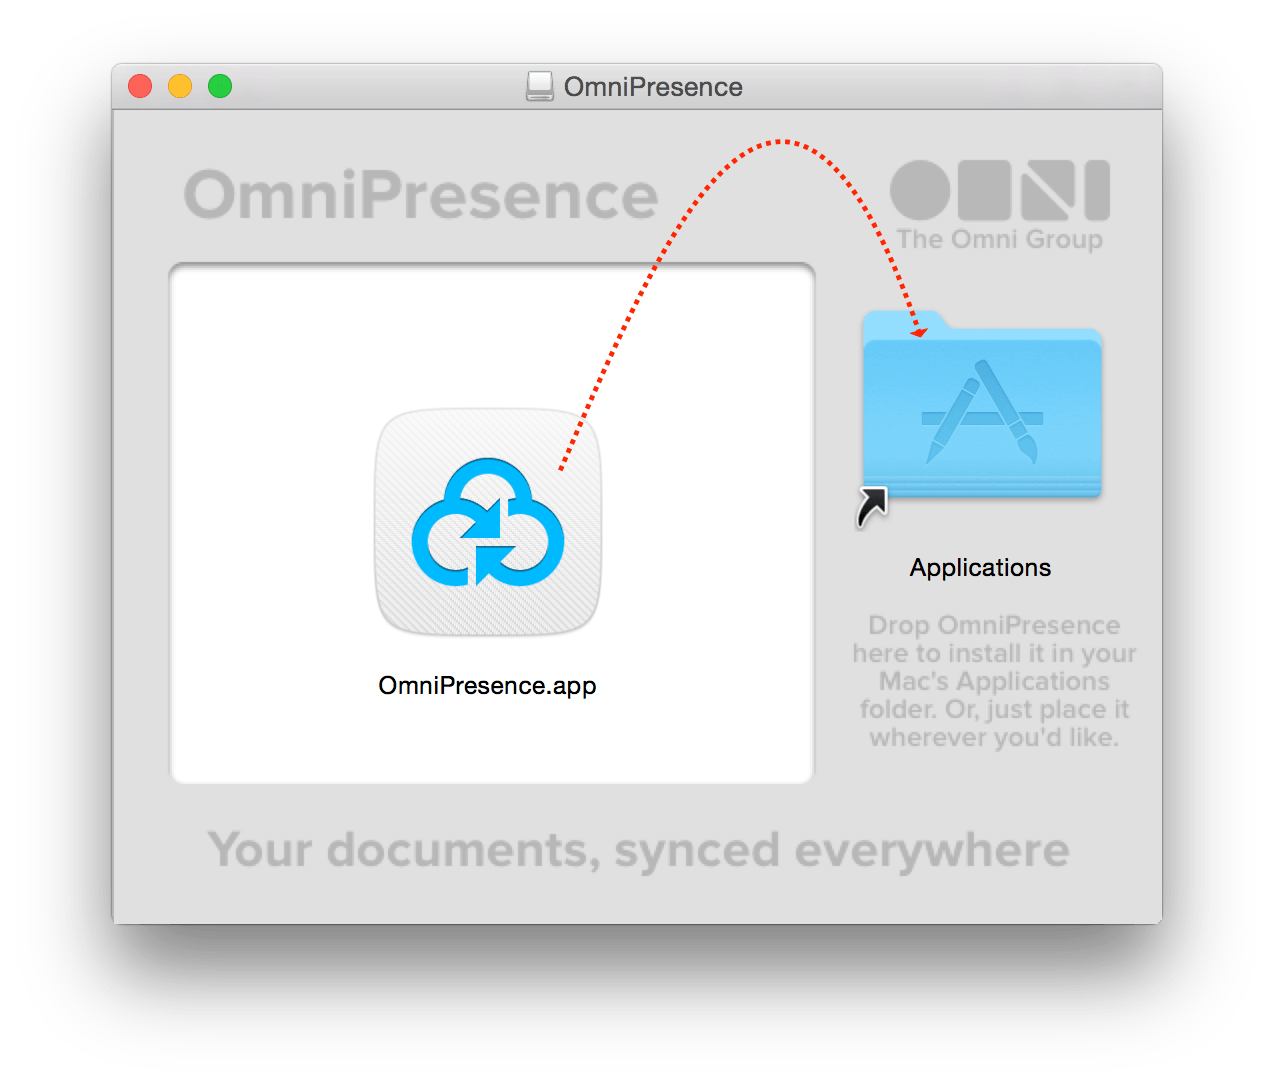
After agreeing to our license, you’re presented with the following window:
-
Drag and drop the OmniPresence.app icon onto the Applications folder to install OmniPresence on your Mac.
-
Close that window with Command-W
- In the Finder window, eject the disk image.
- In the Finder window, return to your Downloads folder. Select the file OmniPresence-1.4.dmg and press Command-Delete to move the file to your Trash. The next time you empty the Trash, that disk image will be purged from your system, saving you precious disk space. (You’re welcome!)
Even if you’re only using OmniPlan on your Mac, syncing is recommended for the automated data backup it provides. Best of all, our Omni Sync Server is free, and we take care of managing the servers so your data is always available when you need it most.
Starting OmniPresence and Connecting to Omni Sync Server
With OmniPresence installed on your Mac, it’s time to get it started and either create or connect to an existing Omni Sync Server account.
Let’s get started!
- Open a Finder window, and choose Applications in the Finder’s sidebar. (If you don’t see it there, choose Go ▸ Applications, or use Shift-Command-A.)
- Scroll down in the list of applications installed on your Mac and locate OmniPresence.app.
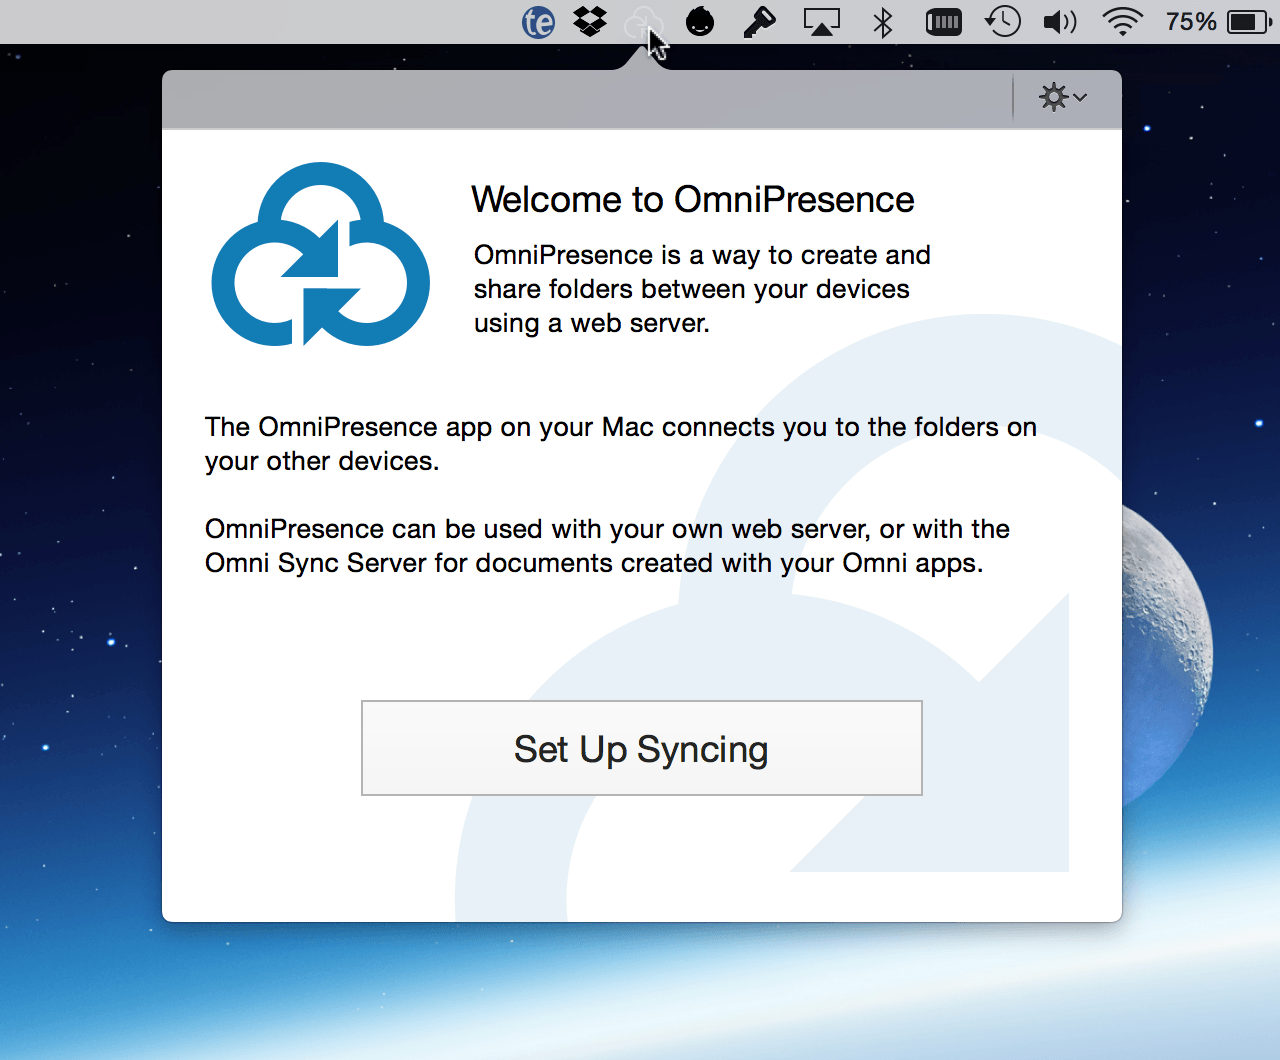
- Double-click the OmniPresence.app icon to open the app. OmniPresence installs and then pops open a menu extra in the menu bar; this is where you’ll configure and control OmniPresence.
-
Click Set Up Syncing:
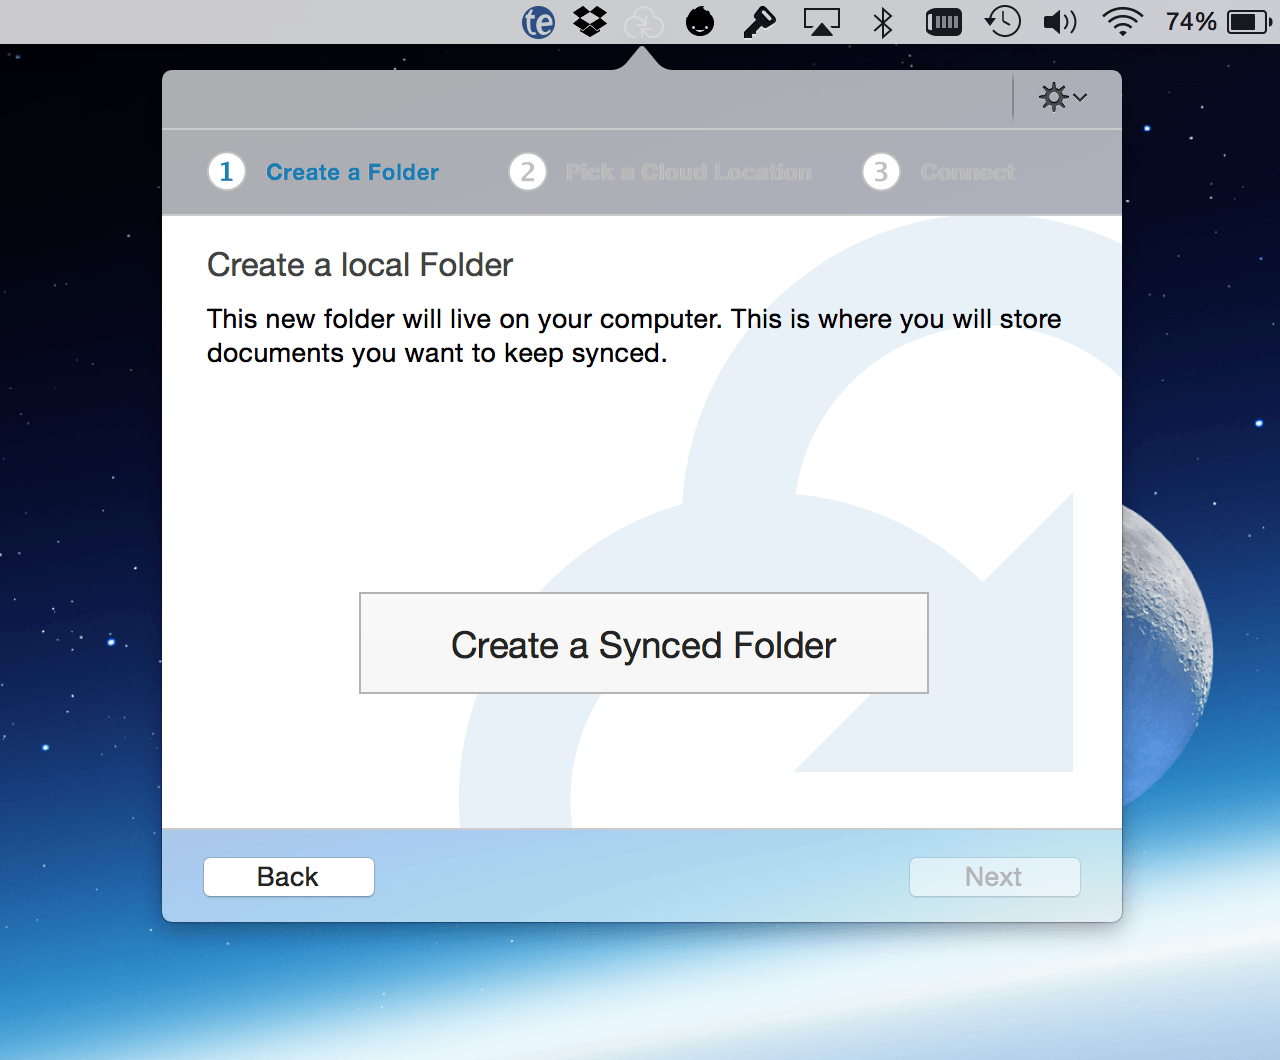
-
Click Create a Synced Folder:
-
In the sheet that appears, you have the option to name the OmniPresence folder that lives on your Mac. We’ve pre-filled the New Folder with OmniPresence, but you can change this to whatever you’d like.
Also, this folder is created within your Documents folder. You can also change this to something else, if you’d like. For example, you could opt to have your OmniPresence folder reside at the bottom level of your Home folder.
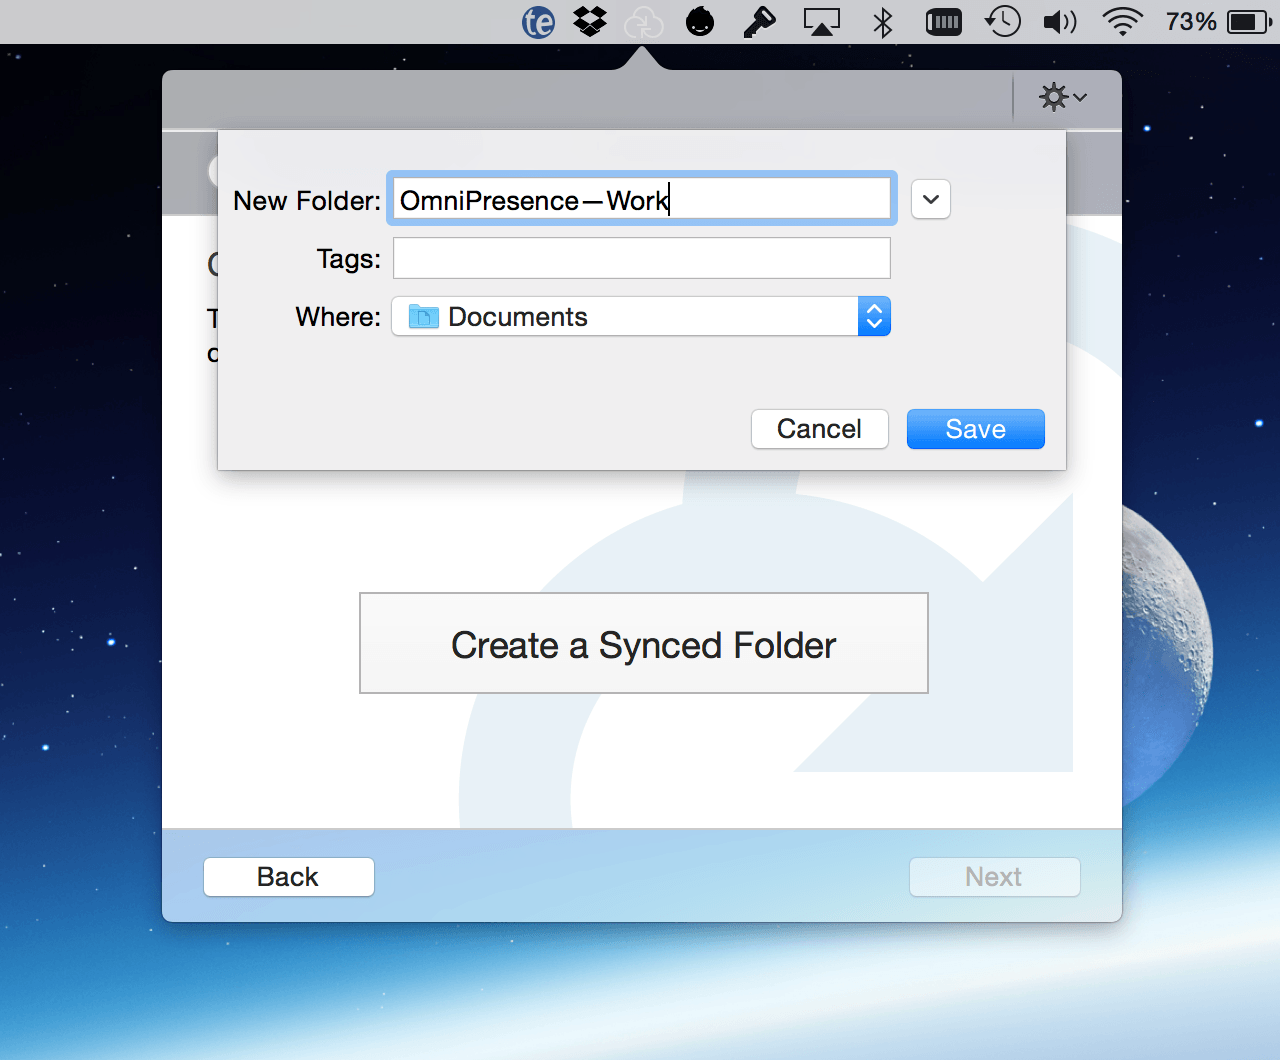
When you’ve settled on a name and location for your OmniPresence folder—or if you’ve decided to go with the default options—click Save. This creates the folder OmniPresence uses to synchronize your files.
-
After creating the OmniPresence folder, your next task is to choose a server in the cloud where OmniPresence stores your synced files.
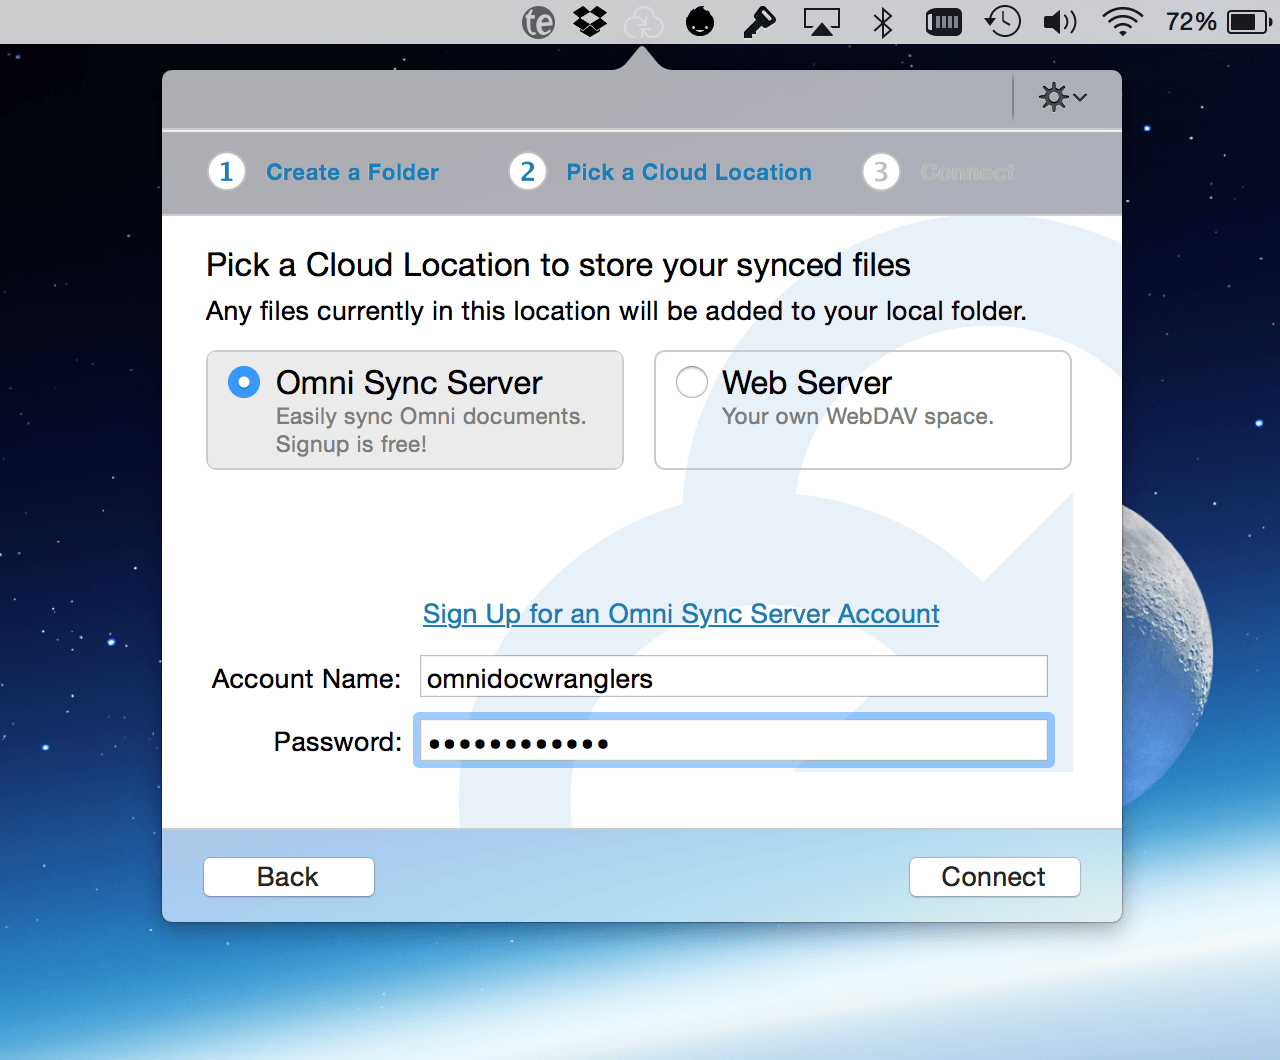
You have two options to choose from:
- Omni Sync Server: This is Omni’s free file server, which has specifically been designed to work in unison with OmniPresence.
- Web Server: This could be your own WebDAV server, or a WebDAV server hosted by a third-party provider.
If you have an Omni Sync Server account, enter your Account Name and Password in the applicable fields and click Connect.
If you haven’t already set up an Omni Sync Server account, click Sign Up for an Omni Sync Server Account. This opens your default web browser and transports you to the Omni Sync Server site where you can sign up for an account and set your password.
-
After clicking Connect, OmniPresence connects to the server you’ve chosen and tests for server compatibility. This is more of an issue with third-party WebDAV servers than it is for connecting to Omni Sync Server, which has been designed to work with OmniPresence.
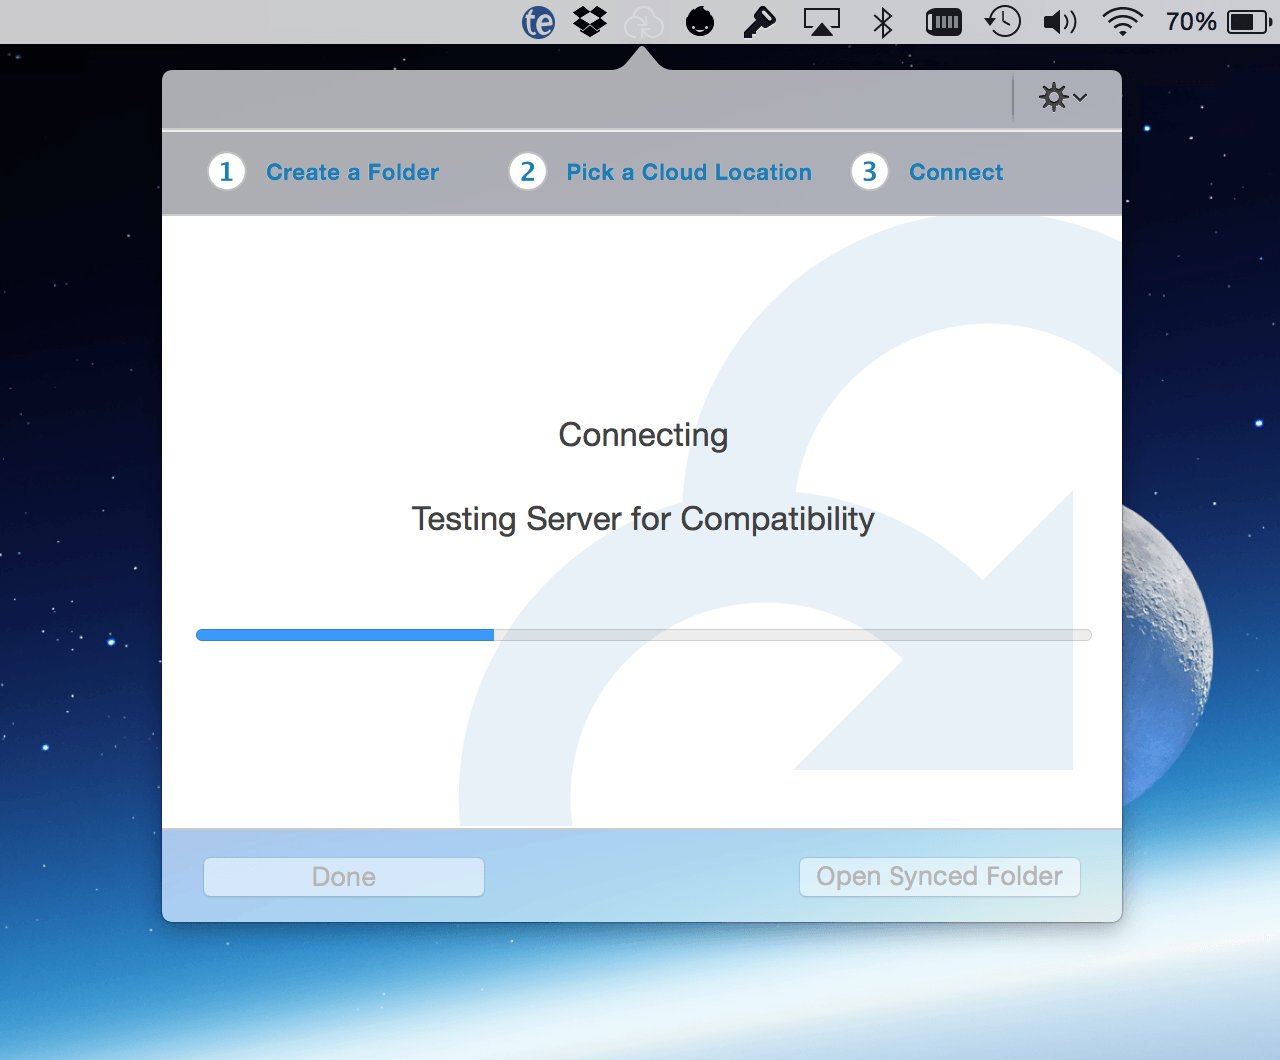
OmniPresence lets you know if it is able to connect to Omni Sync Server (or the WebDAV server you’ve specified).
-
Click the checkbox for Open OmniPresence at Login if you would like OmniPresence to start up whenever your log into your Mac.
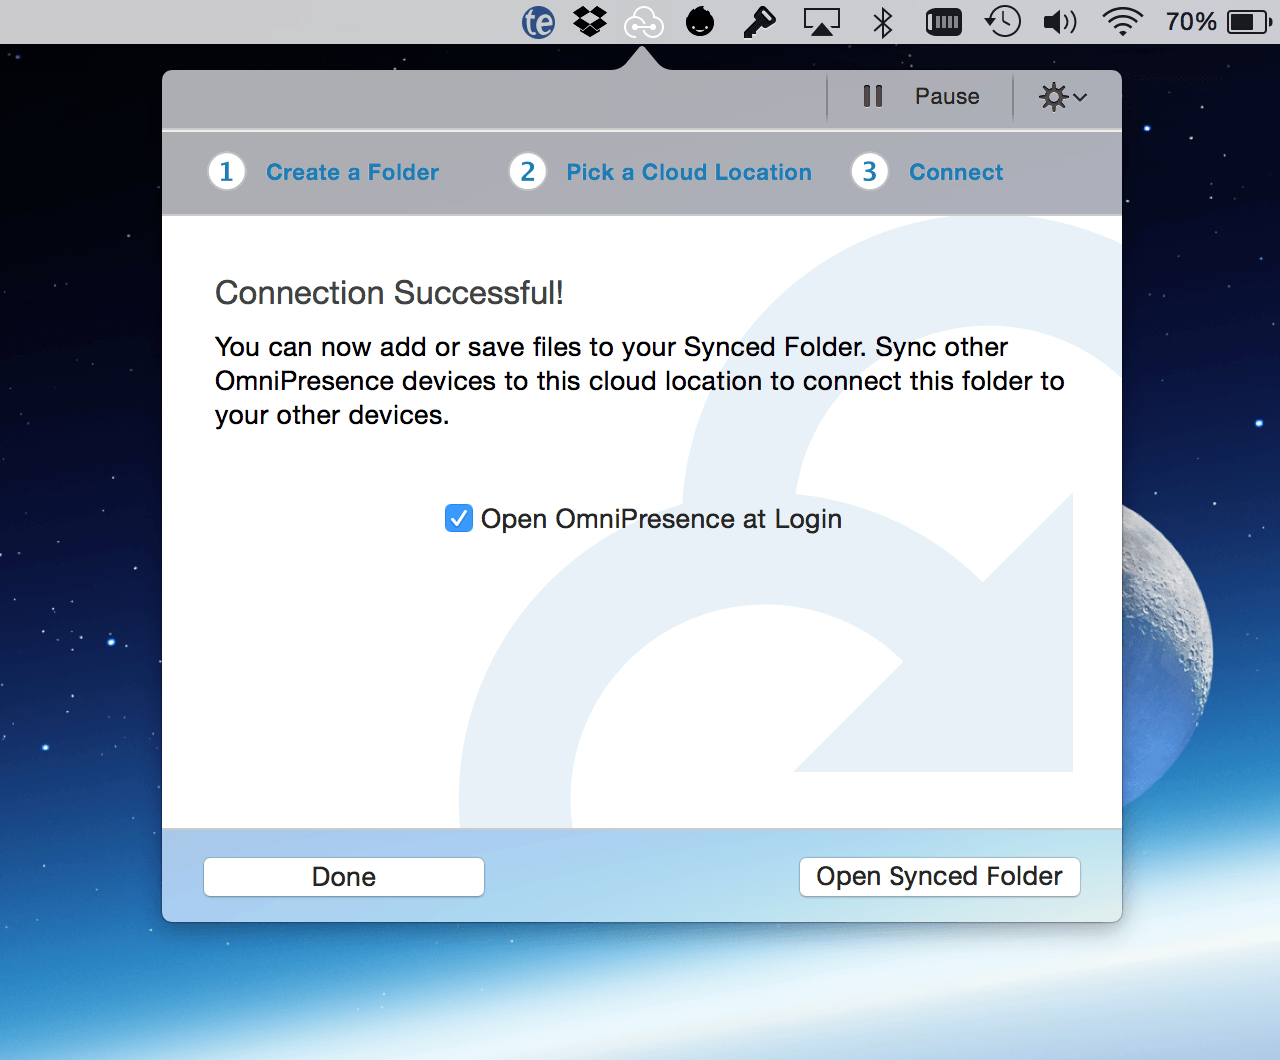
At the bottom of that window, click Open Synced Folder. This syncs your OmniPresence folder with Omni Sync Server (or a WebDAV server). If you already have an Omni Sync Server account, OmniPresence creates new synchronized versions of those files in the folder you’ve specified.
That’s it! Once OmniPresence connects with Omni Sync Server and creates the sync folder on your Mac, you’re ready to go. Whenever you create files with OmniPlan, be sure to save them to your OmniPresence folder (~/Documents/OmniPresence). OmniPresence syncs the files whenever you save, or when an Auto Save takes place on your Mac.
OmniPresence Tips
Here are some helpful tips for enhancing your OmniPresence experience:
- You can create subfolders within the main OmniPresence folder for the files you sync. For example, you could have subfolders for OmniOutliner, OmniGraffle, and OmniPlan, as well as other files you want to sync.
- You can Pause and Resume syncing by clicking the OmniPresence icon in the menu bar.
-
Click the Action menu (the gear next to the Pause/Resume button) for a host of OmniPresence options, including:
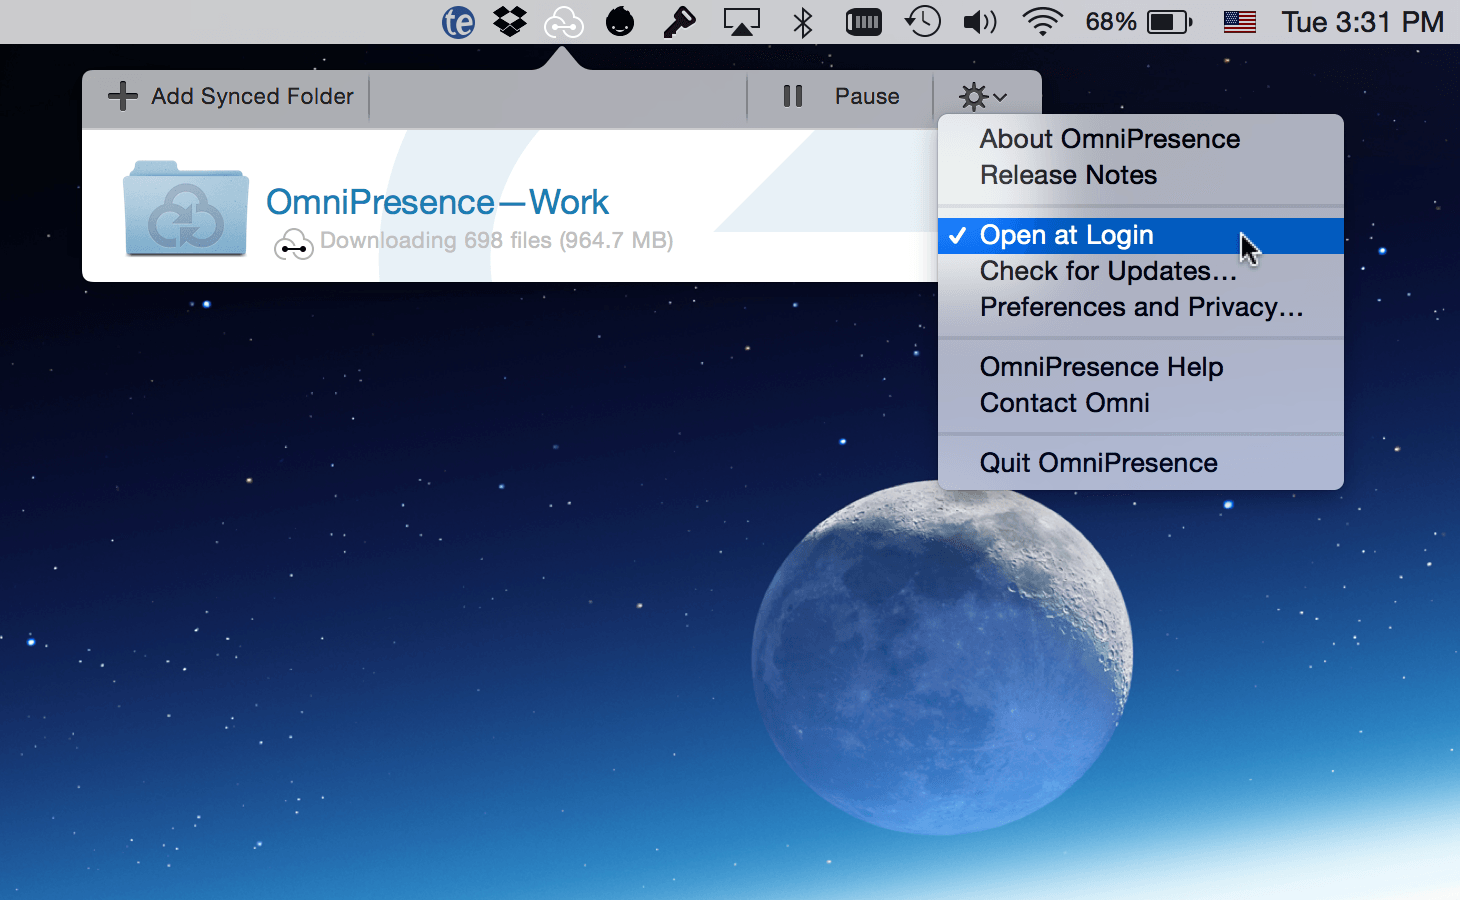
- About OmniPresence
- Release Notes
- Open at Login
- Check for Updates
- Preferences and Privacy
- OmniPresence Help
- Contact Omni
- Quit OmniPresence
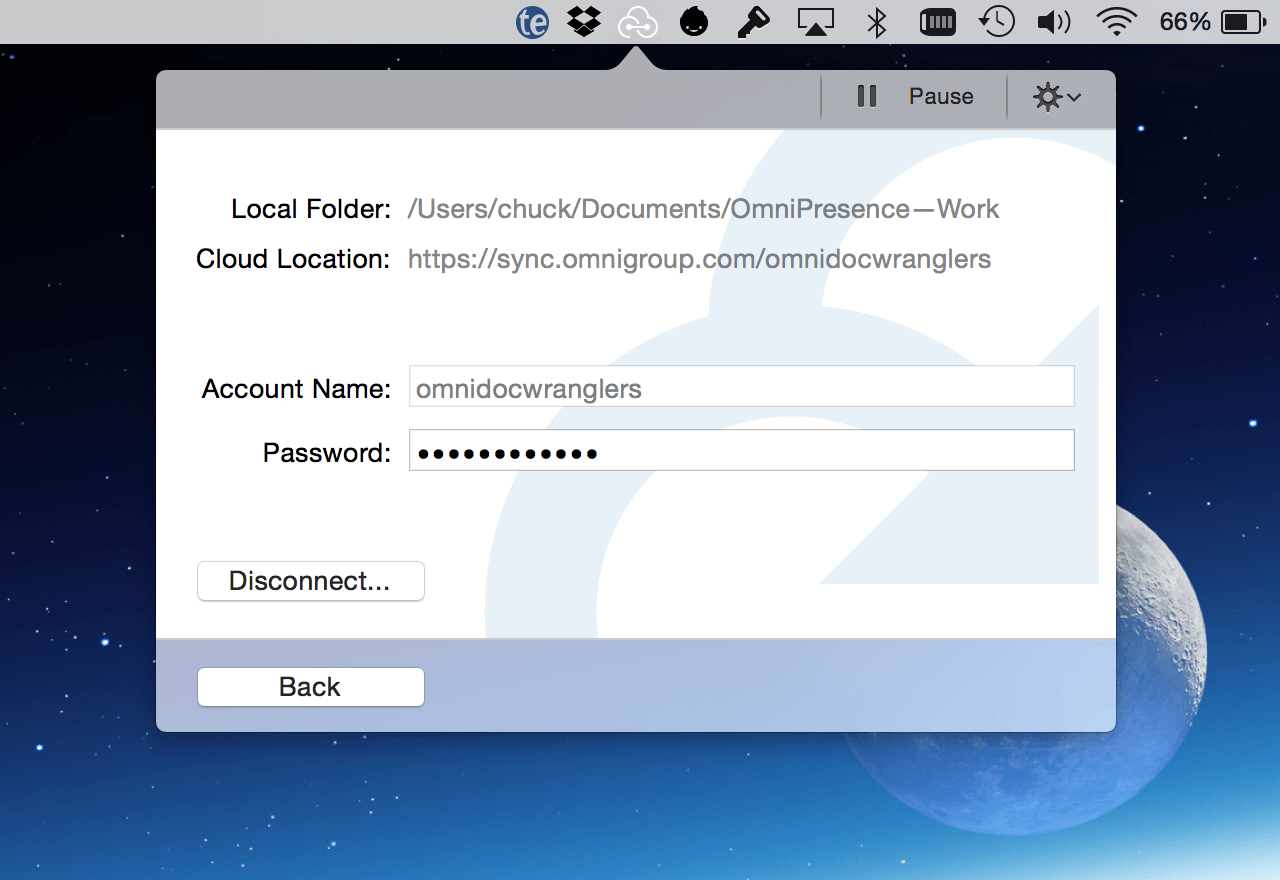
-
To stop syncing a folder you’ve connected, click its Info button and choose Disconnect. The folder on your Mac will be moved to the Trash and the files inside will no longer be synced. Any files left in the folder before disconnecting will stay safe and sound at the cloud server location you’ve specified. To reconnect and start syncing with those files again, just create a new folder connected to that cloud location.
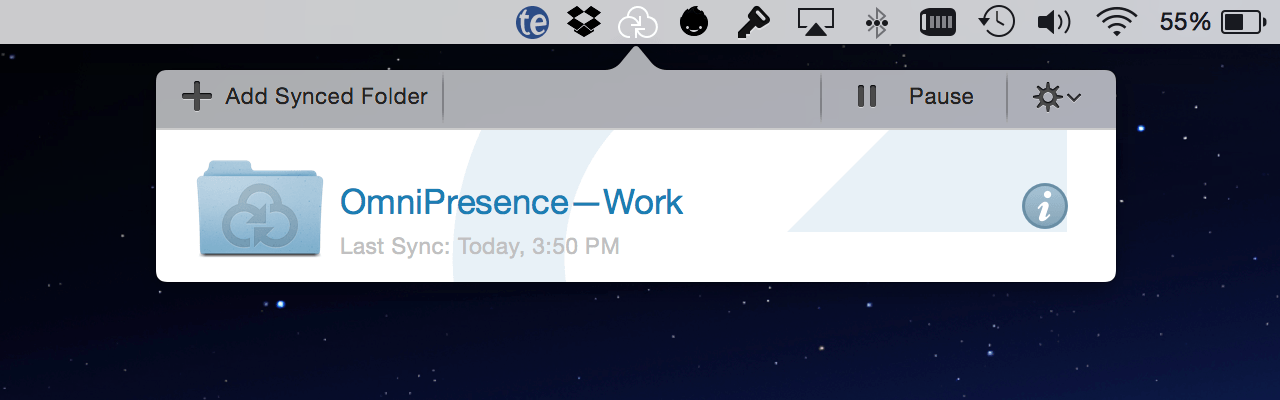
-
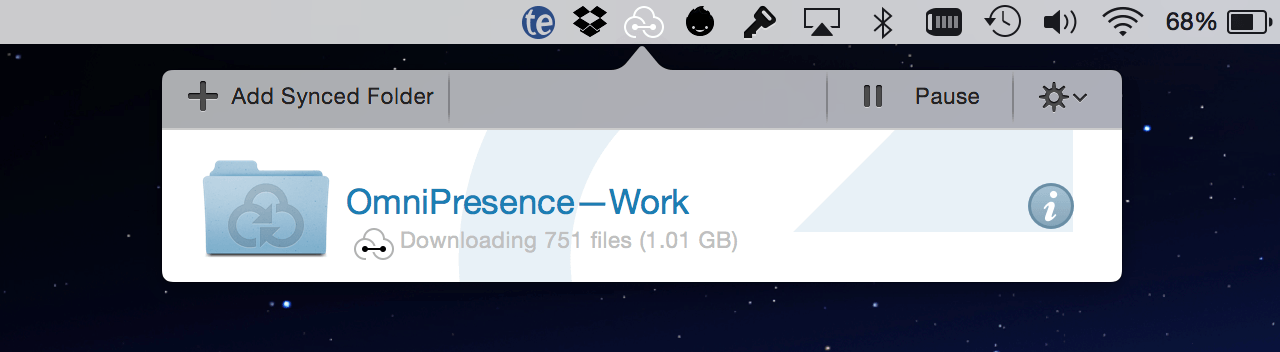
Unsure of when OmniPresence last synced? Click the OmniPresence icon in the menubar and then look beneath each folder name to see the date and time that folder last synced.
If you don’t set up sync now, but later decide that you want to, you can always install OmniPresence and set up an Omni Sync Server account when it’s more convenient for you.
Chapter 104
Collaboration and Multi-Project Review (PRO)
On a large project, or one where team members are spread across different teams and projects, you may need the ability to provide access to a project plan so that team members can check their status and update the project remotely. With OmniPlan Pro, working together no matter where you are is made possible by a powerful and intuitive Publication, Subscription, and Change Tracking system.
And, to make it easier for you to manage multiple projects with shared resources, OmniPlan Pro’s Dashboard makes it easy for you to review projects side by side.
This chapter describes features present in the OmniPlan Pro upgrade. If you have specific needs that these features address, you can try OmniPlan Pro for free at any time.
Publishing and Subscribing to an OmniPlan Project
As the project manager, you will need to publish the OmniPlan project to a sync server location to enable team members to subscribe to that project.
Because OmniPlan relies partially on your system time to determine the scheduling of synced project updates, making changes to the Apple system clock when working on a project with publishing or subscription enabled will result in an error and should be avoided.
Creating a Sync Account
Before you can share an OmniPlan project with its team members, you first need to sync it to a server that team members can also access. To setup a server account, follow these steps:
- Choose OmniPlan ▸ Preferences (Command-,) to open OmniPlan’s preferences window.
- Choose the Accounts preference panel.
-
Click the + button under the Accounts list to the left.
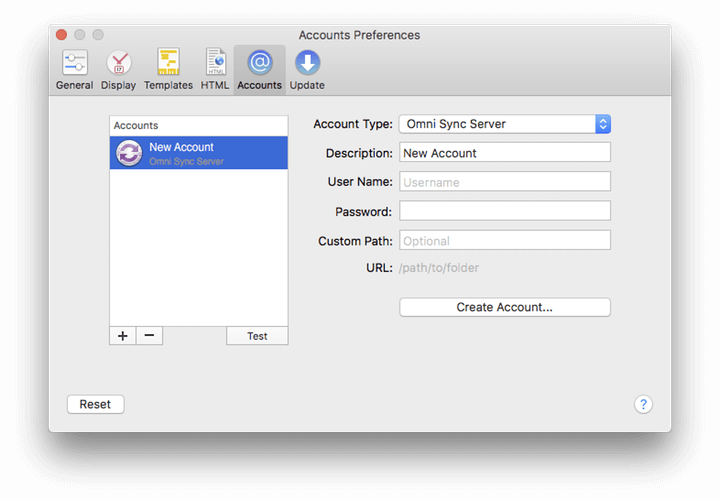
-
Select an Account Type from the dropdown menu. Use of Omni Sync Server is recommended; however, OmniPlan does support syncing project files to a self-hosted CalDAV or WebDAV server, or to Google.
If you have a personal account on Omni Sync Server (or one of the other services), it is recommended that you create another account specifically for syncing your projects. This helps protect your personal credentials—and data—from unauthorized access.
-
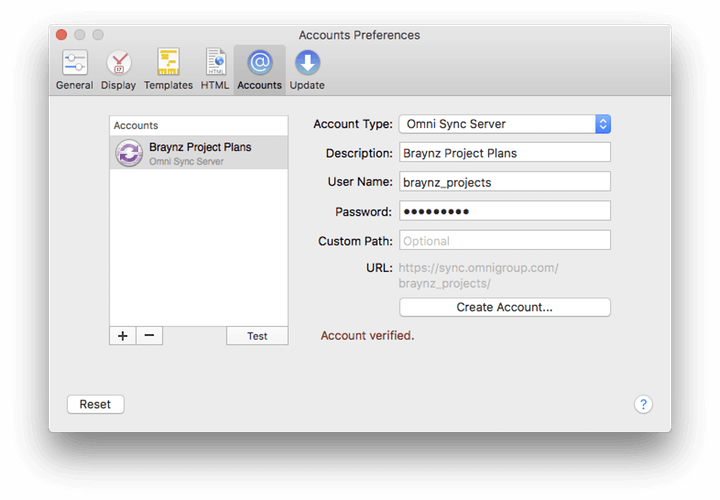
Choose Omni Sync Server. If you don’t already have an Omni Sync Server account, click Create Account to create one. You will be taken to a webpage where you can create an account; afterward, return to OmniPlan and continue setting up the Account preferences.
- Enter a Description for the entire account; something that other team members will recognize, such as your company or department name.
- Enter the User Name and Password for your account.
- The Custom Path must be to a folder or directory that already exists on the server. If you are setting up an Omni Sync Server account, you will most likely need to leave this field blank.
After entering the credentials for your Omni Sync Server account (or other Account Type, if you chose one of the other options), OmniPlan makes a handshake connection to that server to verify your identity. If you entered everything correctly, you’ll see an Account verified message beneath the Create Account button. Optionally, you can click the Test button to the left to check the account.
With the account verfied, close the preferences window.
Next up: publishing your project.
Publishing an OmniPlan Project
To share the project you’re currently working on, follow these steps:
- Choose Project ▸ Configure Publishing and Subscriptions.
- Click the plus button (+) below the Publish & Update Actions list.
- Select Sync entire plan with OmniPlan server repository to add the project to the list of actions.
- Select a Server Account from the pop-up menu (top-right); choose the option for the sync Account Type you established in the previous section.
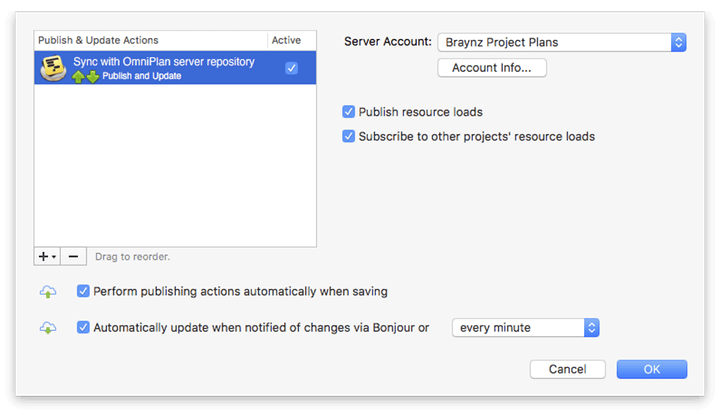
The remaining options on the Publish and Subscribe sheet are enabled by default to provide all team members with the best experience while working on a shared project. These include:
- Perform publishing actions automatically when saving.
- Automatically update when notified of changes via Bonjour; or you can choose a specified timeframe from the pop-up menu to the right.
- Publish resource loads.
- Subscribe to other projects’ resource loads.
To turn off any of those options, simply click the checkbox.
Click OK when you have configured the Publish and Subscribe options for the project.
-
You can publish your local version to the server by choosing Project ▸ Publish (Control-Command-P), or by clicking the Publish button in the toolbar. Or with the option here, you can choose to publish whenever you save changes.
-
You can update manually from the server at any time by choosing Project ▸ Update (Control-Command-U) or the Update toolbar button, or automate the update process as prompted by Bonjour, or at an interval specified with the dropdown menu.
Additional Options for Published Projects
Beyond simply publishing your project to the shared server repository, Publish actions can take a variety of other forms. Add additional Publish actions to your list of Publish & Update Actions when you click the + (Add) button, mentioned earlier. You can:
- Execute a custom AppleScript upon publish or update.
- Export your document with one of the export options.
Use Subscribe actions to pull in changes from others.
- Choose free/busy times from the Calendar Server to see available resource times and be notified of changes for particular resources or all of them.
- Choose offtime/overtime from iCal calendar to choose a calendar for the whole project or an individual resource. Specify whether events are extra or off hours.
- Choose offtime/overtime from web calendar and specify a URL, along with the schedule for a project or particular resource, and how events behave.
Due to limitations in Calendar sync, OmniPlan is able to fetch data out approximately 11 months from the present when subscribing to free/busy times from a Calendar server.
Use Sync actions to make changes to the project and pull in changes from others.
- Choose entire plan with OmniPlan server repository to sync all tasks, resources, and calendars—everything!—on a shared server.
- Choose to sync tasks to/from Calendar Server events to make changes and bring in changes from events on a calendar server.
- Choose to sync tasks to/from Calendar Server reminders to make changes and bring in changes from to-do items on a calendar server.
- Choose to sync tasks to/from iCal events to make changes and bring in changes from events in iCal.
If you didn’t choose to grant OmniPlan access to Calendar the first time you tried to create a Calendar-related publish or update action, you can grant it after the fact with System Preferences ▸ Security & Privacy ▸ Privacy.
Subscribing to an OmniPlan Project
As the project manager, your next task is to inform team members how they can subscribe to the published project. You will need to provide your team with the following information:
- Account Type: Either Omni Sync Server, CalDAV, WebDAV, or Google.
- The User Name and Password used to access the sync server account.
- The name of the file to which they will subscribe.
Team members will use that information to add an account in the Accounts preference panel (see the instructions earlier in this chapter). Once they have created the account, the members of your team can subscribe to the project with the following steps:
- Open OmniPlan.
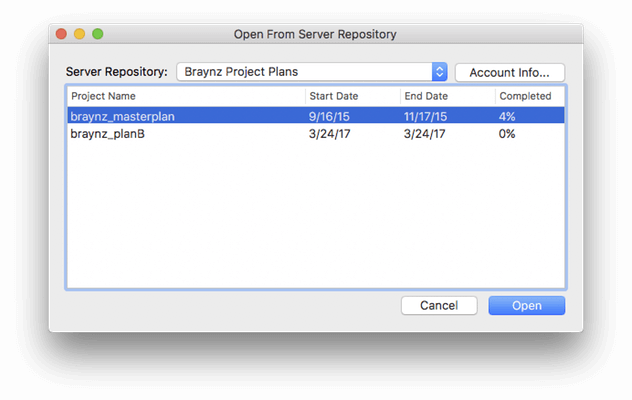
- Choose File ▸ Open From Server Repository.
- At the top of the window that appears, use the pop-up menu to select the Server Repository.
-
Click to select the Project Name from the list of available projects in that Server Repository.
-
Click Open.
- Save a copy of the project file locally on your Mac’s hard drive.
Once subscribed, members of the team can edit and review the OmniPlan project using their local file. Any changes made to the project file are saved to the sync server. If another team member has the project open and is reviewing the project, the changes you save are synced with the other person’s open project file.
To ensure that your local copy of the project file is always up to date with the latest changes from other team members, we recommend that you follow these steps whenever you open your local copy:
- Open the OmniPlan project file that you have saved locally.
- Get updates to the project; choose Project ▸ Update (Control-Command-U).
- Accept or reject changes; choose Project ▸ Show Changes (Option-Command-T).
- Make your changes to the project file, and then choose File ▸ Save (Command-S).
- Publish your changes to make them available to other team members who subscribe to the same project; choose Project ▸ Publish (Control-Command-P).
Tracking Changes in Published/Subscribed Projects
Once you’ve specified the kind or kinds of subscribing you’d like to do, you can use change tracking to see your changes and accept or reject the changes of others.
To enable change tracking, choose Project ▸ Show Changes (Shift-Command-T). A sidebar appears that logs the changes you make and shows the changes of your teammates, along with a toolbar (beneath OmniPlan’s main toolbar) with controls for accepting and rejecting the changes of others.
To accept or reject all changes, use the Accept All and Reject All buttons in the change tracking bar.
To accept or reject individual changes, select an individual change in the sidebar and use the Accept or Reject buttons.
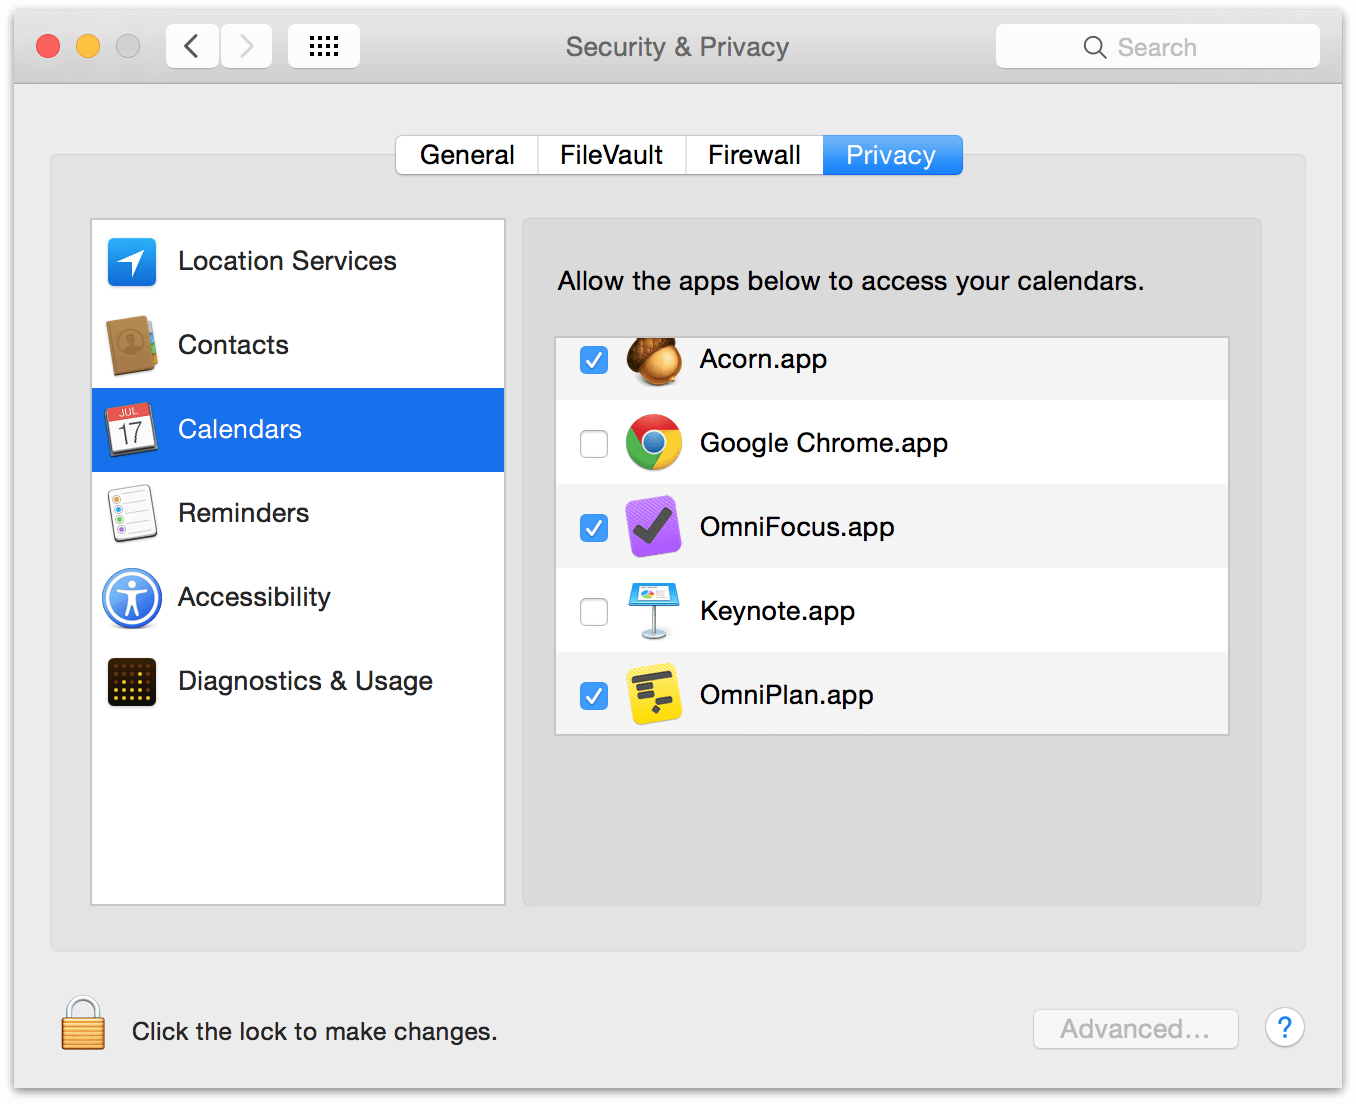
Balancing Resource Loads Across Projects
If resources (usually human members of your team) are shared between multiple projects in the same repository, you’ll want to decide in the Configure Publishing and Subscriptions panel whether you’ll publish the current project’s resource loads to other projects and whether the current project will subscribe to the resource loads of others.
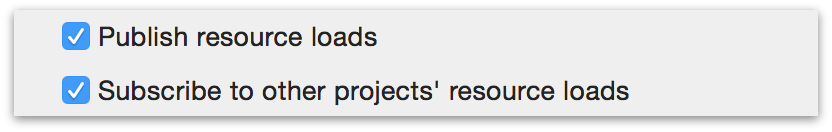
Choosing to publish a project’s resource loads means that other subscribing projects will obey its workload information when leveling; if Julie is working on Project A on Wednesday and its loads are being published to Project B, after leveling Project B won’t schedule her to work on Wednesday.
Choosing to subscribe to resource loads means that the project will obey all constraints by projects in the repository that are publishing their loads. By using only the publish or subscribe option a hierarchy of priority can be established between simultaneous projects — a project that only publishes will always have its needs met first, while a project that only subscribes will be assigned resources only when they can be spared.
By both publishing and subscribing, projects are treated as equals — and if a project neither publishes or subscribes, it ignores external factors and syncs only with its own updates.
The key to balancing resource loads across projects is that individual resources be tagged and identified by a unique email address that is shared across all projects. This can be set in the Resource Info section of the Resource inspector.
Managing Server Repositories
Once you have an account set up and have begun publishing and subscribing to projects, you can manage your repository accounts and shared projects with the centralized Server Repository screen. Choose OmniPlan ▸ Server Repository to see and manage your shared OmniPlan projects.
The Server Repository window is empty if you open it before creating an account, or while publishing your first project.
The Account menu lists your Omni Sync Server and WebDAV accounts by name (as set up in Accounts Preferences); these account types can operate OmniPlan repositories. Choose an account in the pop-up to see the projects in its repository. To add to or edit your accounts, click the Account Info button.
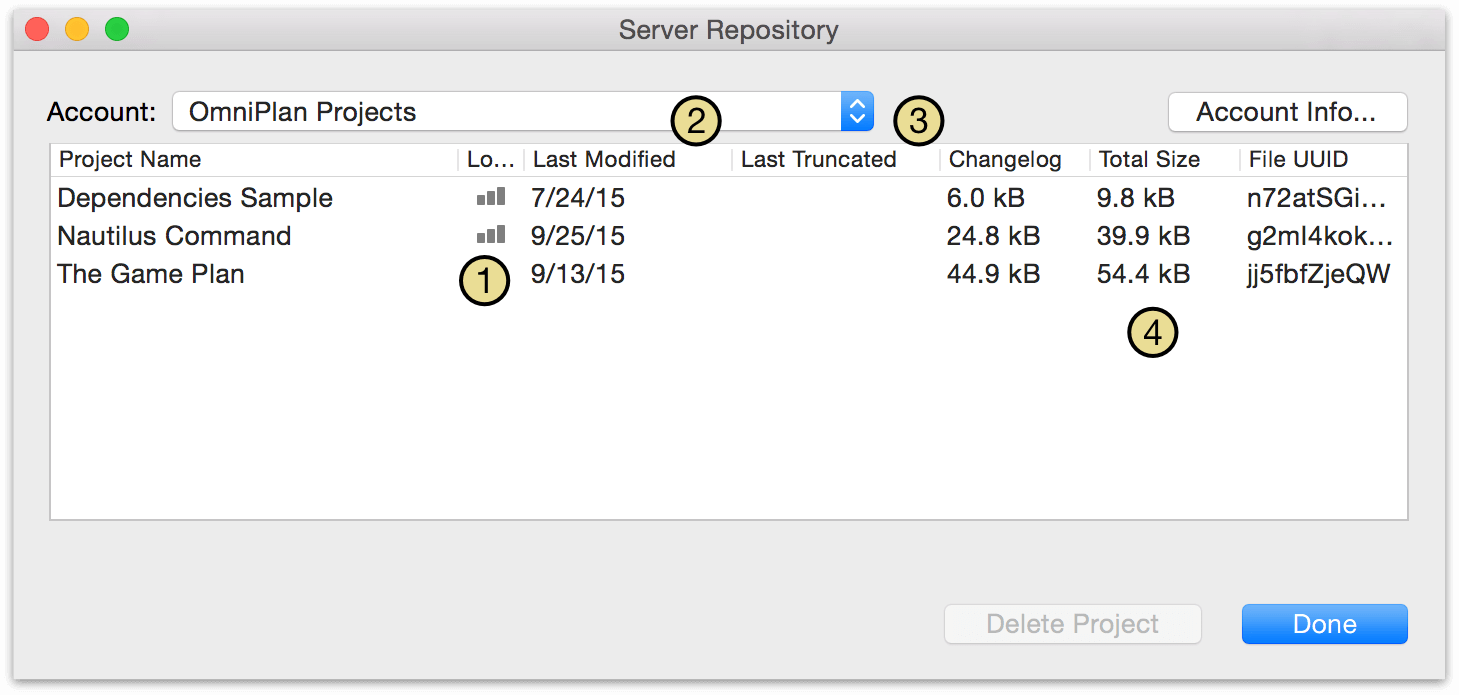
The list shows all projects that have been published to the repository, and the following information about them:
-
Load — Indicates, by the presence of a vertical bar graph icon, whether these projects are sharing their resource load information with other projects in the repository for the purposes of leveling resources across projects.
-
Last Modified — The date when the project was last modified by any user with shared access to it.
-
Last Truncated — To optimize the speed of syncing on currently active projects, once a certain size threshold is exceeded in the sync log OmniPlan sets aside older changes on the server and “truncates” what is synced to only the newest set of changes. If OmniPlan sees that a project hasn’t been updated since the date the changelog was last truncated (shown here), it retrieves older changes from the archived logs on the server.
-
Changelog, Total Size, File UUID — The file size of the changelog and total project respectively, and the unique ID assigned to the project on the server.
Cleaning Up Stale Usage
When sharing projects on a server, in some cases resource load sharing information for deleted projects may be left behind on the server. This happens if someone removes a project that is sharing resource loads using a version of OmniPlan older than v2.1, or if someone deletes the file directly from Finder or Terminal.
If OmniPlan finds unused resource load information on the server, it detects the problem and prompts that you clean it up. Until you allow it to clean up, there may be misleading resource load information shared with your active projects.
The clean way to remove a project from a server repository is by opening the Server Repository window in OmniPlan v2.1 or newer and using the Delete Project button.
Using Dashboards for Simultaneous Project Review
When you’re managing or working on multiple projects, it is essential to ensure that the projects are on track and that any shared resources are correctly assigned. To help facilitate management of and participation in multiple projects, you can use Dashboards OmniPlan Pro.
Dashboards introduce a new file type to OmniPlan Pro: the OmniPlan Dashboard file format (.opld). An OmniPlan Dashboard file is a window that you can customize by adding as few or as many projects to it to manage your projects. When saved, the Dashboard file preserves the projects you have added to it, enabling you to quickly review your projects by opening the Dashboard file in OmniPlan Pro.
Creating a New Dashboard
To create a new Dashboard, follow these steps:
- Choose File ▸ New Dashboard (Shift-Command-N).
-
Click
 to add a project to the Dashboard. This opens a sheet from which you can locate and choose OmniPlan projects to add to the Dashboard. Alternately, you can also drag OmniPlan project files into the window from the Finder.
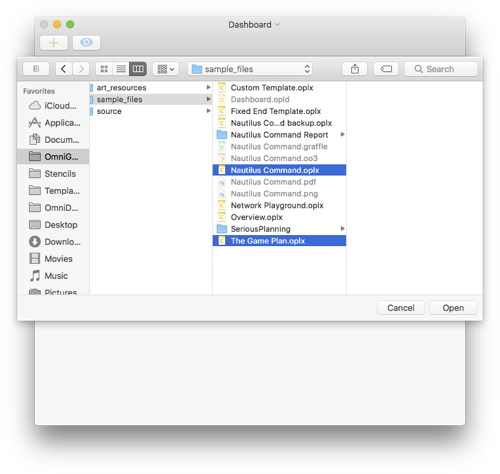
Reviewing Projects in the Dashboard
As you add projects to the Dashboard, you’ll see them laid out as rows with summary graphics of the projects’ Gantt charts in two-tone color schemes that reflect the work completed and the work yet to be done (these colors represent their respective projects throughout the Dashboard).
In addition to rows representing your projects, you’ll see an additional, automatically generated row — a graph of Idle Time to indicate when the projects’ resources are available for other tasks. White bars of idle time represent unused time in the past, while dark gray bars represent available time in the future.
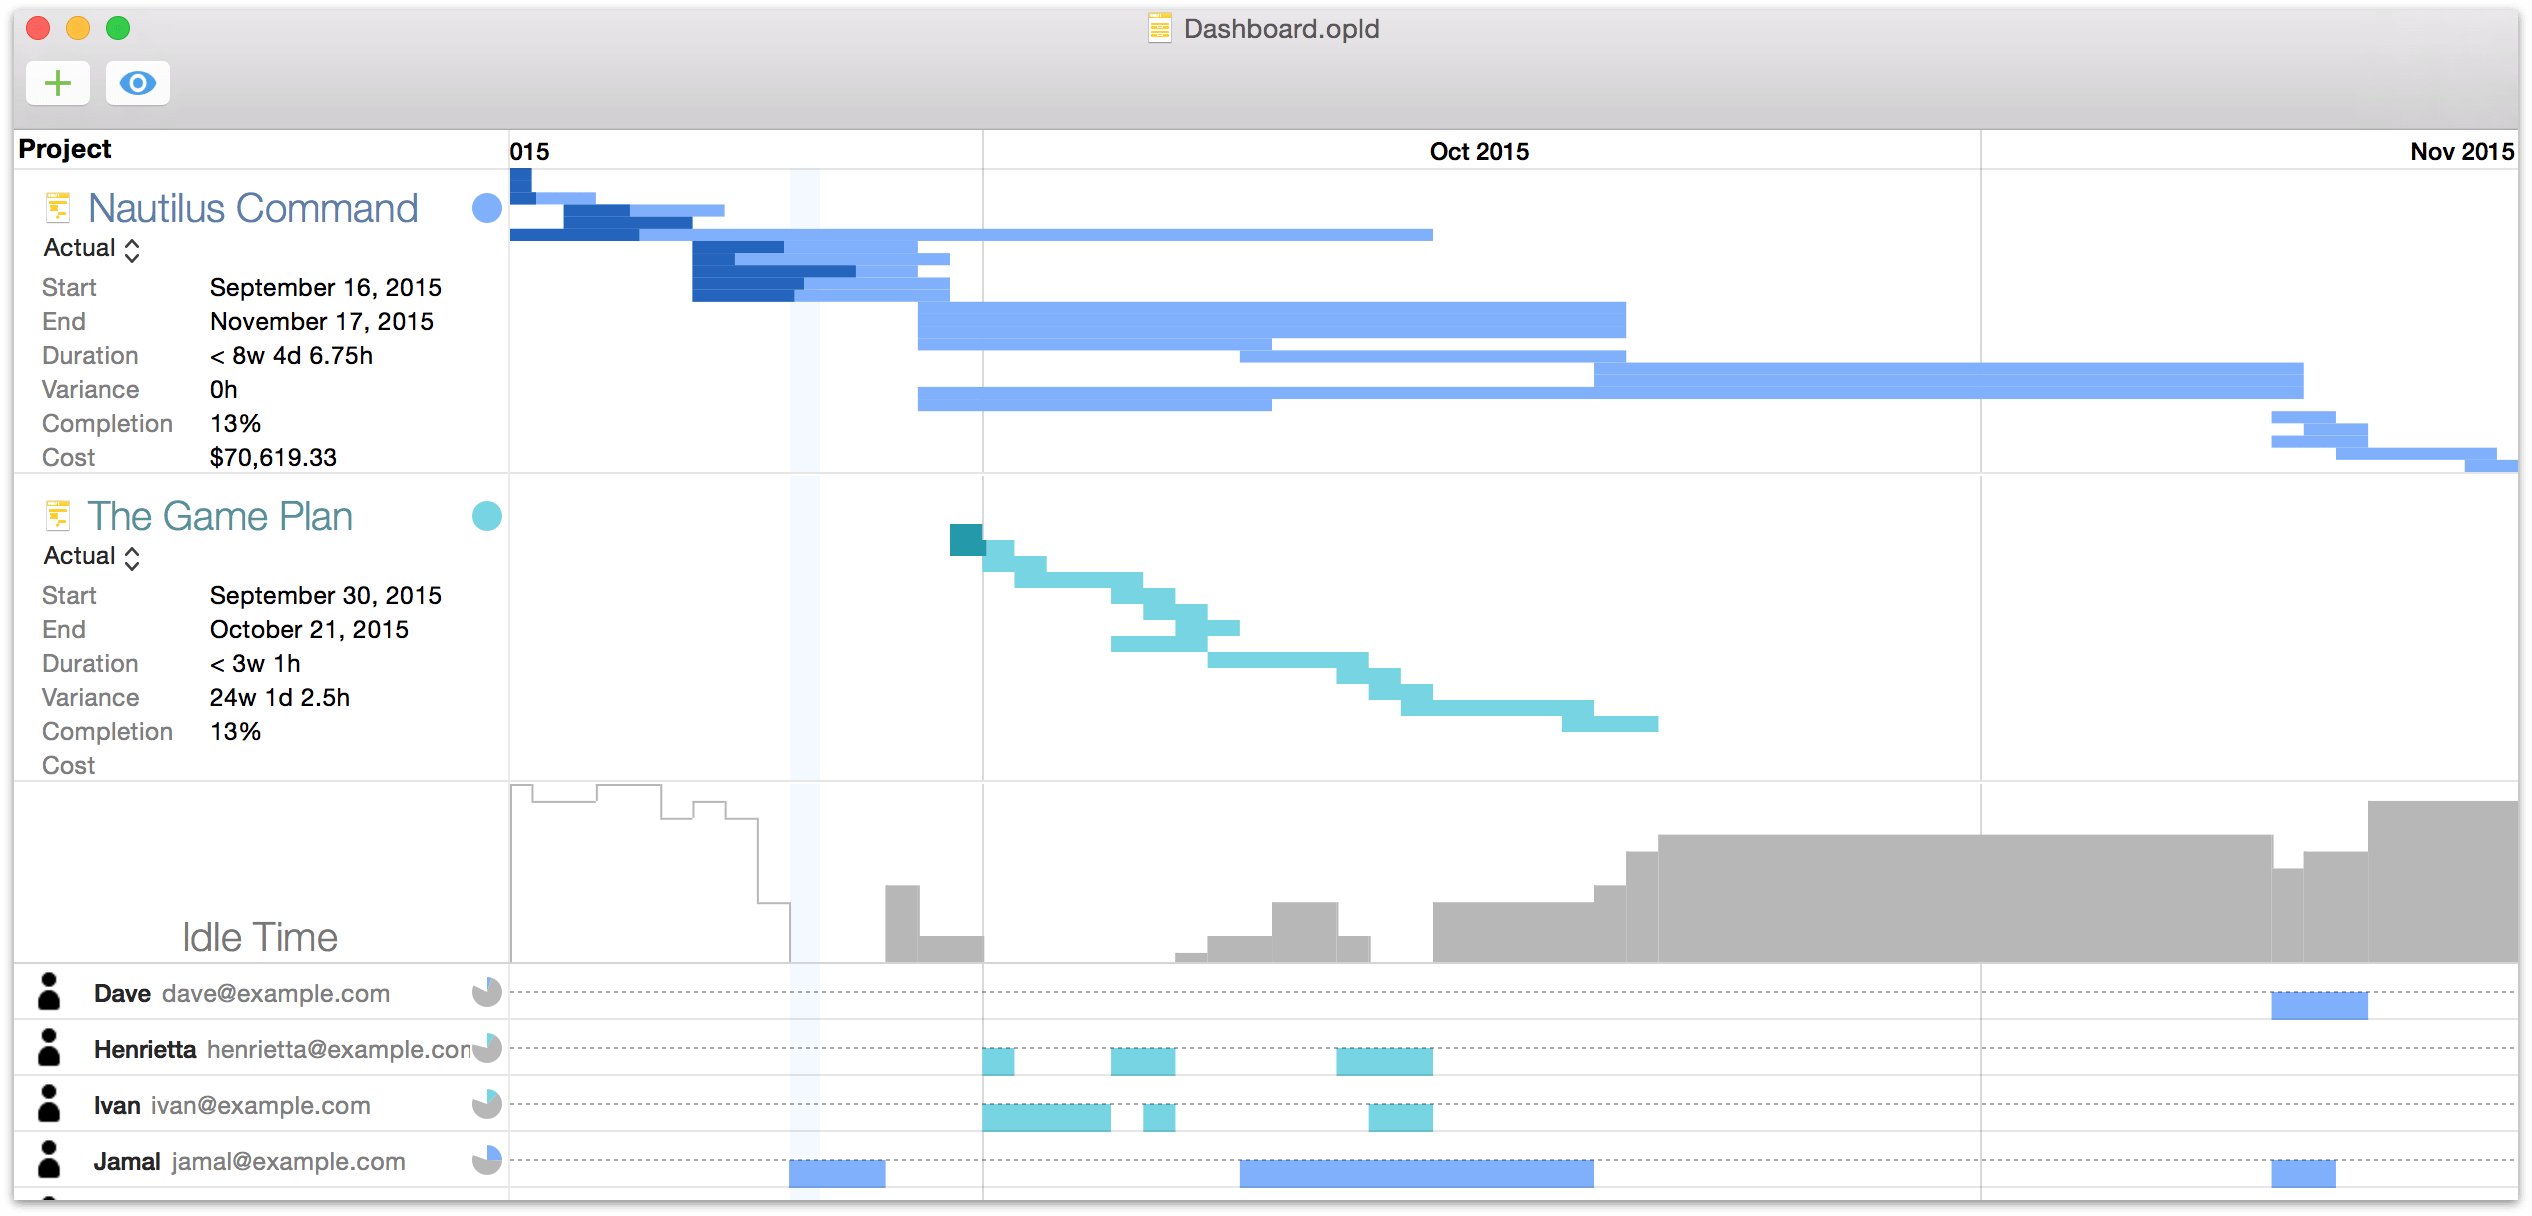
Along the bottom of the Dashboard window, you’ll find a list of any resources to which an email address is assigned. Next to each person, you'll see diagram-style bars that illustrate when each person is busy or available, along with pie chart reference graphs noting the split of their effort between the projects in the Dashboard and their Idle Time.
Click  to open the Dashboard window’s View menu, which offers the following options:
- Project Overview — Choose between the Gantt comparison view or a bar chart view for displaying the chronology of projects with task bar heights based on the amount of effort required for completion.
- Show Project Stats — Shows or hides details about the project(s) on the Dashboard, including start and end dates, duration, variance, completion, and cost.
- Show Resources — Shows or hides the list of project resources along the bottom of the Dashboard window.
You can open a project directly from the Dashboard by clicking its document icon. Edits made to project files included in the Dashboard are reflected there right away, so you can immediately see the effect your changes have on the project in question—and potentially on others, if you’re sharing resources between projects.
Sharing Resources Between Projects
The power of dashboards is realized to its fullest when you’re also taking advantage of the publication and subscription of resource loads (described earlier in this chapter) of the projects included in your dashboard.
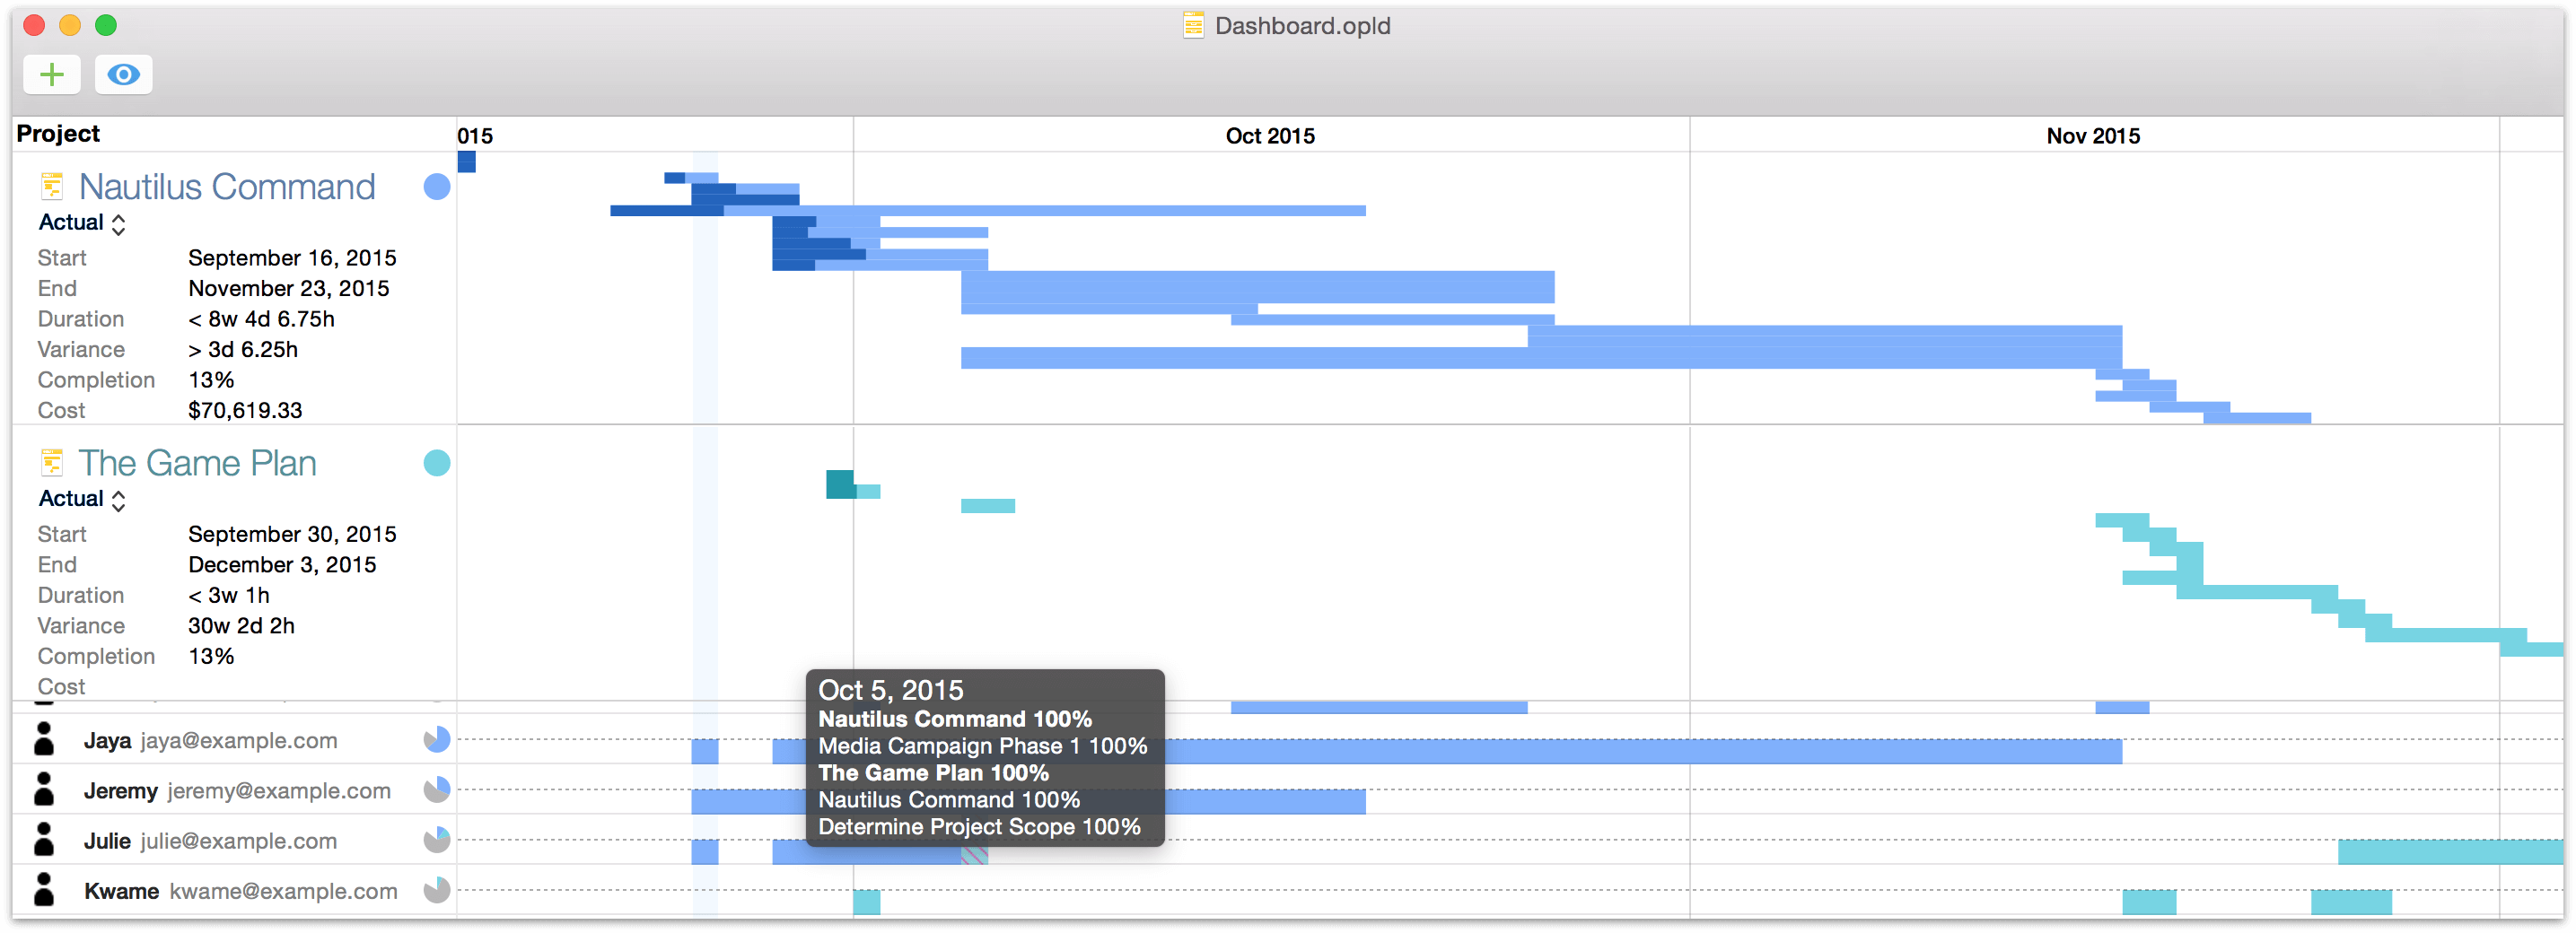
When balancing resource loads across projects in a shared server repository, the dashboard recognizes that resources are being shared and provides a window on the intersection between resources and the projects they’re working on (sometimes simultaneously at 100% effort, as in the example above). You can identify where resources are overloaded (or are standing idle), and make the changes necessary to ensure your projects are running in tandem at peak efficiency.
Printing Dashboards
When you have a dashboard set up just the way you like it and you want to share it with others, you can print it straight from the File menu (Command-P).
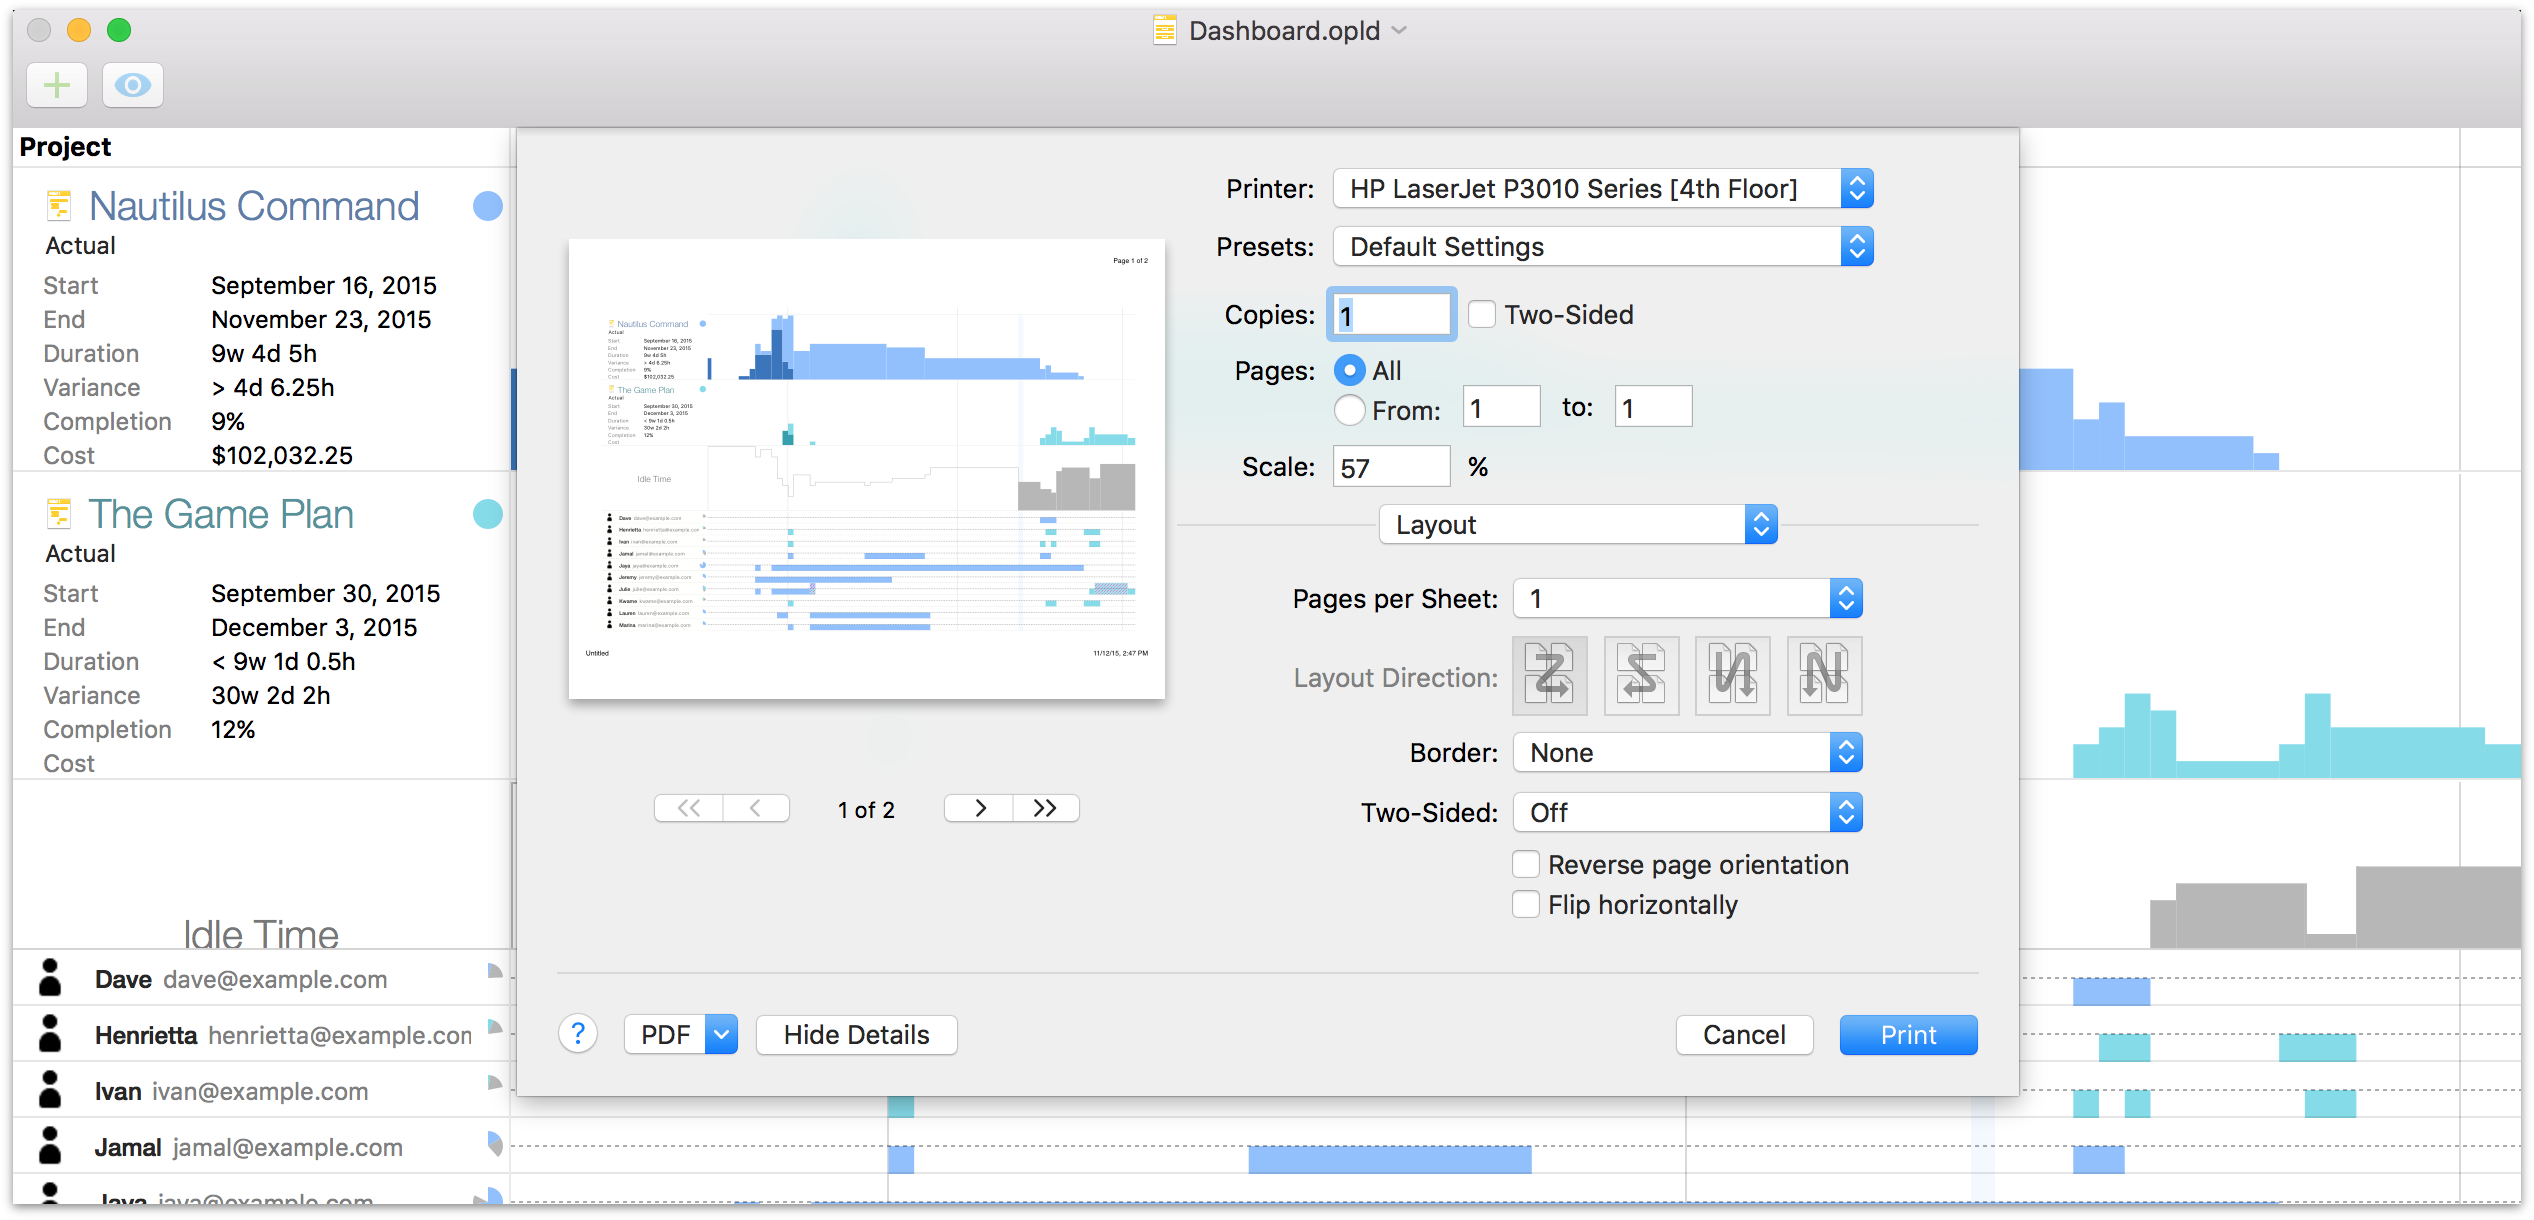
Print-time options for dashboards are pretty straightforward; as with all standard documents in macOS, you can choose to save the dashboard as a PDF rather than send it to a printer. The standard page setup controls are available as well.
The most important thing to note about printing dashboards is that what you see is what you get — the content of the print preview changes based on the dimensions and content of the dashboard’s window at the time of printing.
A dashboard’s printed page width is dictated by the bounds of the window, and will never exceed one page; excess pages are generated vertically only. If you find that the printed version of your dashboard extends vertically more than you would like, consider turning off display of project stats and resources in the dashboard’s view menu.
See the Reporting and Printing chapter for details on printing the content of a single project.
Chapter 105
Working in Task View
Tasks are the building blocks of any project: the steps that must be completed on the road to an ultimate goal. OmniPlan provides a suite of powerful tools for customizing tasks — and the relationships between them — to match the exact parameters of your project.

Enter Task View by clicking the first button in the view switcher in the toolbar, or choosing View ▸ Task View (Option-Command-1).
Creating and Deleting Items
Task View contains two primary zones of interaction: the task outline, and the Gantt chart. As you begin building a project, rapidly creating new tasks and milestones (and removing extraneous ones) are key parts of the process — and Task View’s outline is perfect for the purpose.
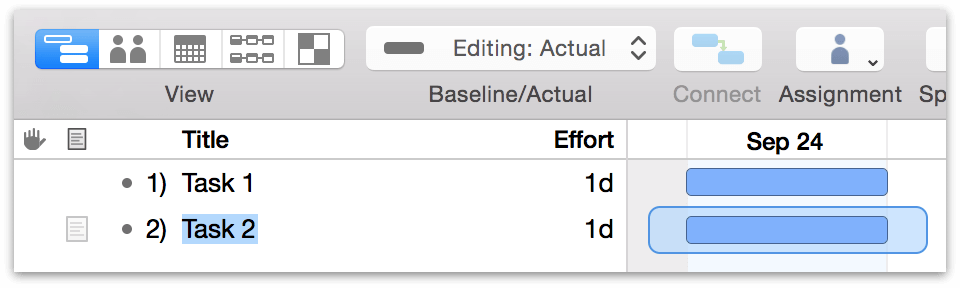
There are several ways to create new items in Task View:
- Select an item in the task outline and press Return (or Command-Return, depending on the keyboard options in OmniPlan’s General preferences).
- Click the Add button in the toolbar.
- Secondary-click and choose Add ▸ [task type] from the contextual menu.
There are a few ways to delete a task, milestone, or group:
- Select an item in the outline, then press the Delete key.
- Select the item, then click the Remove button in the toolbar.
- Select the item, then Control-click to reveal the contextual menu and choose Delete.
If you’re publishing and subscribing with OmniPlan Pro, new tasks and changes can come from other users of the project. Use the change tracking sidebar to accept or reject these changes.
Tasks have a lot of details to keep track of. You can edit a task visually in the Gantt chart, or with one or more tasks selected in the task outline, use the Task Inspector to edit their details.
Connecting Tasks with Dependencies
When a task must be completed before another can begin, a dependency exists between them. Charting dependencies in your project is a key part of understanding the critical path of tasks that leads through to its successful completion, on time and within budget.
Using the Gantt chart in Task View, you can represent the relationships between tasks with dependency lines. A dependency line is drawn from the beginning or end of one task (or group, or milestone) to the beginning or end of another.
When you create a dependency, the dependent task automatically reschedules itself to respect the dependency. With further changes to the schedule and leveling, the tasks continue trying to follow the dependencies. If a dependency becomes impossible or you manually cause a task stop obeying its dependencies, a violation occurs, which can be resolved with the Violations window.
There are a few ways to connect tasks:
- Select two or more tasks in the outline view or the Gantt chart, then click the Connection toolbar button to create a Finish to Start dependency between each subsequent task.
- Select two or more tasks in the task outline or the Gantt chart, then click the triangle in the corner of the Connection button—or click and hold the Connection button—to summon a menu of dependency types; choose the type you want.
- Put the mouse pointer over a task bar in the Gantt chart, then drag one of the arrows that appears at the beginning or end of the bar. It becomes a dependency line, which you can then drop onto the start or end of another task, group, or milestone. Whether you drag from the start or the end of the prerequisite task, and whether you drop onto the start or end of the dependent task, determines the type of dependency.
-
In the Dependents or Prerequisites columns of a task, type a dependency or prerequisite code. These codes combine the IDs of the tasks involved and the type of dependency like so:
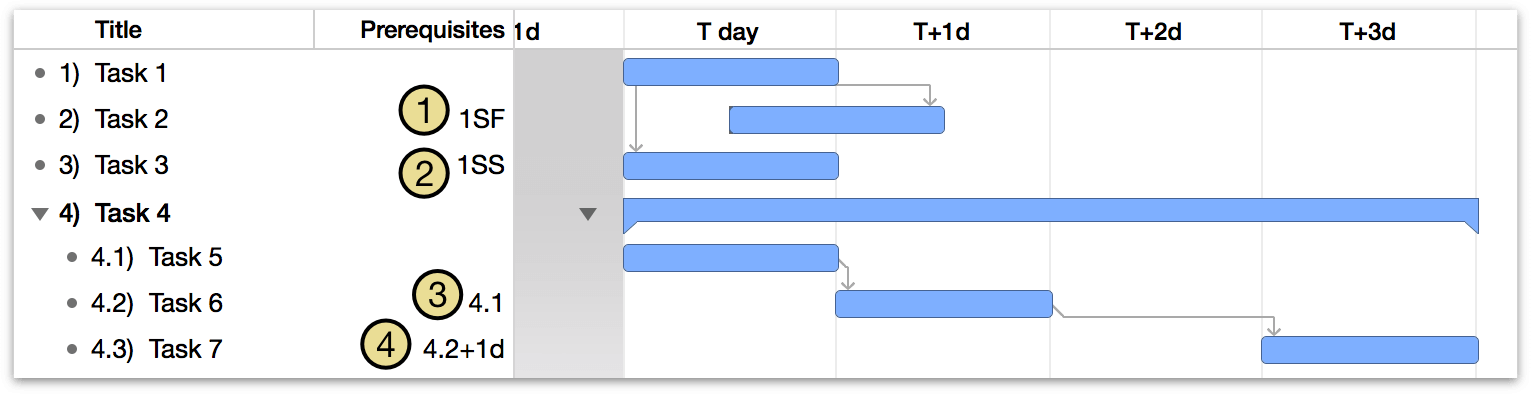
- A Start to Finish dependency from task ID 1
- A Start to Start dependency from task ID 1
- A Finish to Start dependency from task ID 4.1. (FS is the most common type of dependency, so a task ID by itself without any letters is assumed to be FS.)
- A Finish to Start dependency from task ID 4.2, with a lead time of 1 day.
Types of Dependencies
OmniPlan supports four types of dependencies that describe the ways in which tasks relate to one another.
- Finish→Start
- The first task must end before the second task can start; the tasks must not overlap except at the instant the first one ends. This is the most common type of dependency, and the kind that you get when you connect two selected tasks by clicking the Connection button in the toolbar.
- Finish→Finish
- When the first task ends, then the second one can end; the tasks may overlap.
- Start→Start
- Once the first task has started, the second one can start; the tasks may overlap.
- Start→Finish
- Once the first task starts, the second one can finish; the tasks must overlap at least at the instant the first one starts.
Showing Scheduling Influences
If you find yourself wondering if anything else is relying on a task’s completion before it can begin, or why a certain task hasn’t started yet despite yesterday’s start date (perhaps the two are related!), select the task and choose View ▸ Show Scheduling Influences (Option-Command-?) to reveal all of the reasons for a task’s current scheduling.

A popover menu appears attached to the task in the Gantt chart that includes a list of the factors affecting the item’s scheduling. Clicking the arrow to the right of a scheduling influence in the popover takes you directly to the task, group, or other constraining factor so you can deal with it as necessary.
Creating Hammock Tasks
A hammock task is one in which the duration is dependent on both when the previous task ends, and the next task starts. This type of task is useful when facing a hard deadline and deciding what can be compressed if the project is running behind schedule, or if external factors influence when parts of the project must happen.
For example, if you were to prepare a written document, the time allotted for editing would vary depending on the completion of the document and its due date.
Using that scenario, let’s create an example hammock task. Our starting point is a set of two tasks and a milestone connected by Finish→Start dependencies: Write Newsletter, Edit Newsletter, and Publish Newsletter.
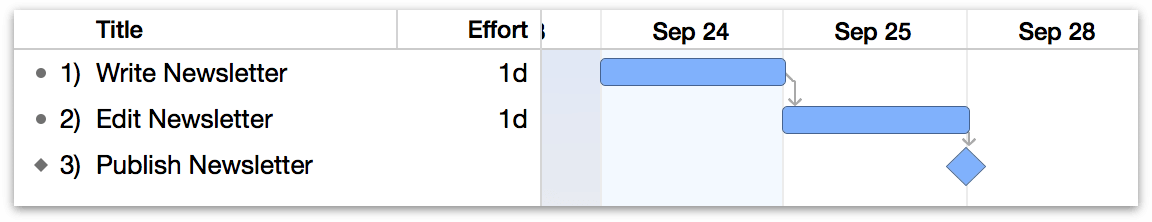
We want to publish the newsletter on October 1st, so we set the Start No Earlier Than date of the milestone to reflect that.
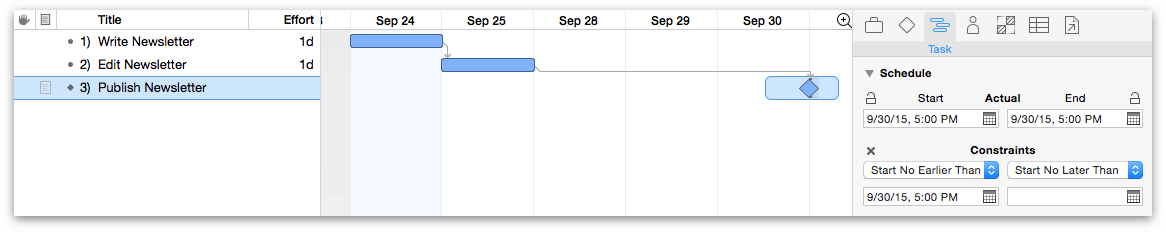
Next, we change the Finish ▸ Start dependency from Edit to Publish to one indicating that editing finishes when publishing starts. Because Publish Newsletter is a milestone rather than a task its start and end dates are equivalent, so this dependency is Finish ▸ Finish (if publishing were a task, this would be a Start ▸ Finish dependency instead).
Note that because this dependency is directional, for OmniPlan to understand the relationship you’ll want to select the milestone and drag a dependency arrow to the Edit task rather than choosing the dependency type from the Dependencies section of the Task inspector.
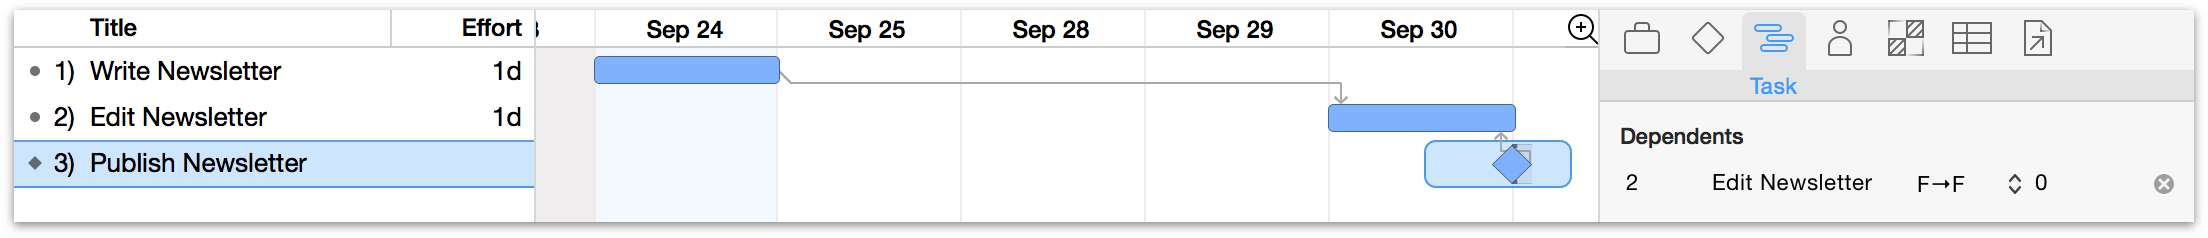
With our dependencies set up properly, the final step in setting up our hammock task is to select it and choose Hammock as the task type from the Task inspector.
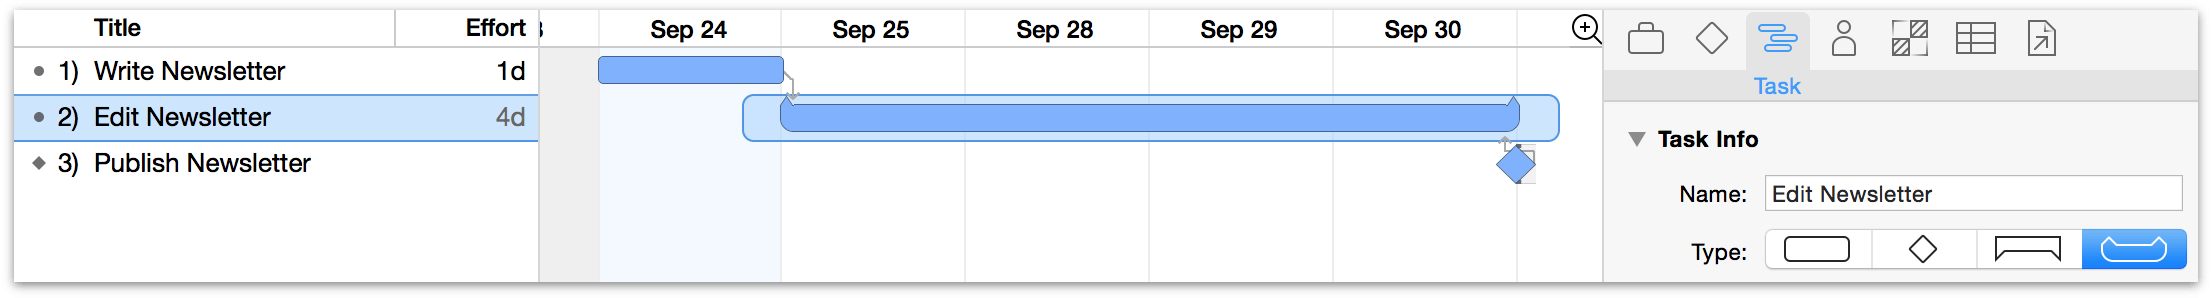
Now, if writing the newsletter takes longer than planned, the duration of the editing task will diminish to respect the needs of the tasks on either side.
Splitting Tasks
Whether because a key collaborator is on vacation or another part of the project has taken priority, suspending work on a particular task can be very helpful. When you want a resource or team member to devote time to something other than the task they’re currently assigned to, splitting the task into parts around the “time out” period is an ideal solution.
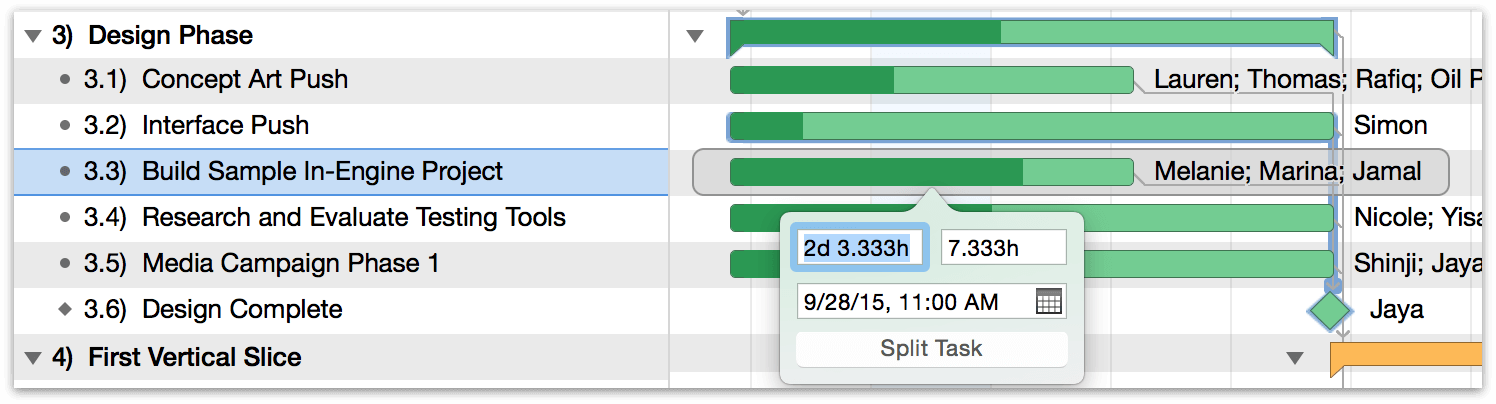
To split a task:
- Select the task in the outline.
- Choose Structure ▸ Split Task (Option-Command-S).
- In the popover, adjust the duration of both sides of the split, choose the date and time you want the task to resume after the break, and click the Split Task button; the task is split for later completion.
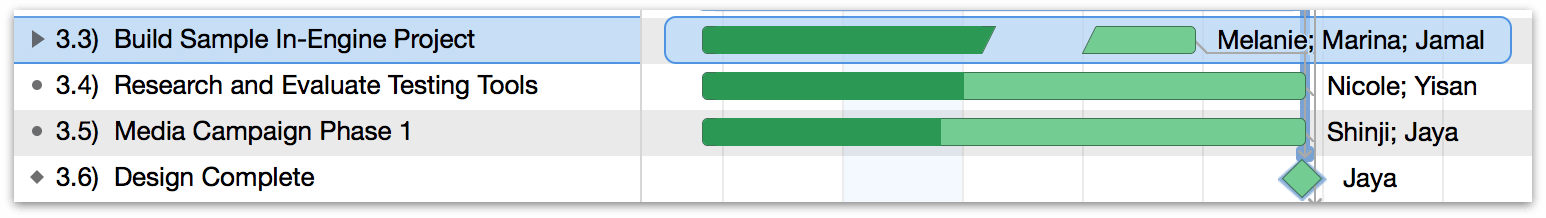
To rejoin a split task, click on one of its parts and drag it to the other. The two segments will merge back into a single task on the Gantt chart.
After splitting a task it’s always a good idea to level to be sure the split is the most efficient way to manage the task at hand given the project’s available resources and time constraints.
A split task may mysteriously re-merge after leveling. If this isn’t what you want, make sure that Allow Splitting is checked in the leveling dialog.
Grouping Tasks
There are a few ways to approach grouping, depending on whether you’re starting with an existing set of items you want to add to a group, converting an existing item to a group, or creating a brand new group task.
-
To convert a task to a group with new child tasks inside it:
- Select the item you want to grant sub-tasks.
- Choose Structure ▸ Add ▸ Add Child Task (Command-}).
- The selected item becomes a group with one child task.
- Add more tasks to the group by pressing Return.
-
To bring tasks into a group within a peer task above them in the outline:
- Select the items to be grouped.
- Choose Structure ▸ Indent (Command-]) or Tab, depending on your preference setting).
- The items become children of the item above them in the outline.
-
To bring tasks into a newly created group:
- Select the items to be grouped.
- Choose Structure ▸ Group (Command-Option-L).
- The selected items become children of a newly created group.
-
To create a new group with nothing inside it:
- Choose Structure ▸ Add ▸ Group.
- A new, empty group item is created.
- To add items inside the group, open it by clicking the disclosure triangle next to the group name (or its bar in the Gantt chart), and with the group selected, create new tasks as normal.
Characteristics of Task Groups
A task group determines most of its characteristics from the tasks it contains, rather than having characteristics of its own. A group’s characteristics can be viewed (and in some cases defined) in the Task inspector.
- Name — Of course, a task group has its own name.
- Type — A task group can contain tasks, milestones, and other groups, but its own type is always group. (An empty group has no effort or duration and can serve as a placeholder.)
- Effort — The effort of a group is the sum of the effort of all tasks it contains.
- Duration — The duration of a group is the amount of time between the beginning of its first task and the end of its last task, not the sum of the durations of all its tasks. If a group contains three one-hour tasks all happening at the same time, the group has a duration of one hour, not three hours.
- Scheduling — A group can have a specific start date, which can then affect the start dates of tasks inside it.
- Dependencies — A group can have dependencies just like a regular task.
- Resource Assignments — If you assign a resource to a task group, the resource gets assigned to all tasks in the group. The group itself can’t have any resources assigned.
Visual Planning in the Gantt Chart
Many attributes of tasks can be edited directly with the mouse in the Gantt chart. When you put your mouse pointer on a task bar, controls appear for manipulating the task.
Changing the Chart’s Scale
You can zoom the Gantt chart (and the resource timeline) in and out using the Magnifying Glass menu in the upper-right corner of the chart, or by clicking in the chart’s header area and dragging left or right, as if you were resizing a column.
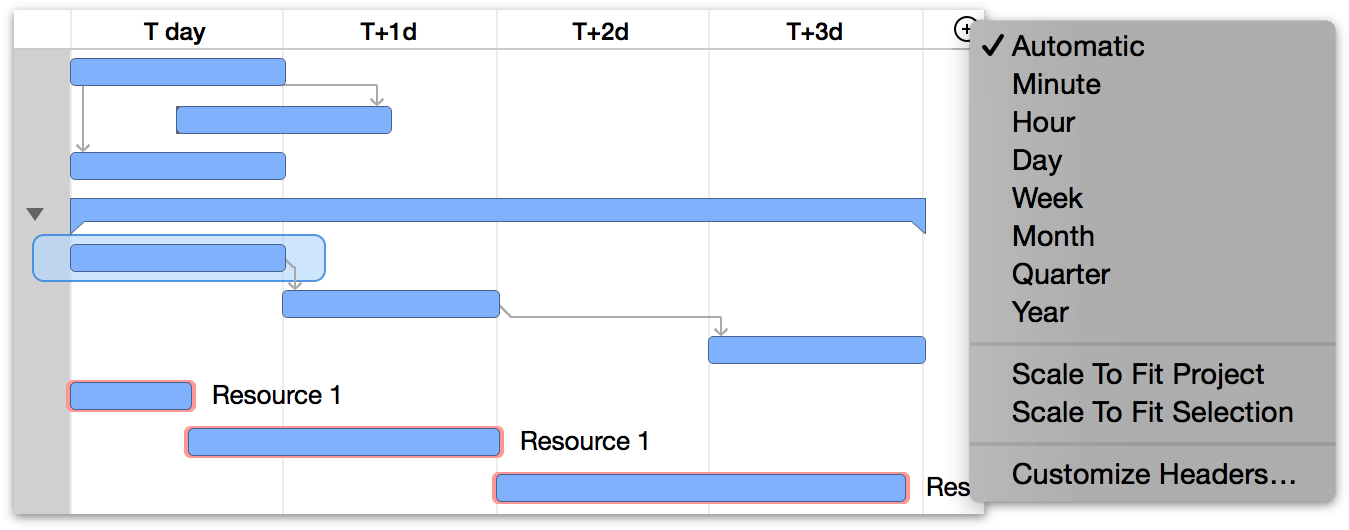
Changing the Duration of a Task
To change the duration of a task:
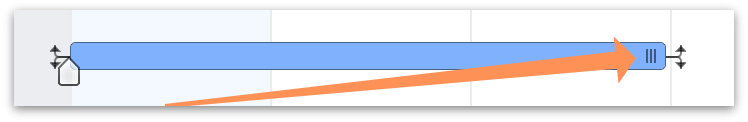
- Grab the traction pad at the right end of a task bar.
- Drag the end of the bar left or right to change the task’s duration. You can hold Shift while dragging to snap to round values.
Adjusting Task Completion
To adjust how much of a task has been completed:
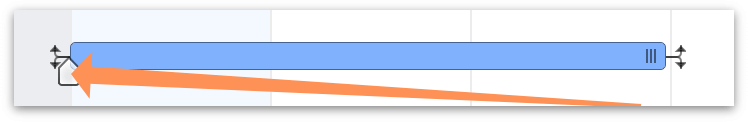
- Click the white, house-shaped handle on a task bar.
- Drag the handle to update the completion.
Drawing Dependency Lines
To draw dependency lines between one task and another:
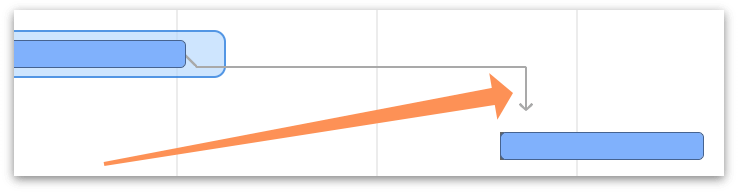
- Select a task bar in the Gantt chart to see its dependency arrows.
- Drag a dependency arrow from the beginning or end of one task.
- Drop the arrow onto the beginning or end of another task to create a dependency.
Drawing Constraints on Tasks
To draw constraints on tasks:
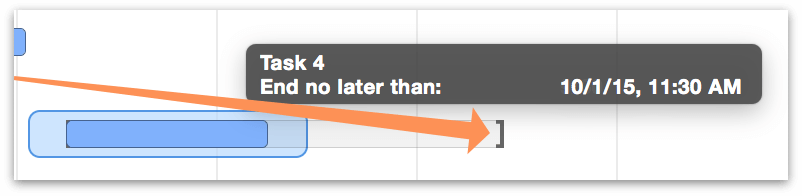
- Hold Shift and drag from the beginning or end of a task to create a start or end constraint.
- Hold Shift and double-click an existing constraint to remove it.
A start no earlier than constraint can also be set by selecting a task and dragging it along the timeline.
Locking Start or End Dates
To anchor a start or end date to a fixed point in time:
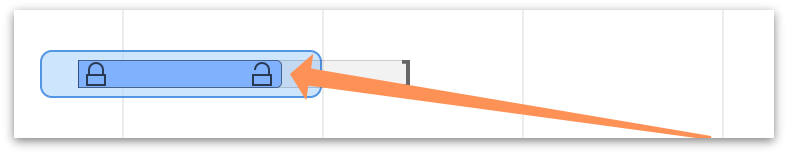
- Command-click a task’s start or end to lock or unlock it.
Coloring Off Hours
To have the Gantt chart display an alternate background color for days when work is usually not occurring, choose View ▸ Non-Working Time and pick the submenu item applicable to your situation: None, Holidays, Weekends, or All.
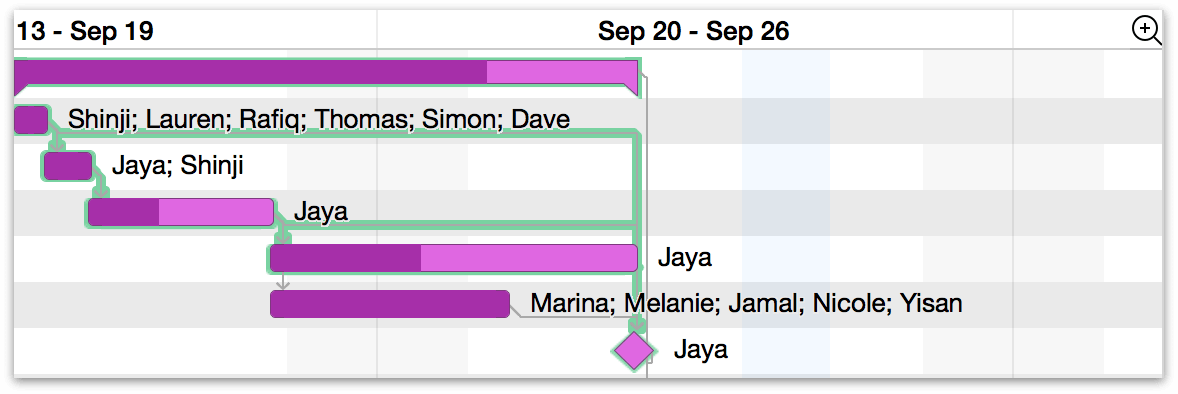
Highlighting off hours in this way gives better feel for when work is actually getting done, and helps explain why some bars in the Gantt chart look particularly long when the length of the tasks is not.
You can pick a color for the appearance of off hours in Styles View, and you can customize the hours themselves in Calendar View.
View Options in Task View
The view options in Task View have two primary roles. The first to control which optional columns are displayed in the task outline, and the second is to control which of those column values are applied as labels on either side (and on top of) bars in the Gantt chart.
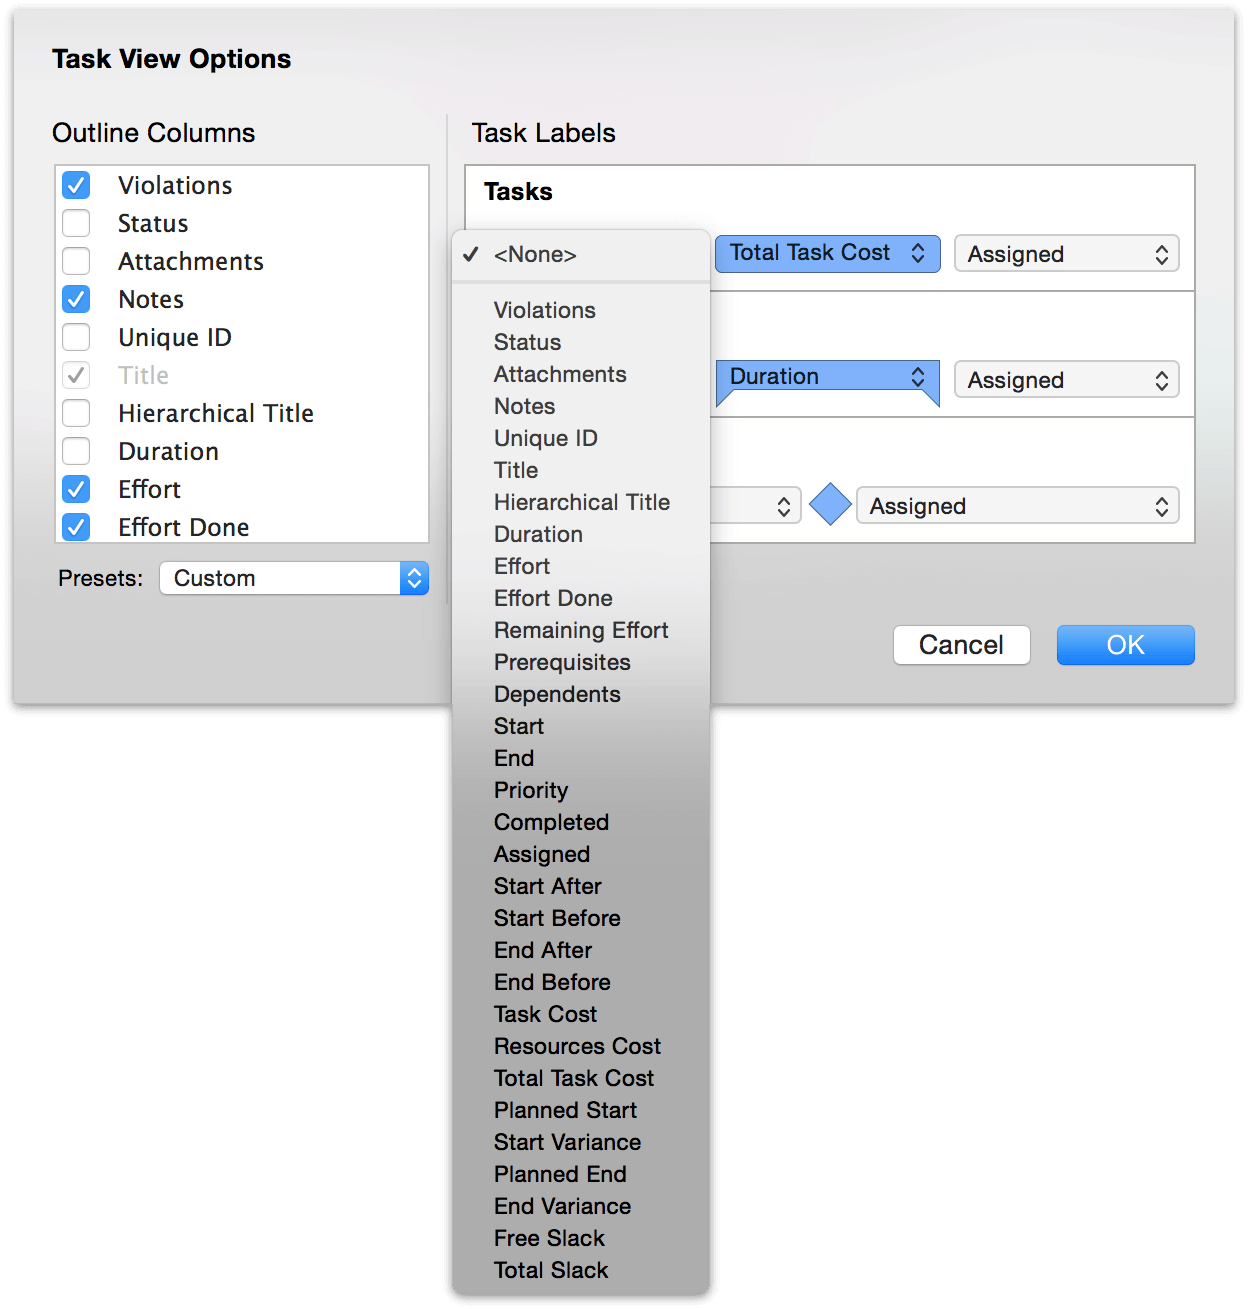
Choose View ▸ View Options (Command-J) to open view options, where you’ll find two sections: the left side that governs outline columns, and the right side with dropdown menus for label locations relative to tasks, groups, and milestones.
To quickly add optional columns to your outline, Control-click on the existing column header. The full list of available columns will appear as a contextual menu, where you can choose the ones you’d like to show or hide.
Data in the optional columns corresponds to tasks on the same row in the Gantt chart. Some of the values in the columns (such as Task Cost) can be edited directly in the outline; others (such as Total Cost) are calculated automatically. Generally, values you can edit in the outline correspond to editable fields in the Task and Resource inspectors.
Use the arrow keys, or Tab and Shift-Tab (depending the options you’ve chosen in OmniPlan’s preferences), to move between cells.
Drag column titles left and right to rearrange the columns.
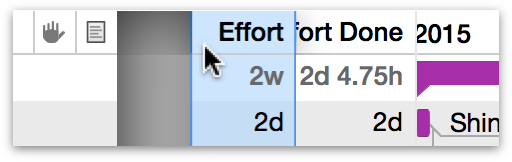
You can sort the selected items in the outline, or all items (if nothing is selected), by using the Sort commands in the Structure menu.
If you’d like to add custom columns to your task outline (or if you’re seeing unexpected entries in the list), note that keys you set up for tasks using the Custom Data inspector become available as columns in the outline.
The following list describes the more complex optional columns that can be displayed in the outline of Task View, or as data fields attached to items in the Gantt chart.
- Violations
- This column displays an icon for each task that has a violation. You can click the icon to summon the Violations window and see what the problem is.
- Status
-
This column shows alarm clock icons for tasks that are incomplete and due in the next few days, or in the past. Note that these icons won’t appear if your project has an undetermined start date in the Project Info section of the Project inspector. Each color of clock has a meaning:
- Almost due (green): this task is incomplete and due in the next 3 work days.
- Due (yellow): this task is incomplete and due in the next work day.
- Past due (red): this task is incomplete and past due.
- Priority
-
You can manually set a priority on a task, to control the order in which tasks are leveled. Priority can be any integer, so you are welcome to decide on the range (1 to 3, 0 to 999, or whatever you like). During leveling, if two tasks are assigned to one resource at the same time, the task with higher priority (expressed as a larger positive number) gets to use the resource first.
When assigning priorities (regardless of the range chosen), the highest priority task is the one with the largest numerical integer assigned. Priority descends from the largest integer, and negative integers are of lower priority than positive.
- Assigned
- This column lists the resources that are assigned to the task.
- Attachments
- You can click the paper clip icon Attachment icon in the selected row to see a menu of the item’s attachments, or to link to a file if there isn’t one linked yet. Rows with links to files show a paper clip icon even when they are deselected.
- Notes
- Store extra text about an item with this column. To edit the selected item’s note, press Command-’ or click the Note icon that appears in the column.
- Once an item has a note, you can move in and out of the note field by pressing Command-’ (which hides the note after you stop editing it). Rows with notes show a note icon even when they are deselected.
- The font style of notes can be set up in Styles View.
- Unique ID
- The unique ID is a number assigned to each task to identify it unambiguously, even if its name or position in the outline changes. A unique ID won’t ever change, and each new task or resource you create gets a new unique ID number. These numbers are useful for matching up items when you are importing and exporting projects between OmniPlan and other applications.
- Free Slack, Total Slack
- These columns display information derived from how the project is set up. Slack is the amount of time a task can be delayed before it must be completed for a subsequent task to begin, or for the project to be completed on time; free slack refers to slack between individual tasks and their subsequent tasks, while total slack refers to the time before an individual task would have an effect on the duration of the project as a whole.
Earned Value Analysis (PRO)
OmniPlan 3 Pro offers several new custom column types useful for tracking and managing the budget and progress of your project. Taken together, they represent a full implementation of the Earned Value Analysis project management technique (also known as earned value management, or EVM). We’ll be referring to it as earned value analysis (or EVA) throughout OmniPlan and throughout this manual.
Since the value of EVA lies in the comparison of the actual state of your project with its initial plan, the first thing we need is a baseline. If you don’t have one set up yet, you’ll want to do that now. If you’d like to simulate a project state earlier or later in the project, choose Project ▸ Set Current Editing Date and enter the desired date.
If you compare with a baseline set at the beginning of your project, many EVA column values won’t appear. This is because you’d essentially be dividing by zero (the current actual cost at that baseline) to generate the cost performance index, and earned value is only relevant in the context of other factors affecting the project in progress. For a preview of the planned costs of your project, try using the Total Task Cost column instead.
With a baseline set, we can start building out the attributes of tasks and resources that EVA requires to deliver meaningful results. The original and derived values represented by the suite of EVA columns can be dizzying to take in all at once, so let’s break it down into some smaller pieces.
We’ll begin by enabling some familiar, pre-existing columns, and making sure they’re populated with relevant data.
In Task View:
- Effort — Any task you create is going to require some amount of effort to complete, so this one’s easy.
- Effort Done — EVA tracks progress compared to the baseline, so updating the amount of work done on tasks is an important component of calculating value.
In Resource View:
- Cost/Hour or Cost/Use — Tracking how much money is being spent on effort done is another key component of EVA. If your workers are salaried, you’ll want to compute their wage as an hourly value for use here.
With these set up, we can begin putting the EVA columns to use. This first group of columns tells us about the amount of money we’ve spent on tasks to this point in the project, and compares that with our initial budget.
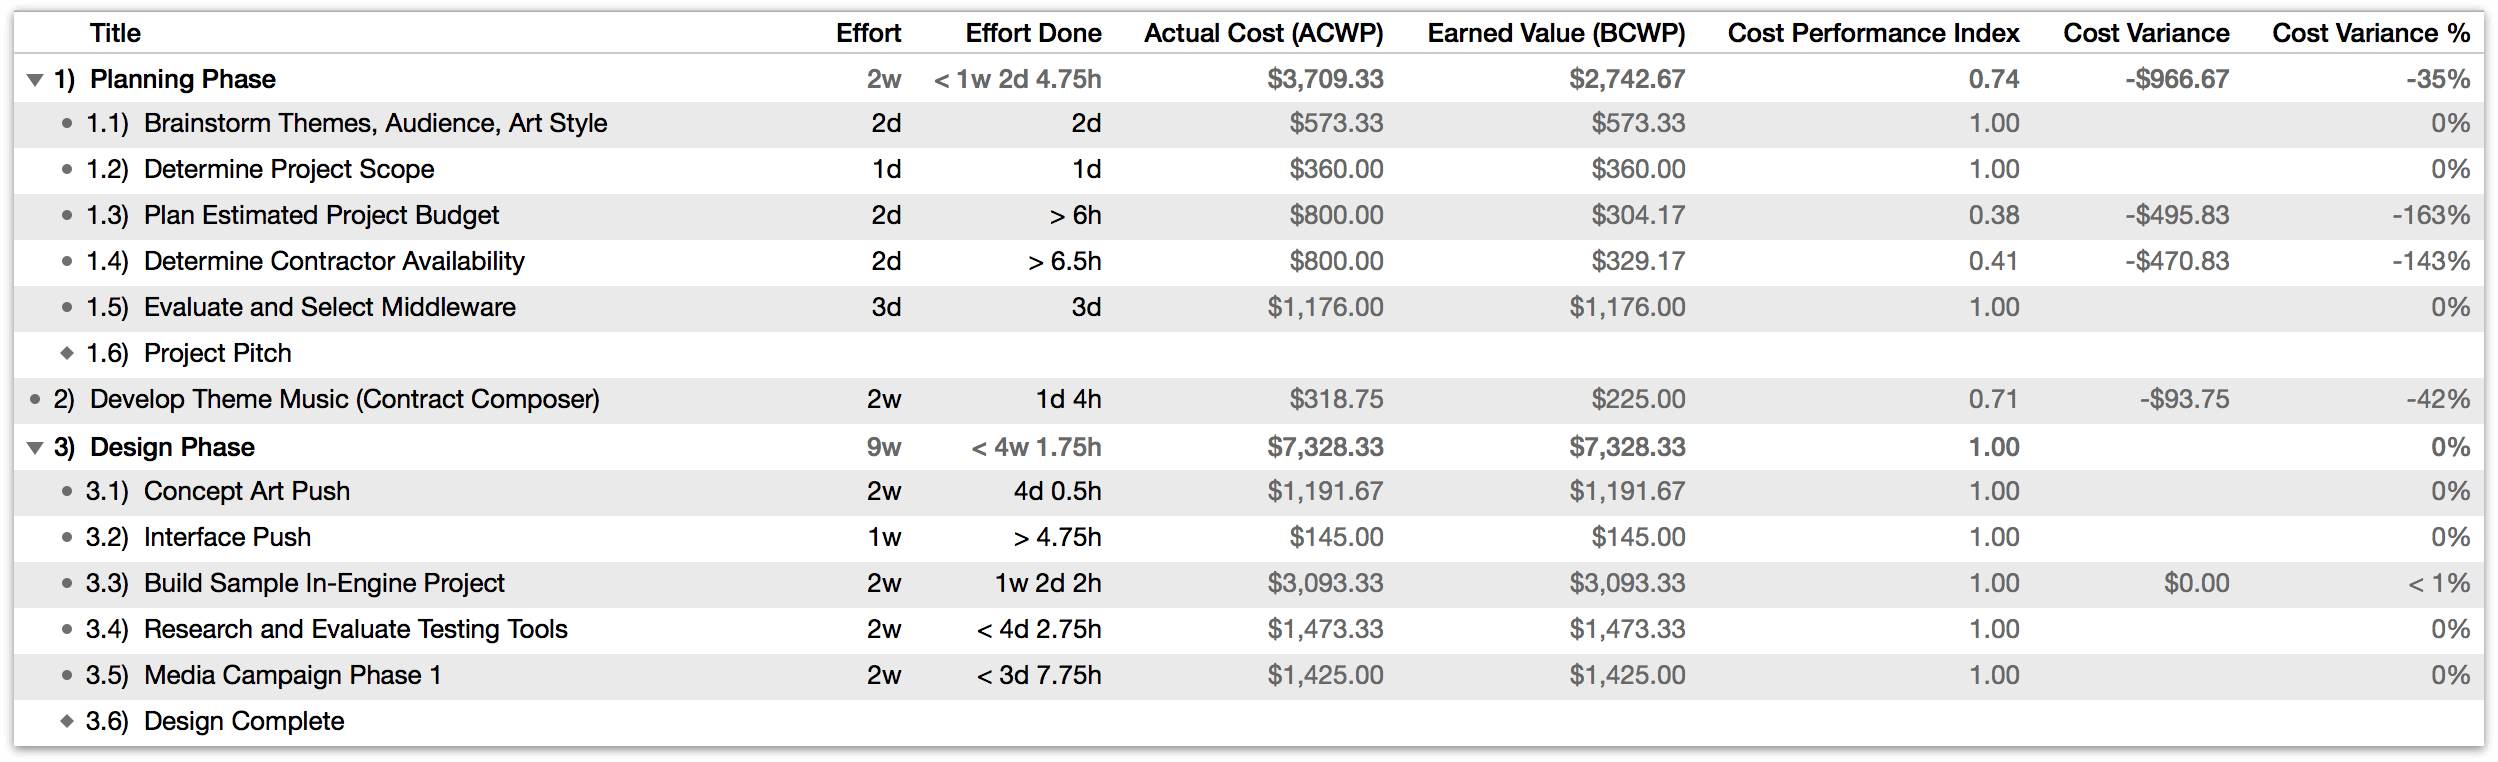
- Actual Cost (ACWP)
- This column is pretty straightforward; it’s the actual cost of work performed up to the current date. In OmniPlan terms, this represents the amount of effort completed by resources assigned to a task, multiplied by their costs. If two 8-hour days of effort are finished and a resource is contributing at 100% units and efficiency at a Cost/Hour of $50, they’ll contribute $800 to the actual cost.
- Earned Value (BCWP)
- The earned value, or budgeted cost of work performed, is another pretty simple calculation that represents the planned budget for the amount of work done on the project at this point (“this point” being the baseline used for analysis). This value is determined at the start of the project by effort assignments and resource costs.
- Cost Performance Index (CPI)
- The Cost Performance Index is reached by dividing the task’s earned value by its actual cost. This is a handy way to see, at a glance, whether the task is over- or under-budget: values higher than 1 are under budget, values lower than one are over budget, and 1 exactly means the project’s budget is right on track.
- Cost Variance and Cost Variance %
- Cost Variance is the concrete number that gives us the good (or bad) news about how much a task is under or over budget. The Cost Variance column is expressed as a currency amount relative to the earned value, and the Cost Variance % column is (as you’d expect) expressed as a percentage of the earned value. Notably, any time the planned and actual budgets agree (the cost performance index is at 1), these columns will be empty.
The next group of EVA columns describes the status of the project relative to the planned schedule.
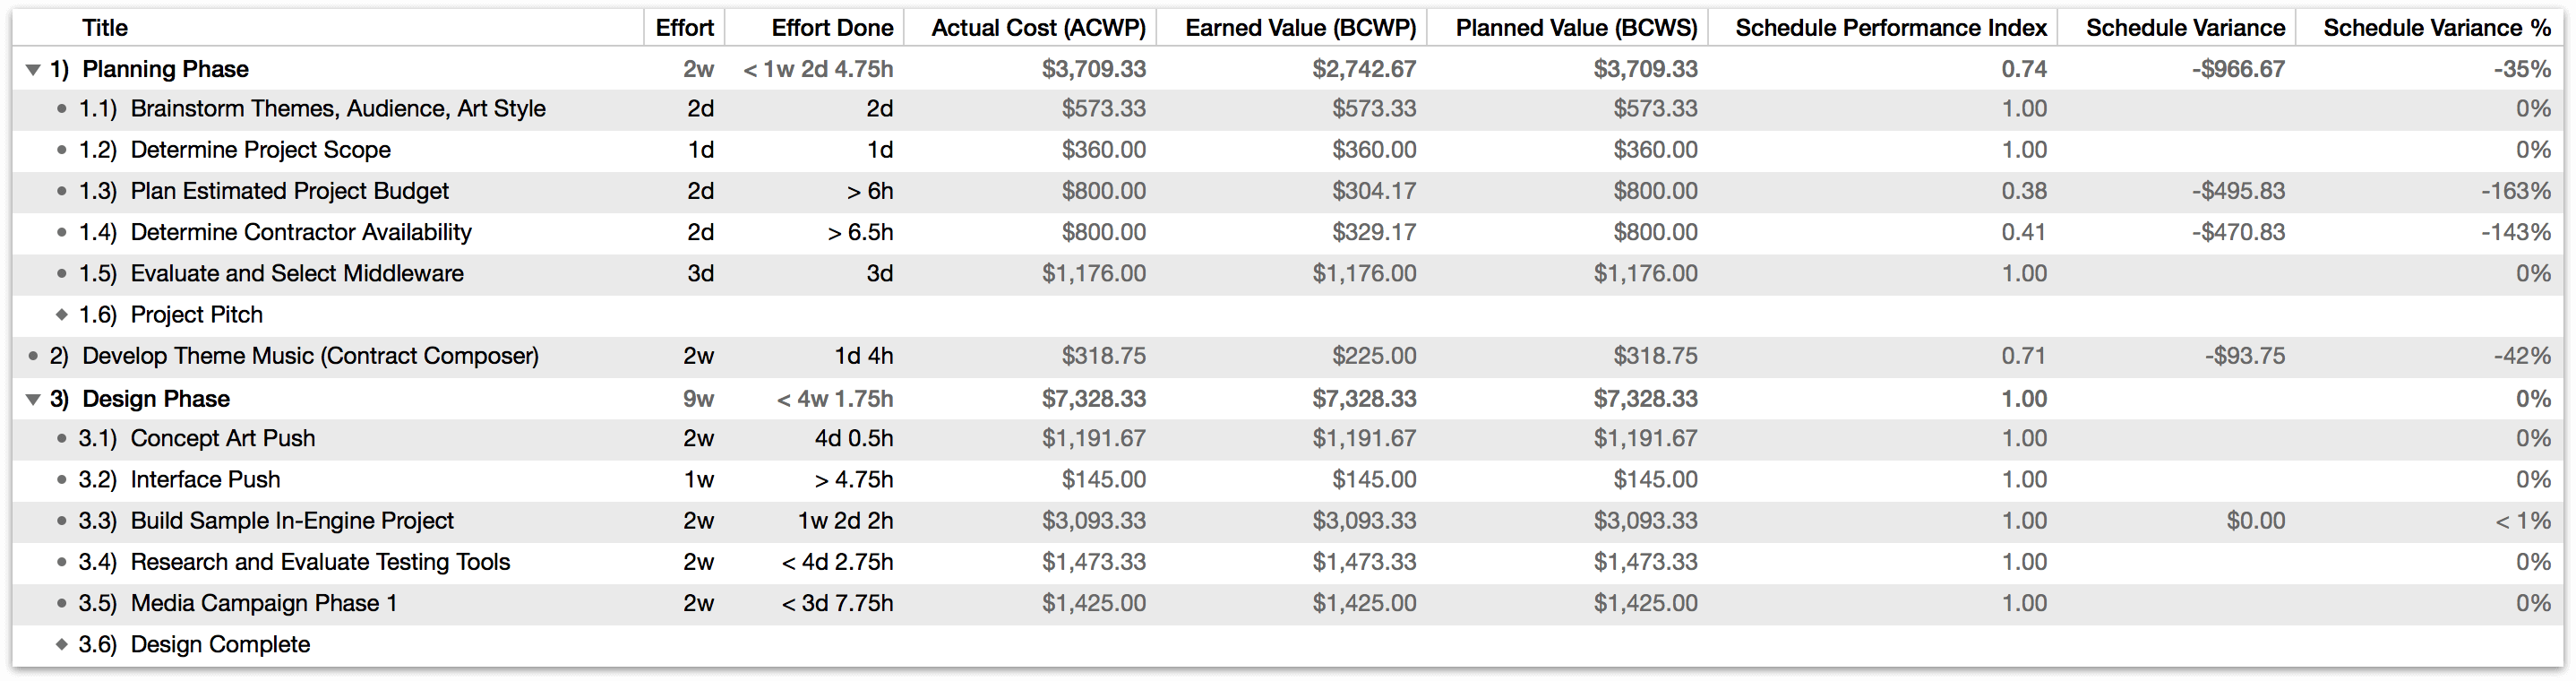
- Planned Value (BCWS)
- Planned Value, or Budgeted Cost of Work Scheduled, lists the expected cost of work-to-date as planned in the project’s initial schedule. This is derived from the planned costs of tasks and resources, along with the baseline and editing date chosen.
- Schedule Performance Index (SPI)
- The Schedule Performance Index is derived by dividing earned value by the planned value. Like the cost performance index, it’s expressed as a number greater or less than one; higher values represent being ahead of schedule, while values less than one represent being behind schedule.
- Schedule Variance and Schedule Variance %
- Schedule Variance is the value that tells us in concrete terms how far we are ahead of — or behind — schedule. It subtracts planned value from earned value, giving us an amount in currency that represents the difference between how much we should have been paying for work-to-date, versus how much we’ve actually paid. Schedule Variance % represents this same amount as a percentage.
The final group of EVA columns is related to forecasting the budget of tasks at their completion.
- Estimate at Completion (EAC)
- This value represents the estimated actual final cost of the task, as work progresses. Before the start of the project, EAC is equal to the budget for the task (Budgeted at Completion, below). As the project progresses, EAC and BAC may diverge.
- Budgeted at Completion (BAC)
- Budgeted at Completion represents the initial budgeted cost of all work on the task. If work gets behind schedule or there are cost overruns on materials, the actual cost (and therefore the estimated cost at completion) will rise above the BAC cost.
- Variance at Completion (VAC)
- This column represents the difference between the estimated actual (final) cost of completion and the budgeted (initial) cost of completion of the task. Expressed as a currency amount, a negative VAC denotes a cost overrun, while a positive VAC represents a budget surplus.
- To Complete Performance Index (TCPI)
- The To Complete Performance Index is a bit unique among the EVA columns in OmniPlan, in that it tells you about the state of your project’s budget and schedule by way of a recommendation. The TCPI represents the cost performance index (CPI, explained above) that you need to maintain for the task, from your current editing date, in order to be on budget. A value other than 1 describes a recommended course correction: higher requires some belt-tightening, while lower indicates that there are funds to spare.
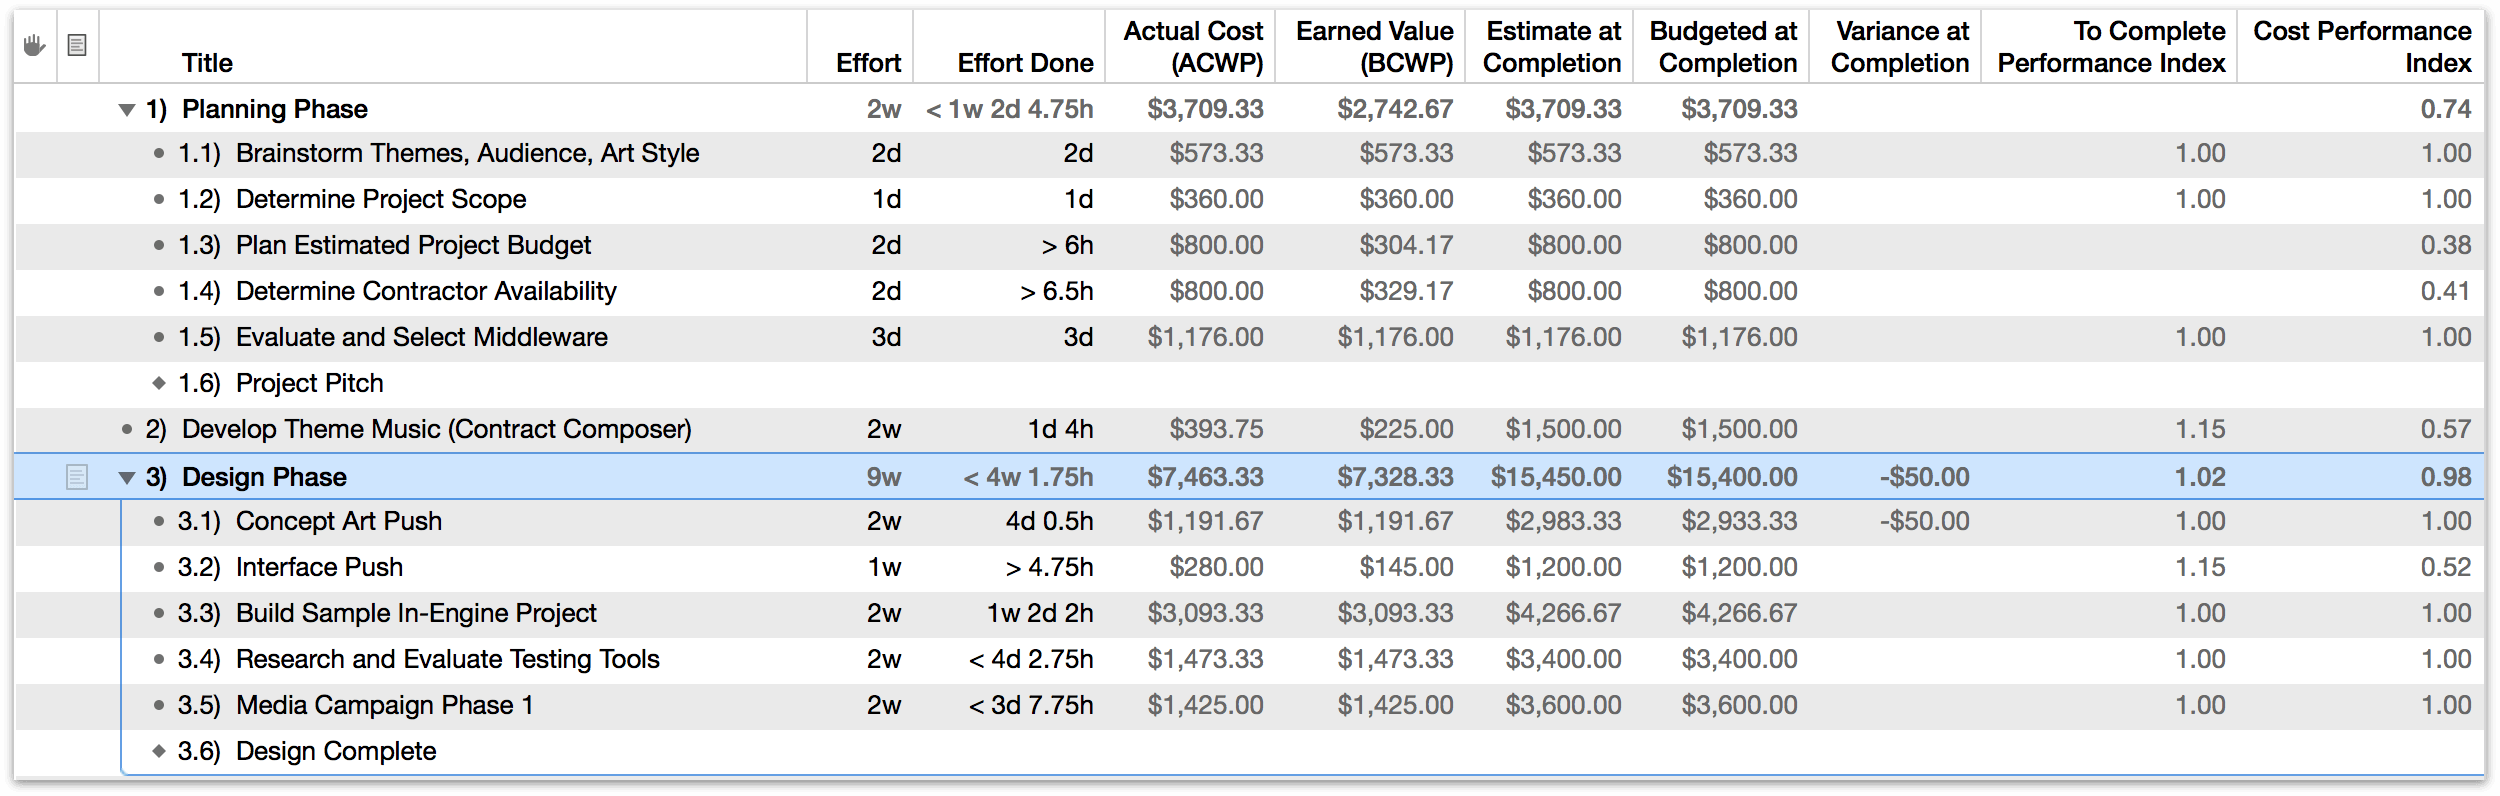
As another way to think about EVA, consider the current editing date and the baseline as the x and y axes of a chart whose parameters you can use to set up simulated scenarios for your project. The baseline provides a y-axis time anchor for your project’s state of affairs, and the current editing date is a time travel device along the calendar’s x-axis that lets you consider that snapshot as if the project’s progress to date had happened earlier, or all progress froze and the project stood still until some point in the future.
Filtering the Task Outline
When you want to focus on a specific aspect of your project, you can view a subset of its tasks by creating filters for specific criteria. Possible filters include focusing on tasks that were completed in the past week, tasks that are behind the baseline target date by greater than three days, or as in the example below, tasks that are less than 50% complete.
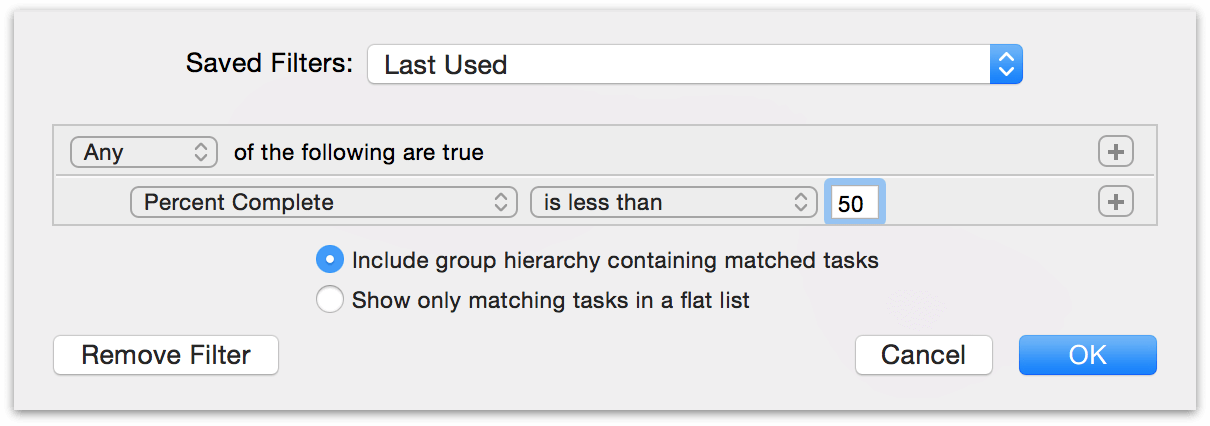
Choose View ▸ Filter Tasks (Option-Command-F), or click the Filter button in the toolbar. A sheet appears for setting up your filtering criteria. You can add as many criteria as you like by clicking the plus icon on the right side of the entry line, and filter the criteria themselves by Option-clicking on the add button to create nested criteria within the filter hierarchy. When your criteria are set up the way you want them, click the Save Filter dropdown menu to save the current filter or restore a previously saved filter. (You can also use the View ▸ Restore Saved Filter menu item.)
When your filter is set, any tasks which match your criteria remain in the outline, while the rest of the project is hidden away. You can work with the project normally while it is filtered, but you can only edit the visible tasks. While your filter is in use the Filter Bar appears, providing options to refresh, edit, or remove the filter and showing the number of tasks hidden.
Any tasks created while a filter is in place will not have the filter applied to them by default, so they will appear in the task outline (regardless of whether the filter would hide or show them) until the filter is refreshed or reapplied.
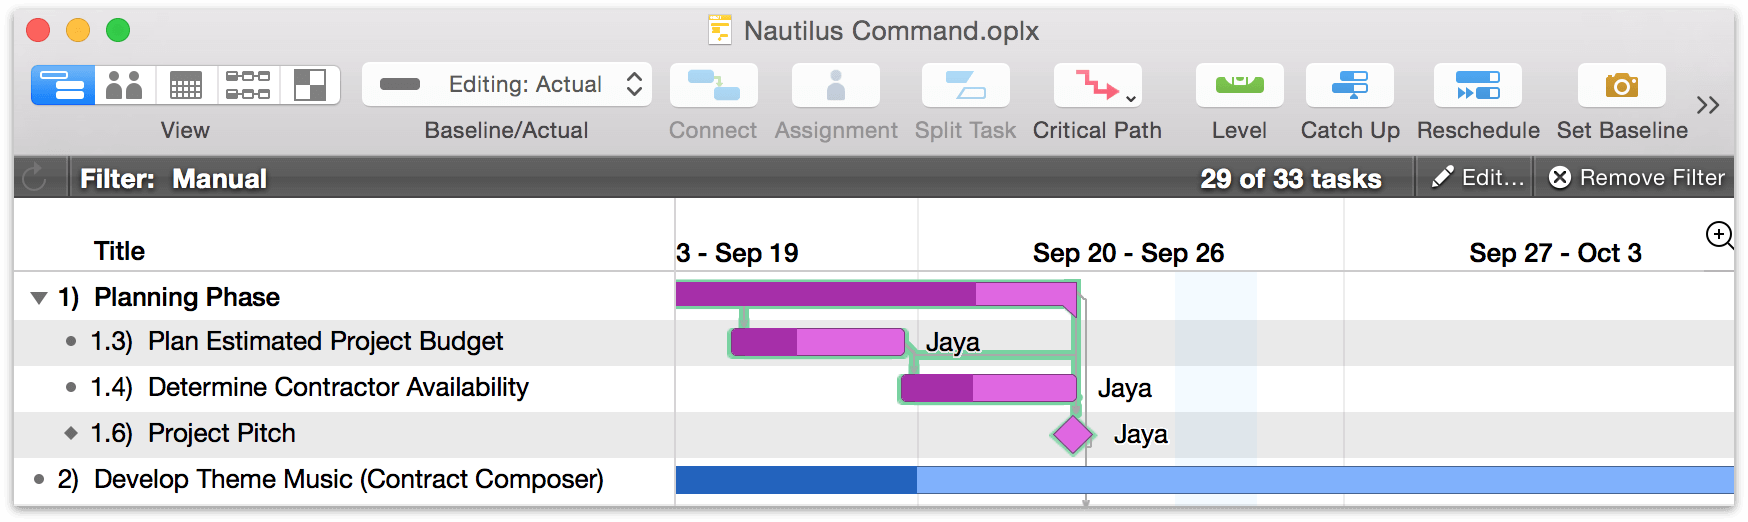
If you export or print a project while a filter is on, only the visible tasks are included in the exported file.
When you’re done, choose View ▸ Remove Filter or click the toolbar button again; all of your tasks reappear, no worse for the wear.
Filters are not included when exporting from OmniPlan 3 to the older 1.x version of the OmniPlan file format.
Chapter 106
Working in Resource View
Resources are the lifeblood of any project, without which an idea will never reach fruition. Effective management of personnel, equipment, and raw materials is key to bringing your project to a successful conclusion, and OmniPlan provides the tools you need to do just that.
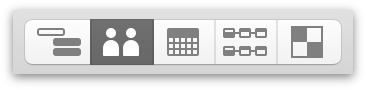
In OmniPlan, resource management is primarily accomplished in Resource View (the second button in the toolbar’s view switcher). This chapter describes the functions and features of the view; the Task and Resource inspectors also contribute to resource organization.
Resource Types
An understanding of the various resource types available in OminPlan is useful when beginning work in Resource View.
Staff 
The most important resources on a project are likely the people responsible for its execution. These are represented by Staff resources in OmniPlan. As unique humans, each staff member is represented by an email address that identifies them across all projects they may be a part of.
Equipment 
Tools, machinery, computers, and other hardware used to complete a project are represented as Equipment resources in OmniPlan. Equipment are similar to staff in many respects, but lack a notion of unique identity.
Material 
Ingredients, building supplies, food, or other components expended in the process of executing the project are represented as Material resources in OmniPlan. Unlike staff and equipment resources, materials dedicated to tasks are consumed upon use and are therefore represented by a number of units required.
Group 
A Group isn’t a resource itself. Instead, it’s a way to gather other resources under the same umbrella, indicating that (for example) a number of staff are part of the same team. When a group is assigned to a task, the task’s effort is split evenly between all of the resources in the group.
Creating and Deleting Resources
A key part of building out your project is describing the resources that make up the team you’re working with, and the equipment and materials they’ll be using to get the job done. The resource outline is a quick and efficient way to do this.
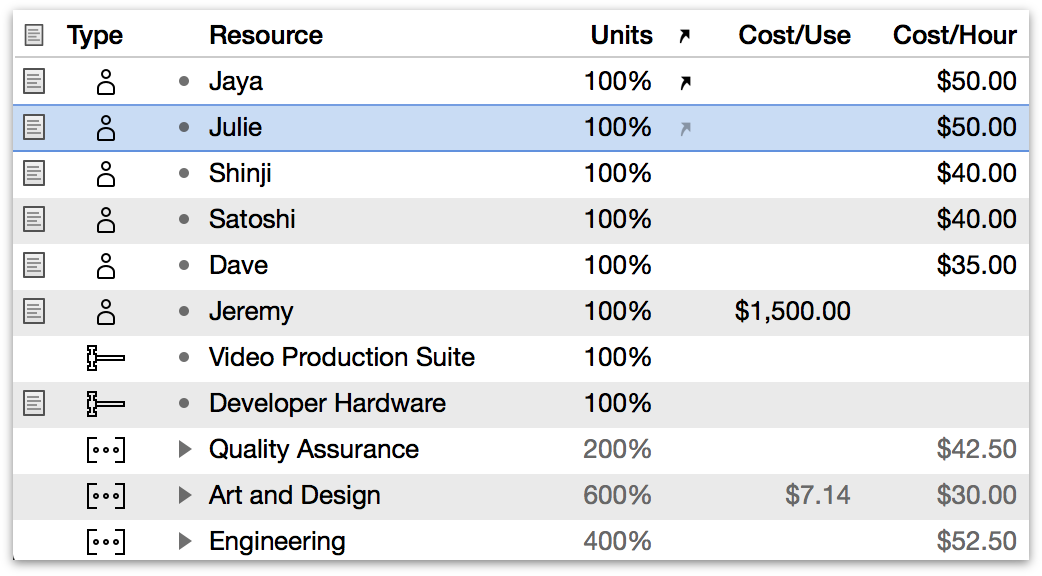
There are several ways to create new items in Resource View:
- Select an item in the resource outline and press Return (or Command-Return, depending on the Keyboard Options in OmniPlan’s General Preferences).
- Click the Add button in the toolbar above the outline.
- Drag a Contacts card into the resource outline to create a Staff resource that collects its contact information from the Contacts.
- Secondary-click and choose Add ▸ Resource from the contextual menu.
There are a few ways to delete a resource or resource group:
- Select a resource or group in the outline, then press the Delete key.
- Select the item, then click the Remove button in the toolbar above the outline.
- Select the item, then Control-click to reveal the contextual menu and choose Delete.
Assigning Resources to Tasks
Most tasks require some kind of resources in order to complete. Software development needs programmers, excavation needs heavy machinery, and construction needs lumber. Tracking which resources are assigned to which tasks helps you to see how long the tasks will take to complete, and when your resources are going to be busy or idle.
There are several ways to assign a resource to a task:
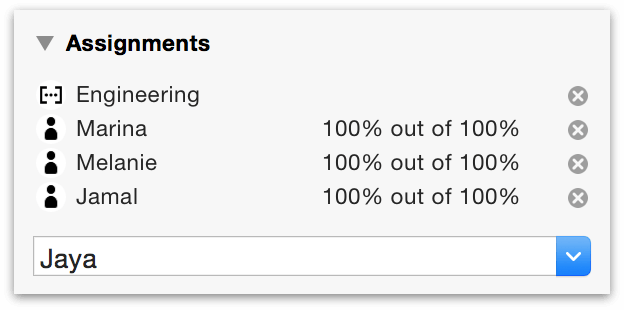
- Select the task in task view, open the Assignments section of the Task inspector, and check the resources you’d like to assign. You can then edit the amount to assign, if it’s different from the default amount. You can also see all of a resource’s assignments, and adjust their amounts or clear them, in the Assignments section of the Resource inspector.
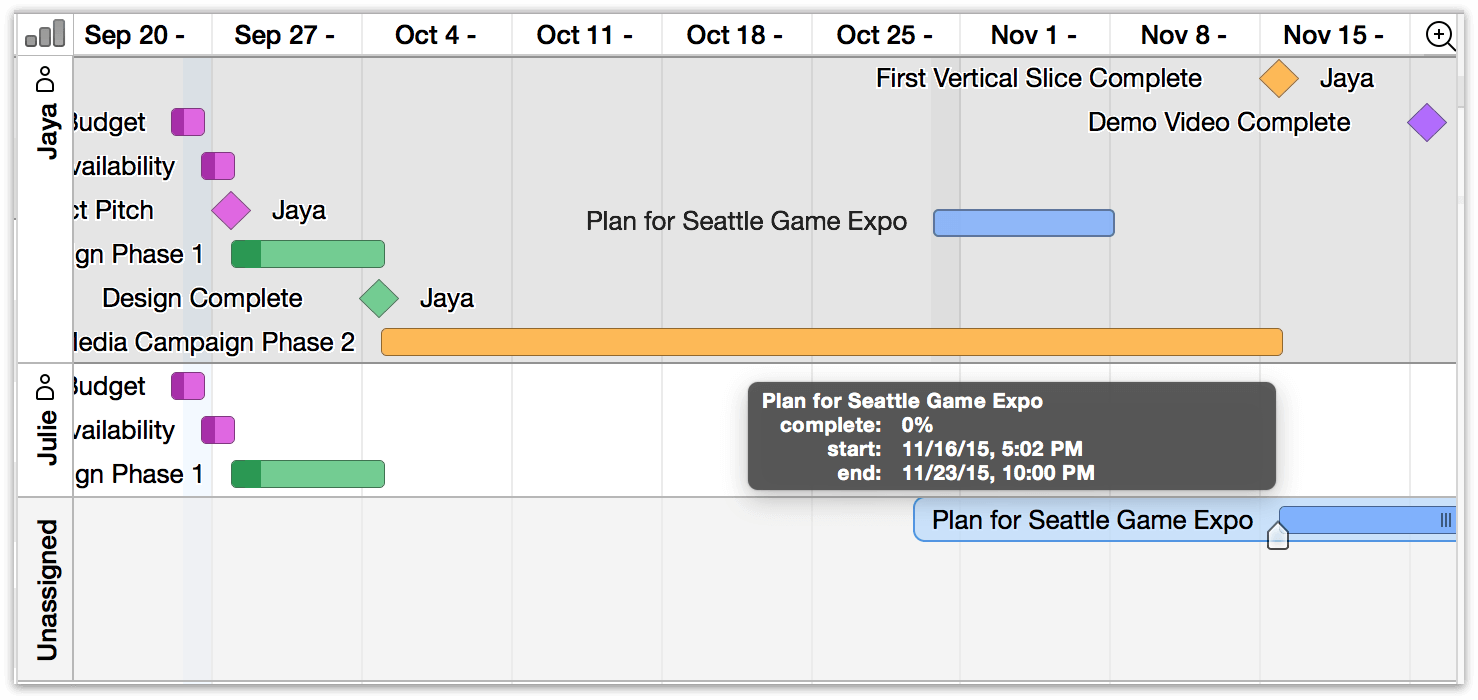
-
Drag tasks around between resources’ lanes and the Unassigned lane in the resource timeline chart. While dragging a task from one resource to another, you can hold the Option key to assign the task to the second resource without unassigning it from the first.
-
Drag a card from Apple Contacts to a task in the task view. If the project doesn’t yet have a resource associated with that card, a new one is added.
-
Edit the Assigned column of the task outline or the assigned resources area in the Gantt chart. The following are helpful hints:
- Enter resource names in the Assigned column to assign them to the task.
- You can also double-click resource lists in the Gantt chart and edit them directly there.
- Follow a staff resource with a percentage inside curly braces to assign an amount other than 100%.
- Follow a material or equipment resource name with a number in curly braces to assign an amount other than 1 unit.
- Separate multiple resource names with semicolons.
Assigning Groups
If you assign a resource to a group of tasks, the resource is assigned to every task in the group. The group itself cannot have a resource assigned to it.
If you assign a group of resources to a task, OmniPlan provisionally labels the task as having the whole resource assigned. Then, when you level resources, one member of the group is chosen to work on that task. If that member becomes unavailable, leveling again assigns a different member.
Characteristics of Resource Groups
A resource group is just a way to organize several resources together, so it doesn’t have a lot of the same characteristics as an individual resource, like Efficiency and Cost.
-
Name — Of course, a resource group has its own name.
-
Email — You can assign an e-mail address to a group, in case you have a mailing list or some address which goes to all of the members in the group.
-
Type — A resource group can contain resources of any type (Staff, Equipment, or Material), but its own type is always Group.
-
Cost/Use, Cost/Hour, and Efficiency — These are shown as averages of the values of all members of the group. If you enter a new value, it is applied to all members of the group.
Tracking Assignments with the Timeline
When you want to manage your project from the point of view of the resources available, the timeline in Resource View will help you visualize and control your assets.
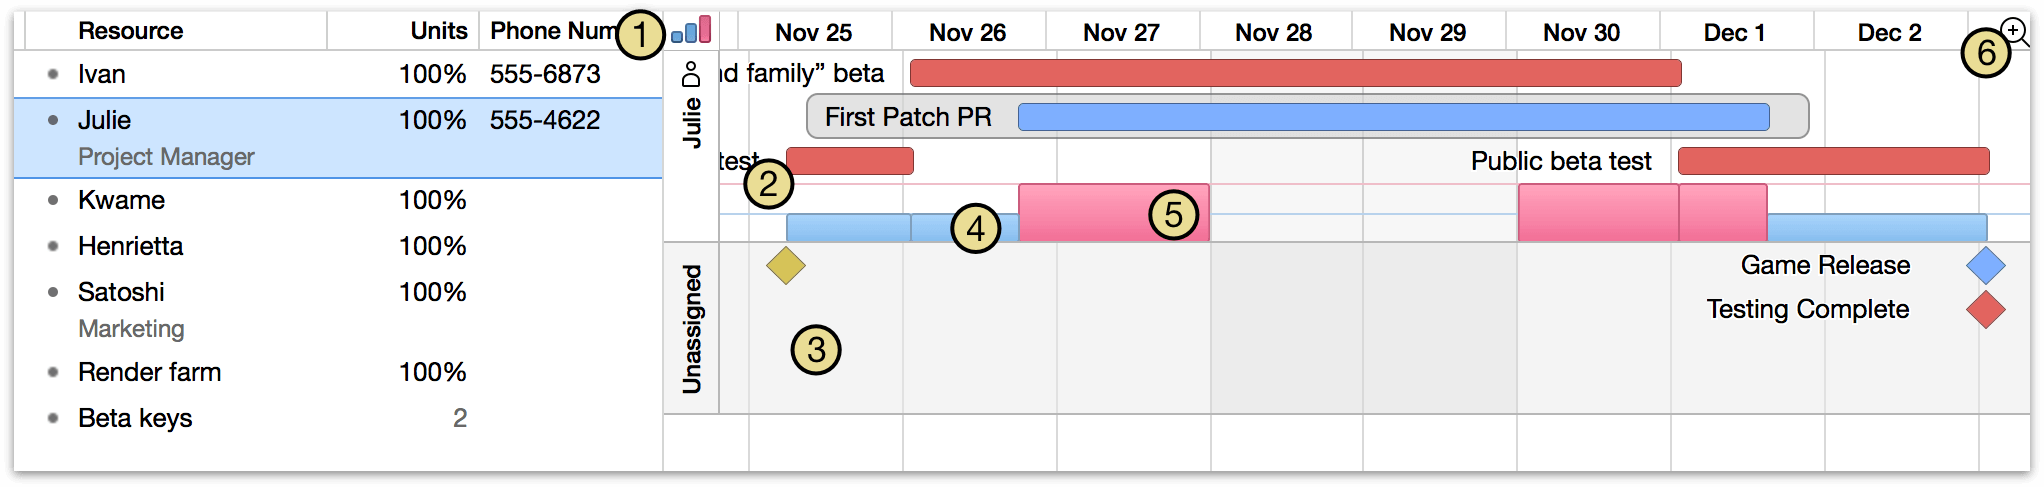
-
Click the bar graph button to show or hide the resource allocation graph beneath each resource’s timeline.
-
The chart shows a timeline of tasks for each resource you select in the outline. If you select no resources, the chart shows all resources’ timelines. If the resource is unavailable during some normal working hours, because it has customized working hours, the unavailable times have a background of the Off-hours color (gray by default) as it is set in Styles View.
-
Below the resources’ timelines, an Unassigned timeline shows the tasks which aren’t assigned to any resource. You can drag tasks between timelines to change their assignments.
-
A blue bar in the load graph represents time when the resource is being used at 100% of its available units.
-
A pink bar in the load graph represents time when the resource is being used at over 100% of its available units. You can level the project to clear up such problems.
-
You can zoom the timeline the same way you zoom the Gantt chart. Just choose a scale from this menu or drag in the header area.
Setting Resource Attributes
Use the Resource Inspector (or the corresponding columns in the resource outline) to set the properties of a resource such as its Type, Units, Efficiency, and Cost. It can be important to understand the use for each of these attributes; some additional detail is provided here.
- Units vs Efficiency
-
The amount of a staff member’s time dedicated to the project (relative to their full time schedule) is expressed by the resource’s Units value in the Resources inspector (or column in the resource outline). If Ivan’s time is split between two projects that he spends equal time on, his Units value for one project should be set to 50%, and 100% of his effort value applied to a task in this project equates to 50% of his total time on the clock.
A new trainee’s work might not be as productive as that of an experienced employee. In that case, the resource representing them should have its Efficiency value reduced while they are in training. This represents the amount of effort-per-time the team member contributes to tasks to which they are assigned; 100% of their effort accomplishes less than 100% of the effort of a fully trained worker.
As an illustration of the difference between Units and Efficiency, consider a resource that costs $100 per hour and is assigned to a task at 50% Units. An hour of effort applied to the task will cost $50.
If a similar resource is assigned at 100% units but has 50% efficiency, an hour of effort (an identical amount of work done) costs $100.
- Cost per Use vs Cost per Hour
-
A resource that has a static cost each time it is employed for a task—regardless of the effort or duration required—has its cost represented by a Cost per Use value, where assignment to a task represents one use. This may be a flat rental fee for equipment (for example), or it might reflect the nature of the task to which the resource is assigned. An illustrator contracted to produce a book cover, for example, may charge a flat fee for the job regardless of the number of hours worked to reach the end result.
A resource with cost that scales based on the duration of its employment, by contrast, is represented by Cost per Hour. This could reflect costs of running a physical plant (heating, electric, other utilities), or the wages of a salaried or hourly employee.
The Working in Calendar View chapter explains how to set up a resource’s working hours and schedule exceptions.
View Options in Resource View
As with Task View, the resource outline can be customized to display columns with a wide variety of information about your resources. To show and hide columns, select them in View Options (Command-J) or Control-click on the column header and toggle them in the contextual menu that appears.
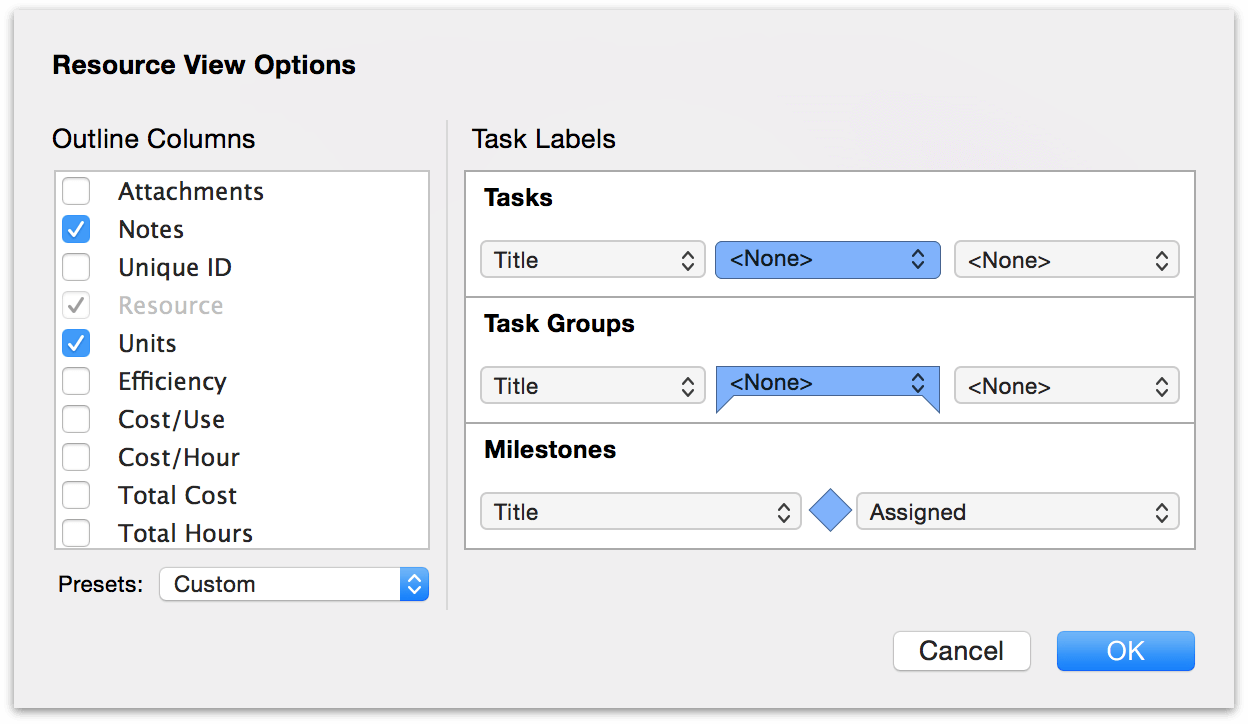
Also as with Task View, the Resource View’s view options offer metadata fields for display next to (or superimposed upon) tasks and groups as displayed in the resource timeline. Each appended field has a dropdown menu that you can choose any of the available custom columns’ values to occupy.
Description of some of the more involved custom Resource View columns follows.
- Attachments
- You can click the paper clip icon Attachment icon in the selected row to see a menu of the item’s attachments, or to link to a file if there isn’t one linked yet. Rows with links to files show a paper clip icon even when they are deselected.
- Notes
- You can click the note icon in the selected row to show or hide the item’s note, or to create a note if there isn’t one yet. Rows with notes show a note icon even when they are deselected.
- Unique ID
- The unique ID is a number assigned to each resource to identify it unambiguously, even if its name or position in the outline changes. A unique ID won’t ever change, and each new task or resource you create gets a new unique ID number. These numbers are useful for matching up items when you are importing and exporting projects between OmniPlan and other applications.
- Custom Work Week
- An icon appears in this column if a resource has a work week that differs from its default work week; the default work week for a resource is defined by its parent (if it’s a member of a group) or the project (if it’s not). You can click the icon to see the resource’s work week, and from there you can always click the X button in the upper-right of the week view to revert to the default.
- Schedule Exception
- An icon appears in this column if a resource has a work schedule that differs from its work week, such as when someone goes on vacation. You can click the icon to see the resource’s work schedule, and from there you can check the orange-highlighted dates to see where its exceptions are. You can click the X button in the upper-right corner of any week view to clear the resource’s exceptions for that week.
Chapter 107
Working in Calendar View
With tasks and resources in place, the project begins to take shape; the calendar is what anchors the project in real time. OmniPlan’s calendar view helps ensure that your project is finished on time with an array of customizable scheduling controls.
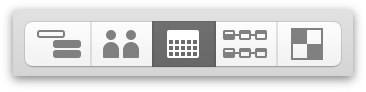
Whether establishing the calendar for an individual resource or for the project as a whole, you will switch between two modes while working in this view: Normal Hours (for the regular weekly schedule) and Extra & Off Hours (for exceptions to the regular week). Switch between these modes using the toggle beneath the resource list in the lower-left of the window.

Setting Up Working Hours for a Project
The Normal Hours are a general set of working hours to be followed in a typical week. This set of hours is applied to every week in the project, thus determining how many hours of effort can be completed in each day. Resources inherit their work week schedules from the project, but you can customize them individually if they work different hours. To set up exceptions to the work week for events such as half-days, holidays, and overtime, see Editing Exceptions later in this chapter.
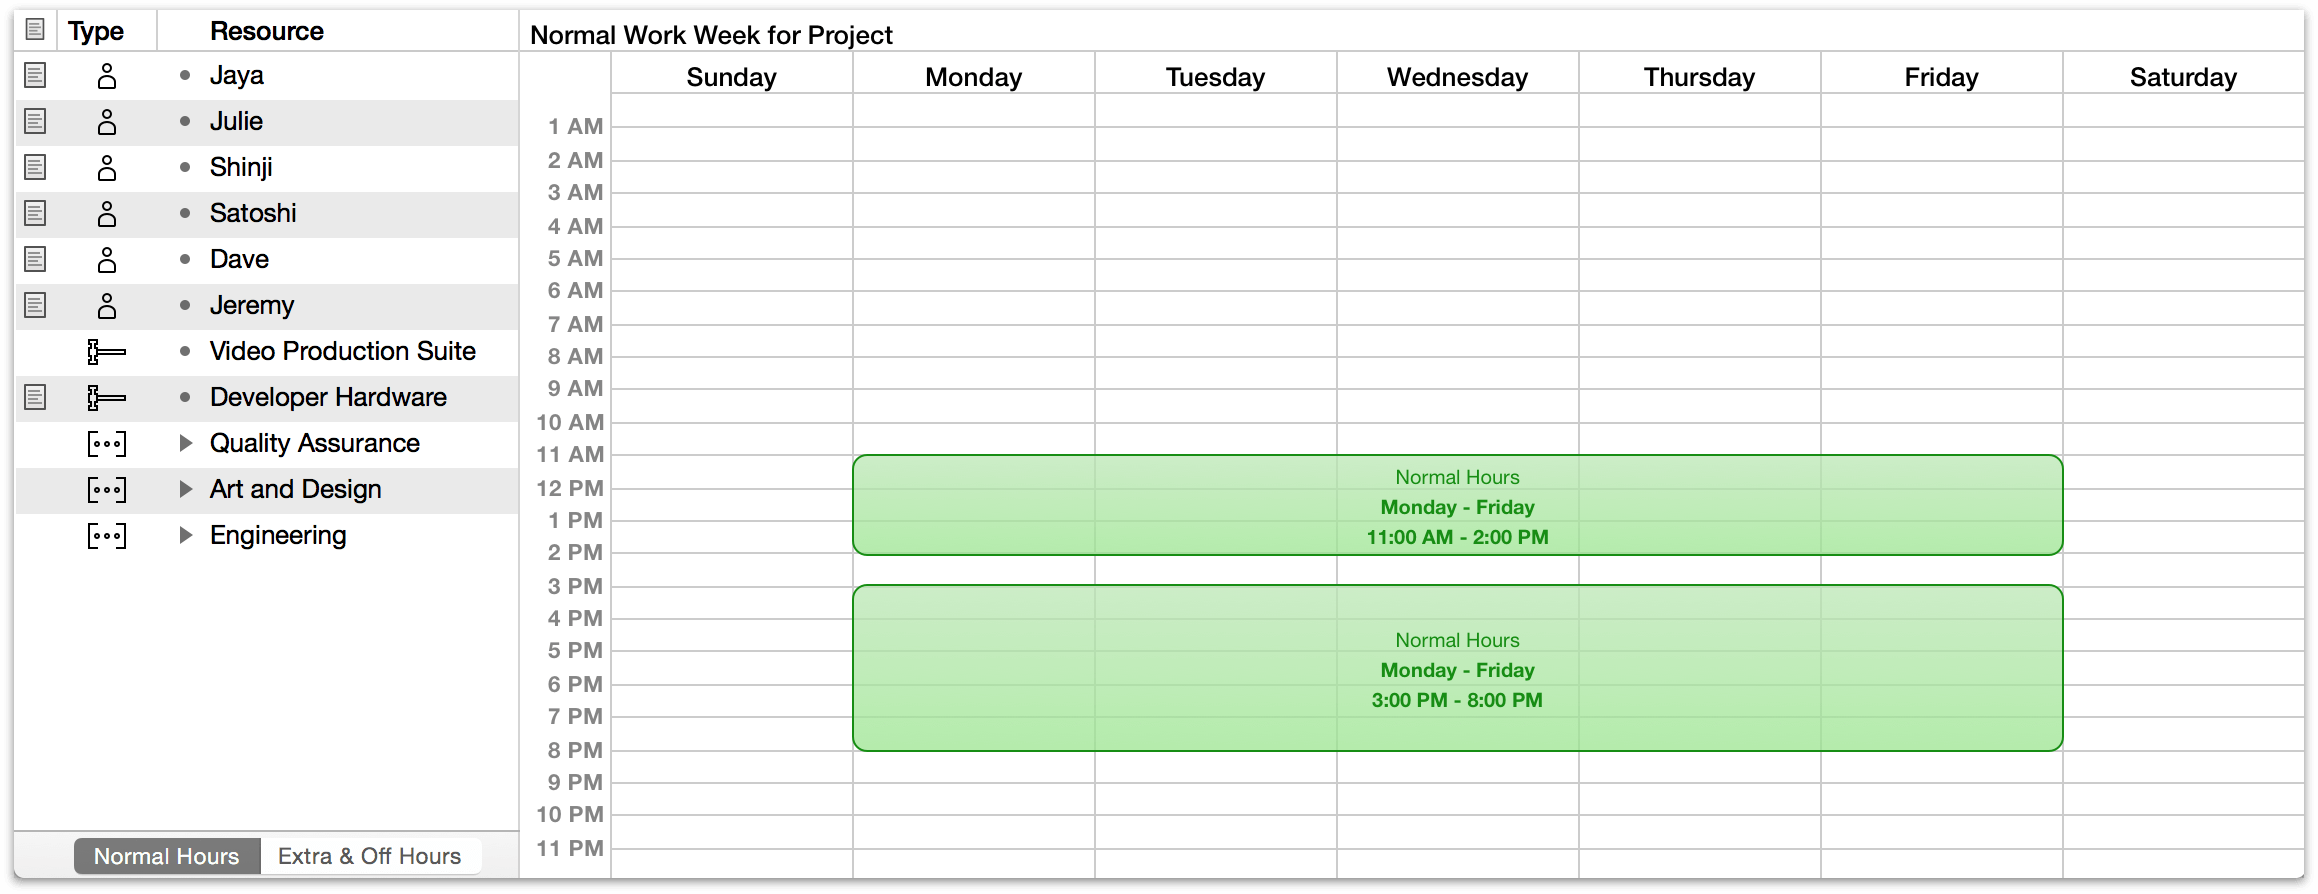
The green blocks represent segments of working time. You can drag the edges of a block to set a day and time range; in the above case, the project is set up with eight hours of working time per day, Monday through Friday, from 11:00 AM to 8:00 PM with a break in the middle for lunch.
Click a block to select it; you can then press the arrow keys to move it, or press Delete to remove it.
Drag or double-click in an empty area to create a new time block, and Shift-drag anywhere to draw a red block that erases working hours. These techniques are useful for breaking up blocks that span several days, so that you can adjust them individually.
When you create normal working hours for a project in calendar view, you are describing the calendar of work time that happens in a typical week for purposes of resource assignment.
However, when times are displayed throughout OmniPlan (the amount of effort remaining on a task, for example), they are calculated based on the the week length established in the Effort Unit Conversions section of the Project inspector.
For example, if your work week is six days of seven hours each, tasks displayed in the Gantt chart will appear to register inaccurate times unless you change the value of a work day to 7 hours and a work week to 42 hours.
Setting Up Working Hours for a Resource
When you select a resource in the outline, you can edit that resource’s working hours. (If nothing is selected, you will edit the working hours for the whole project instead.)
If a resource’s work week is (#editingexceptions)[customized] from the whole project’s normal work week, the Custom Work Week icon ![]() appears in the Custom Work Week column.
appears in the Custom Work Week column.
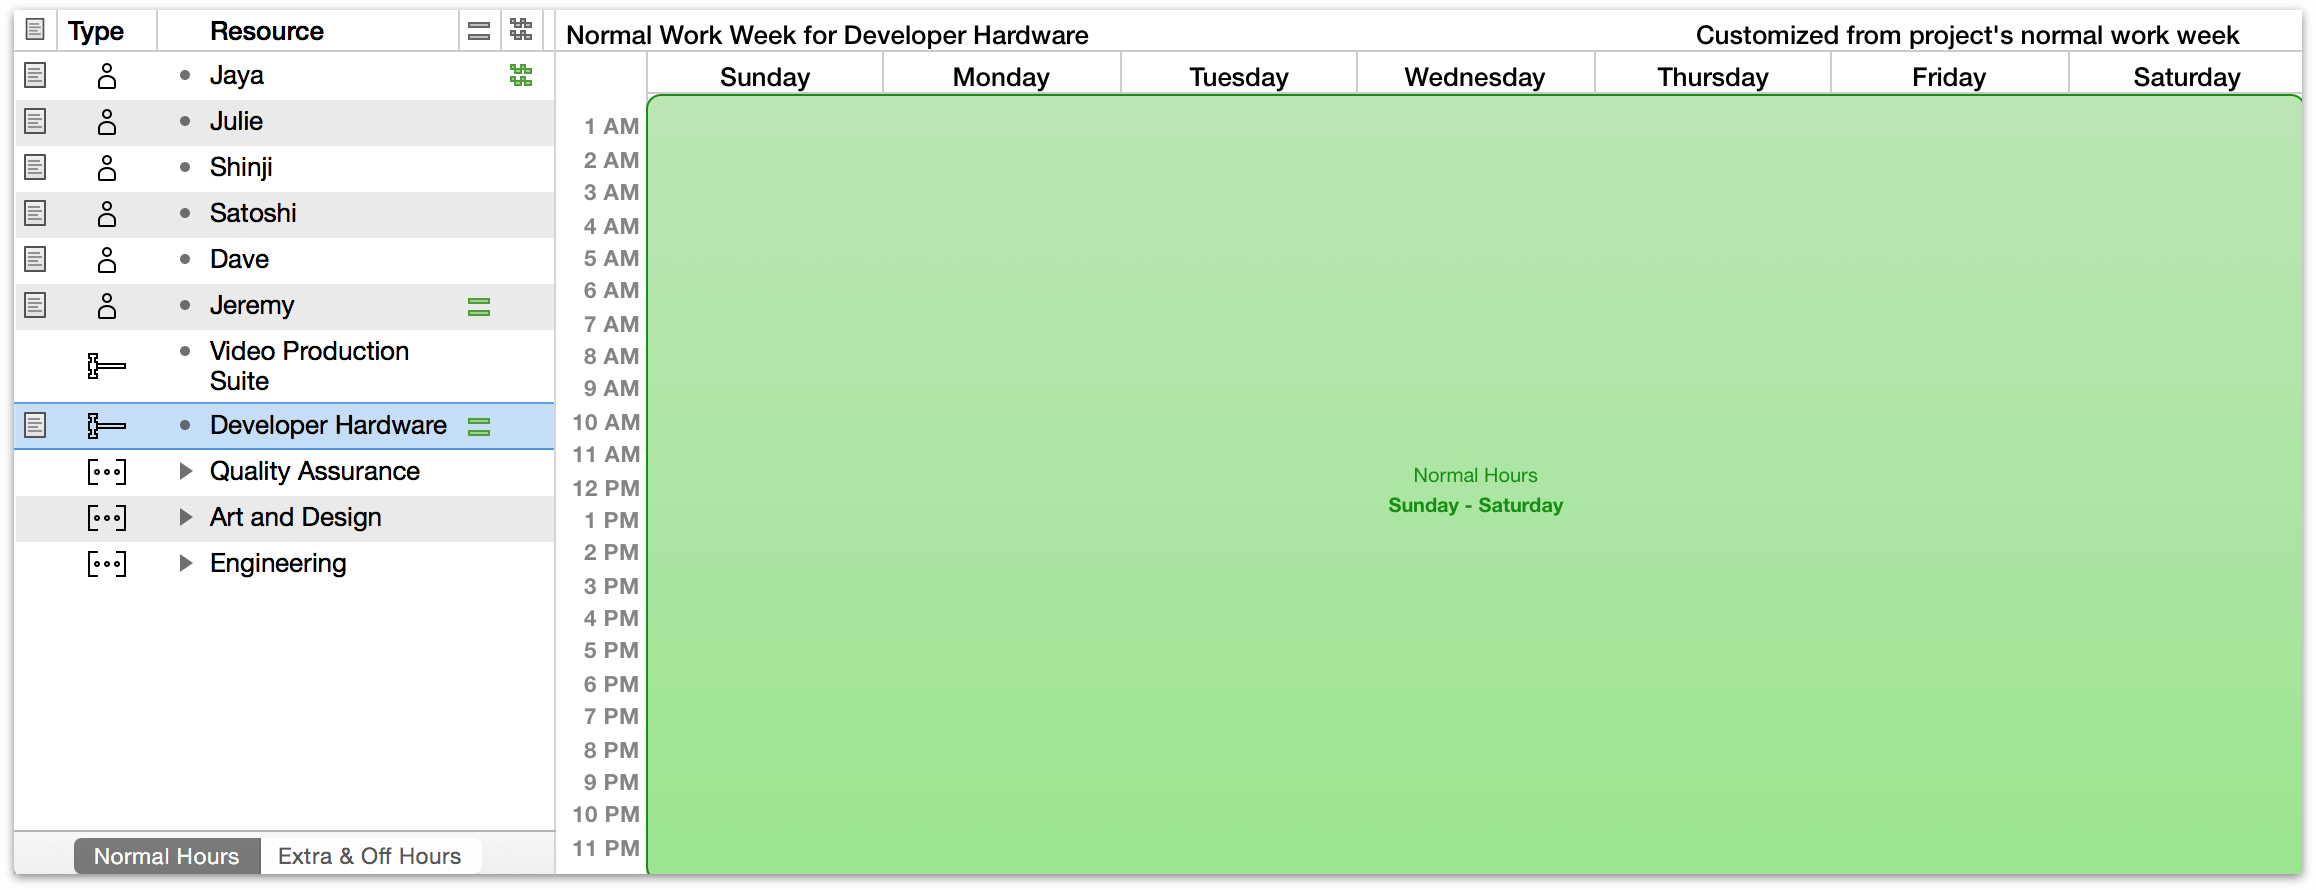
As with the project as a whole, the working hours for an individual resource are represented by green blocks in the calendar. You can drag the edges of the block to set a day and time range; in the above case, the resource is a piece of developer hardware that can be left running 24 hours a day.
Click a block to select it; you can then press the arrow keys to move it, or press the Delete key to remove it.
Drag or double-click in an empty area to create a new time block, and Shift-drag anywhere to draw a red block that erases working hours. These techniques are useful for breaking up blocks that span several days, so that you can adjust them individually.
Editing Exceptions
The Extra & Off Hours are a calendar of the working hours for specific days. You can set up holidays, half-days, overtime, and other such exceptions to the normal work week. Just like the normal work week, there is a work schedule for the whole project, which the resources follow, but you can also customize resources individually.
Select a resource in the outline to edit its work schedule, or select nothing to edit the work schedule for the whole project.
Choose a week to edit from the mini calendar. Days which differ from the standard work week are blue. Click the arrows to move between months; Option-click to move a year at a time.
If a resource has any exceptions to its normal work week, the Schedule Exception icon ![]() appears in the Schedule Exception column.
appears in the Schedule Exception column.
The normal work week appears with a green dotted border, so you can see how this week’s schedule differs as you begin to make changes.
As when editing the work week for the project as a whole, drag or double-click in an empty area to create a new block of working time. Shift-drag anywhere to draw a red block that represents time that is unavailable for work.
View Options in Calendar View
Calendar View has a minimal set of view options that offer additional columns for display in the specialized resource outline that accompanies the calendar. Resource is the only one that is required; the resource’s Type, Notes, and calendar-specific Custom Work Week and Schedule Exception columns are the other defaults for a new project. The latter two are particularly useful for spotting at a glance when a resource’s schedule differs from the norm.
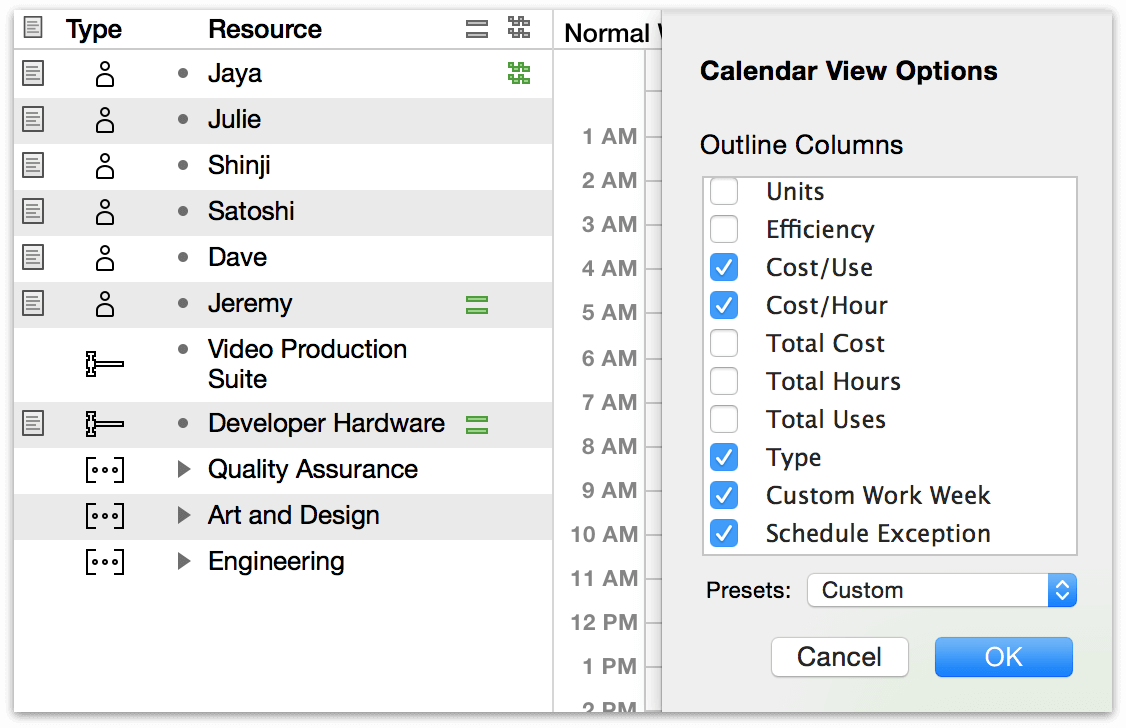
An altered normal hours schedule is represented by a green “equals sign” in the Custom Work Week column; click it to view the customized work week of the selected resource. A resource with an upcoming schedule exception is flagged with a staggered pair of zigzag lines in the Schedule Exception column; clicking the icon will likewise bring you to the schedule change in question.
Chapter 108
Working in Network View
Network View offers an elegant, visually descriptive way to view your project as a network diagram of nodes connected by dependencies. Enter Network View by clicking the fourth button in the view switcher in the toolbar, or choosing View ▸ Network View (Option-Command-4).
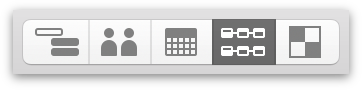
Whether used as a tool for rapidly prototyping a new project or getting a handle on the complexities of an existing one, working in Network View provides a great new perspective on your project.
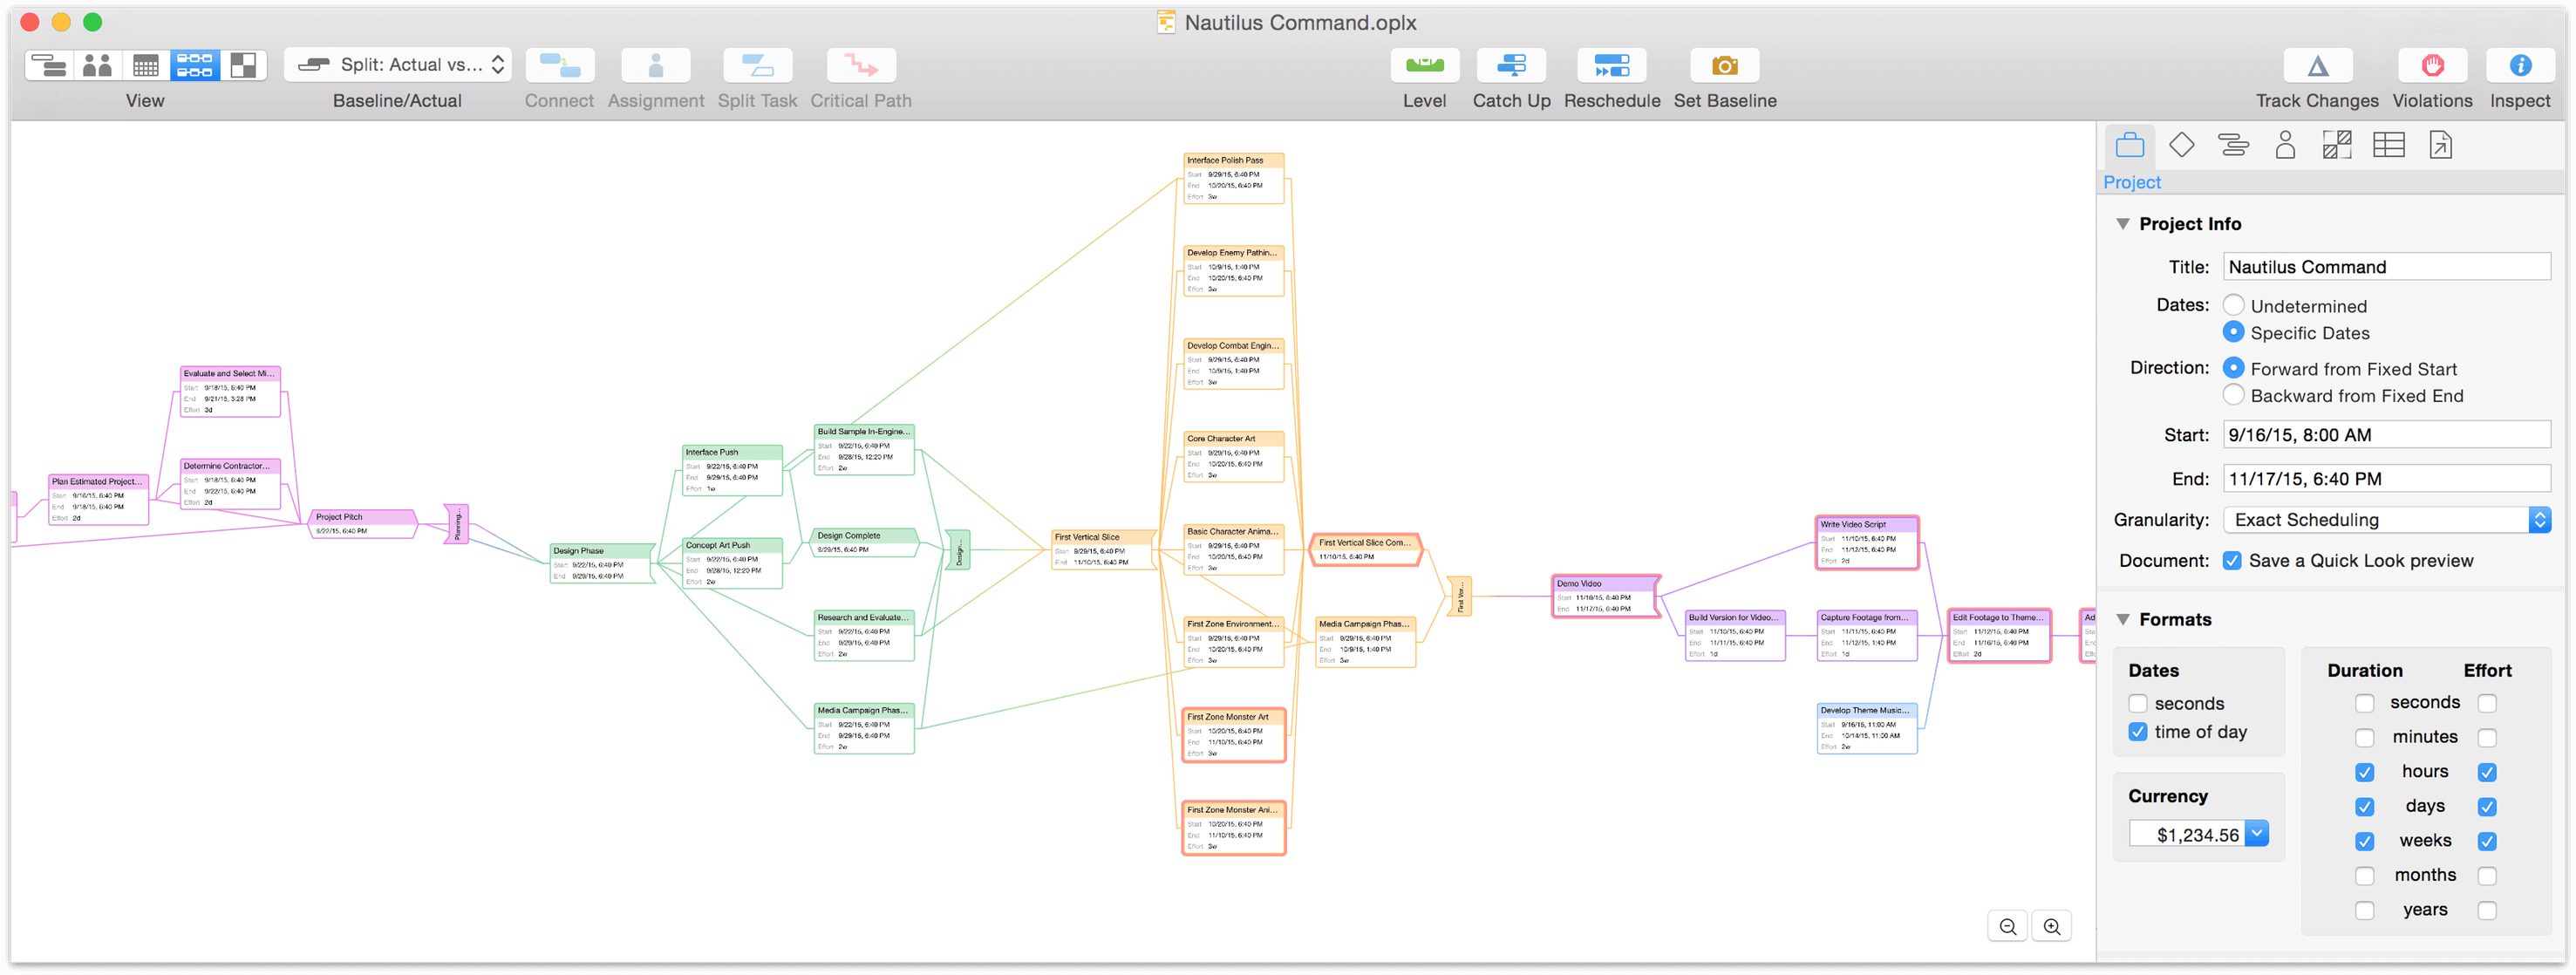
Charting Tasks and Dependencies
When you’re ready to start building (or adding to) a project in Network View, press Option-Command-4 to switch to Network View and then press Return. That’s it! A new task is created.
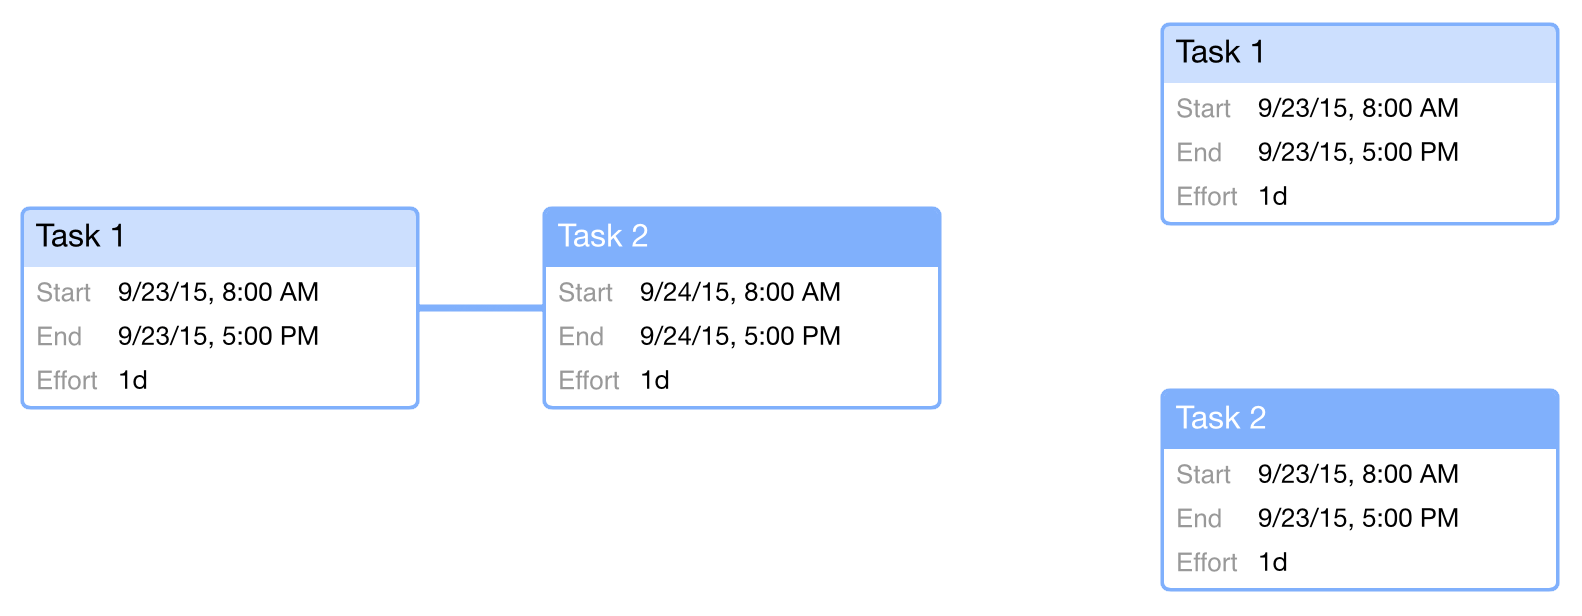
If you had a task selected previously, the new task will be connected to it by a line that represents a Finish→Start dependency. If no tasks were selected, the newly created task is independent of any others. As long as a task is selected, you can quickly create a chain of tasks connected with Finish→Start dependencies by continuing to press Return.
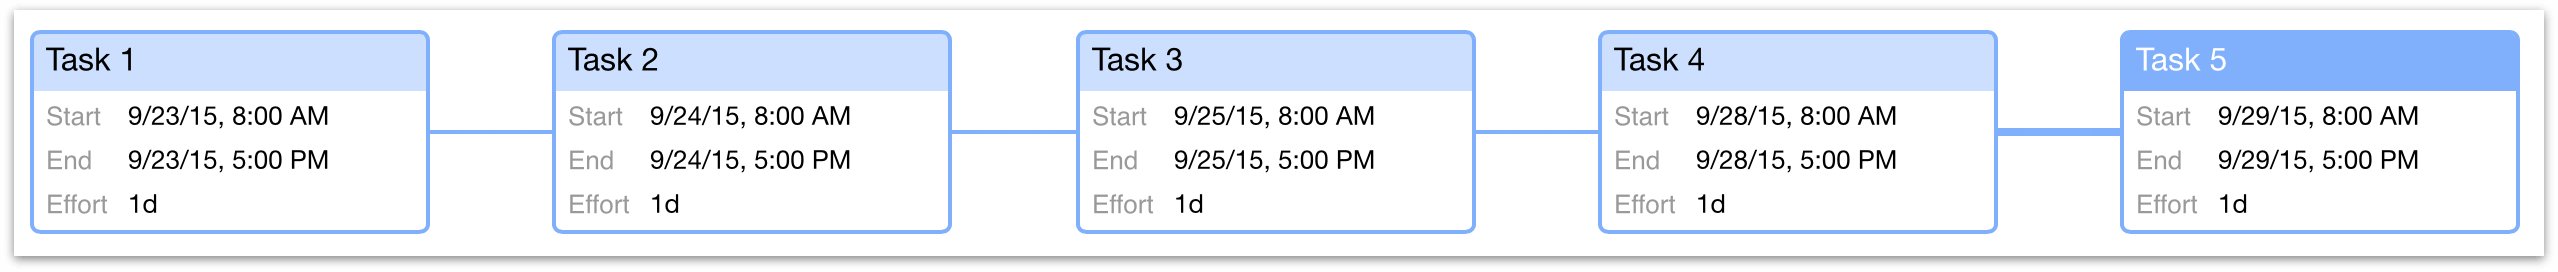
An unbroken chain of tasks with Finish→Start dependencies is arrayed in a straight horizontal line.
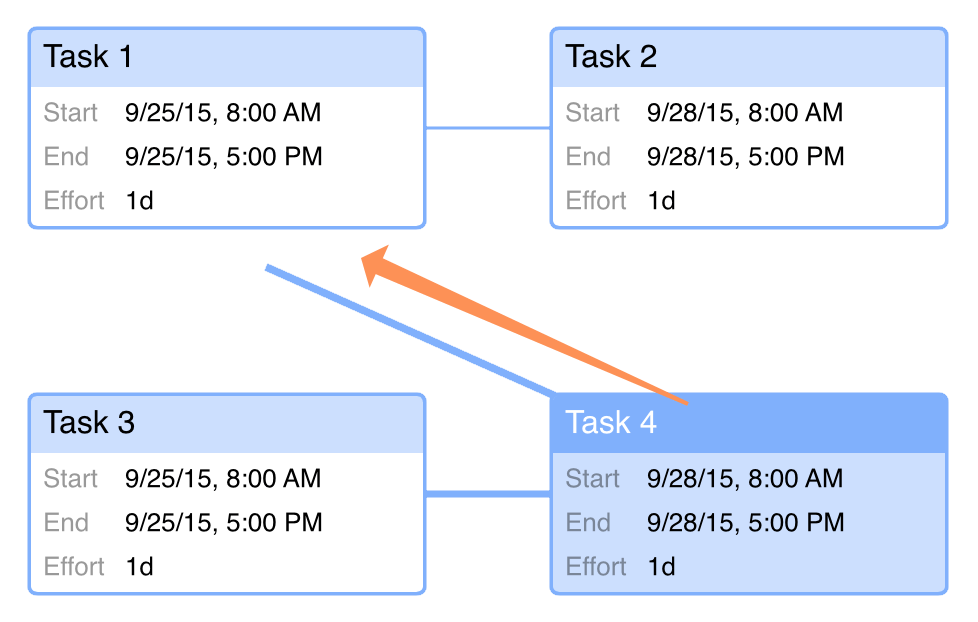
To create other dependency relationships, click a task node to select it and drag the line that appears to another task. This creates a dependency between them, and you’ll see the tasks rearrange in the diagram automatically to reflect this new relationship.
At any time while working in Network View, you can switch to Task View to see how your project-building exercise is looking in the Gantt chart and see how its dependencies are described there.
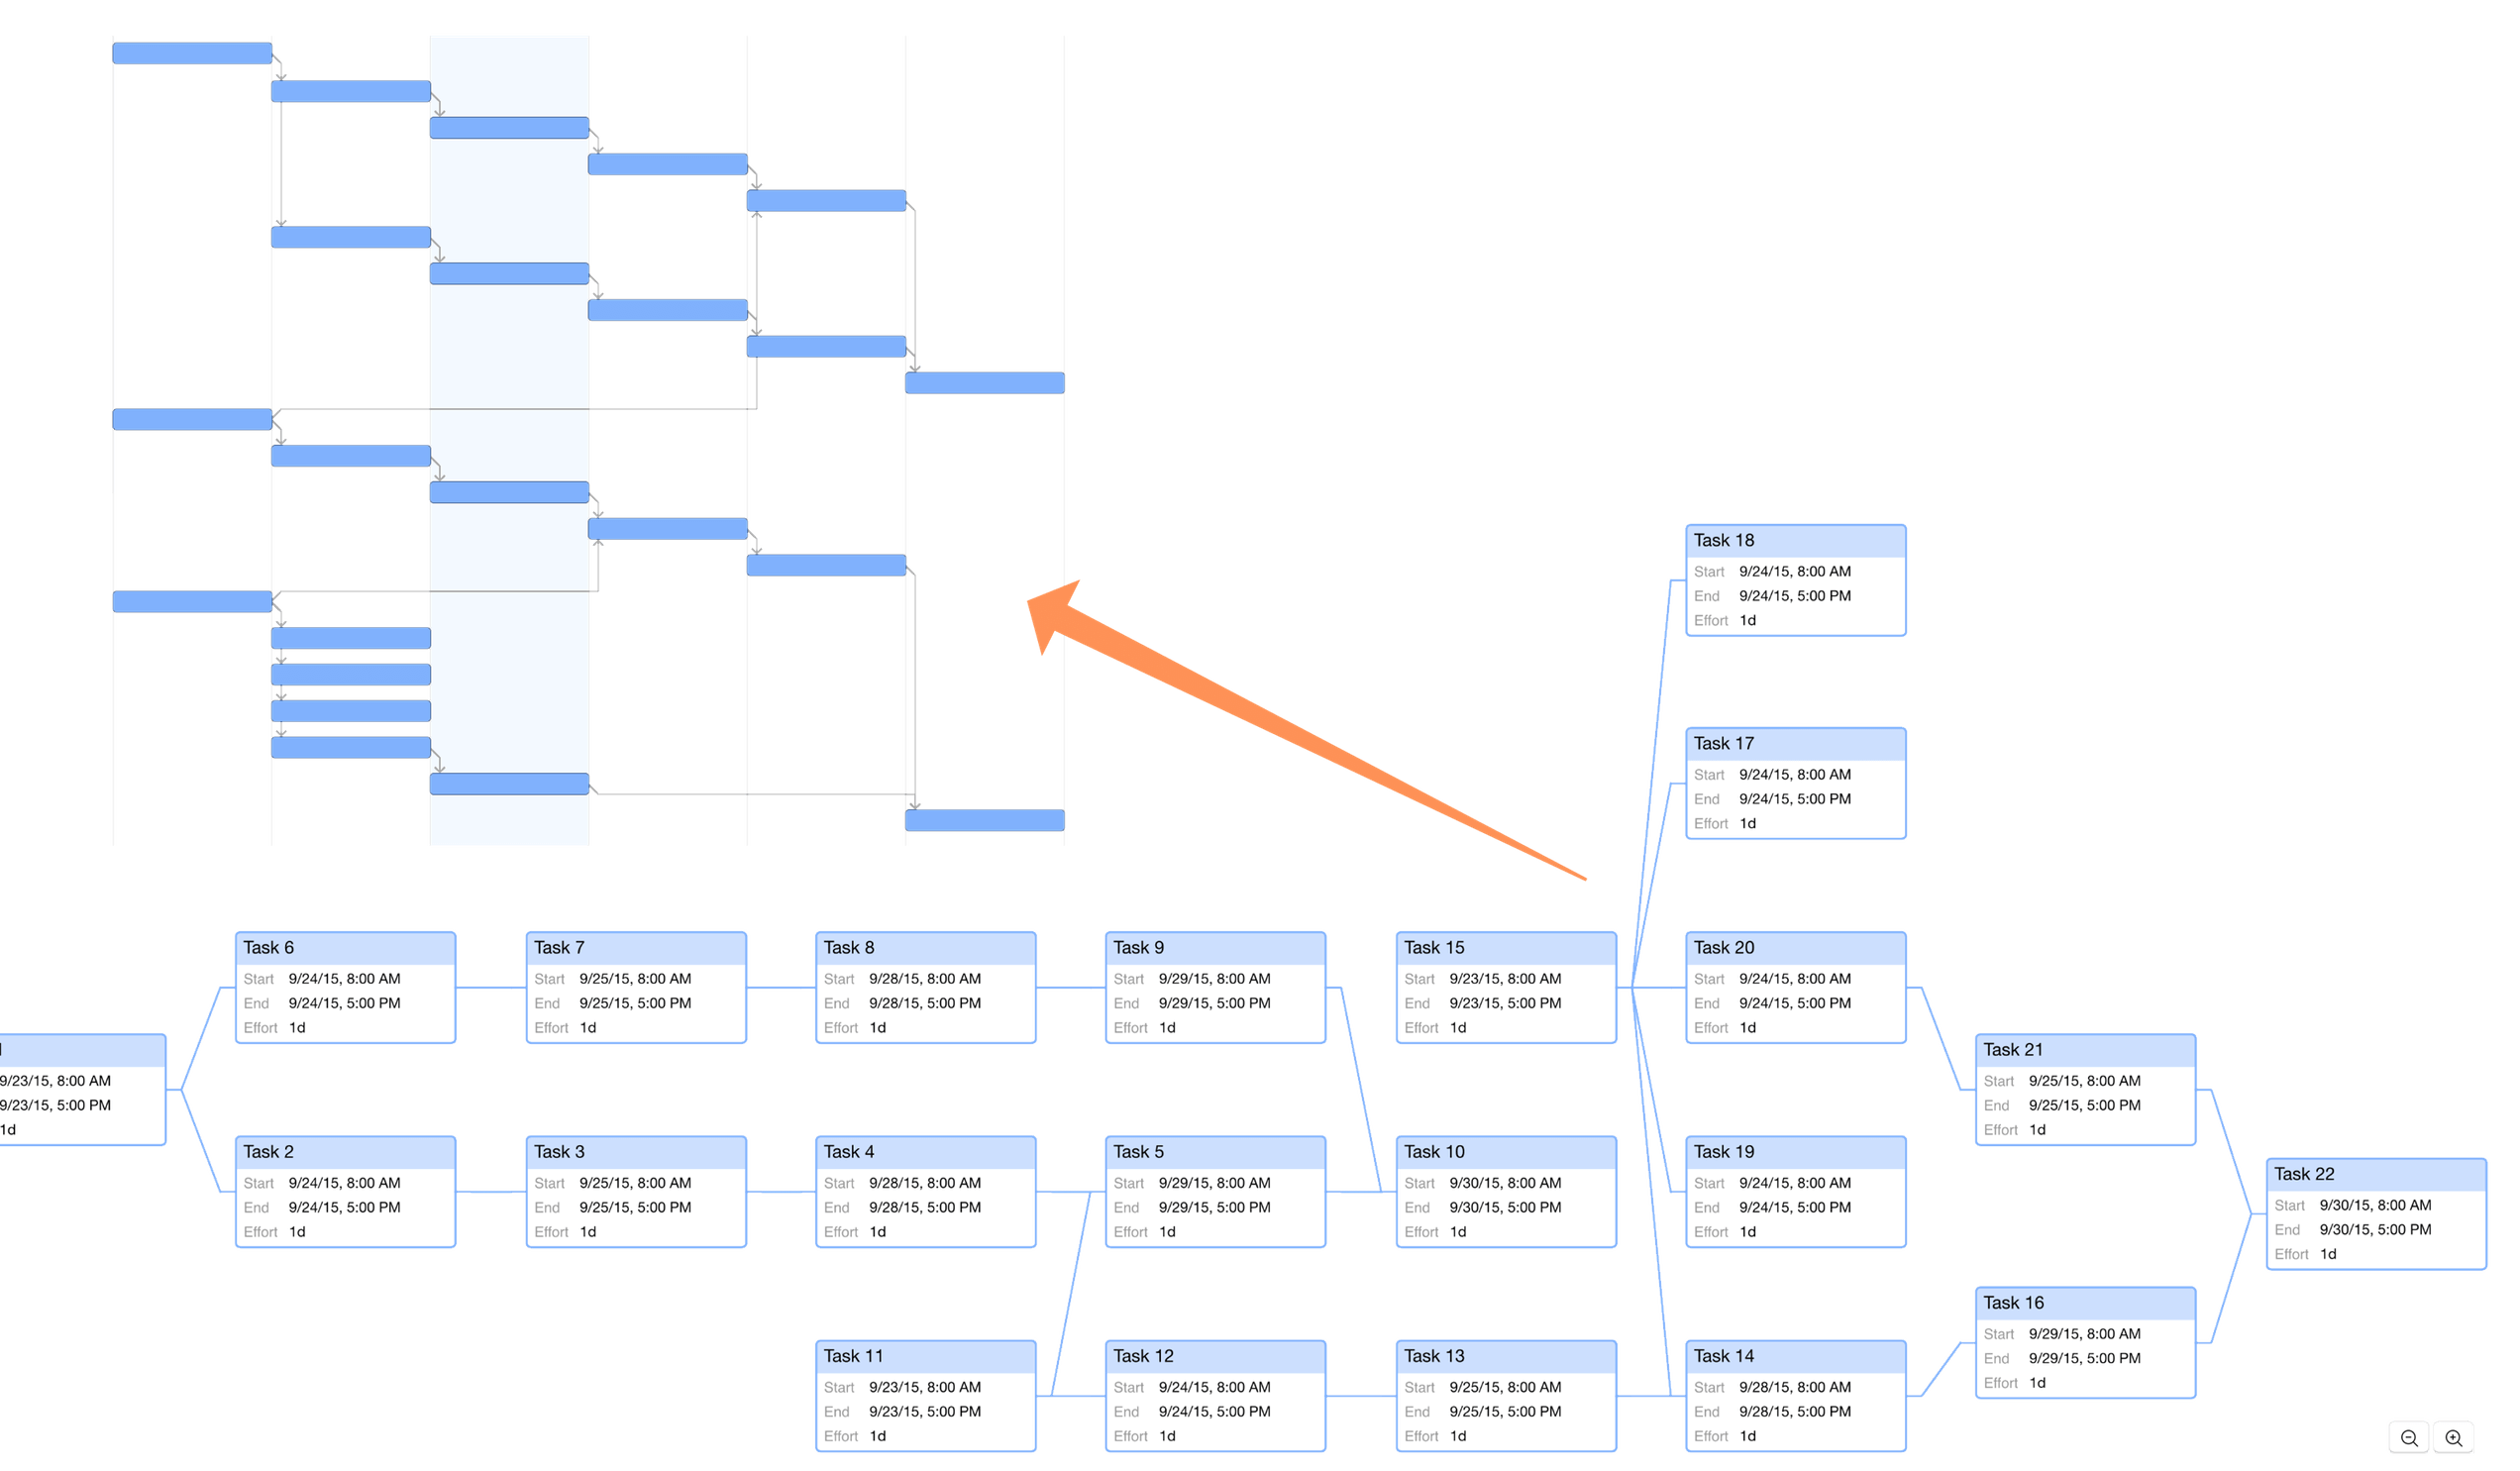
When you’re working on a project of considerable size, you can zoom in and out on your network diagram using the buttons in the lower-right corner of the view, or with - and + on the keyboard.
To apply colors to items in Network View, you can set up document and Gantt styles in Styles View that will carry over to tasks in the network diagram, or use the Styles Inspector to apply individual styles to tasks or groups in Task View that will likewise carry over.
Highlighting of tasks done via display of Critical Paths will show in Network View as well as Task View.
When you have a complex network diagram with multiple task groups, it can be useful simplify the project appearance by hiding tasks within those groups.
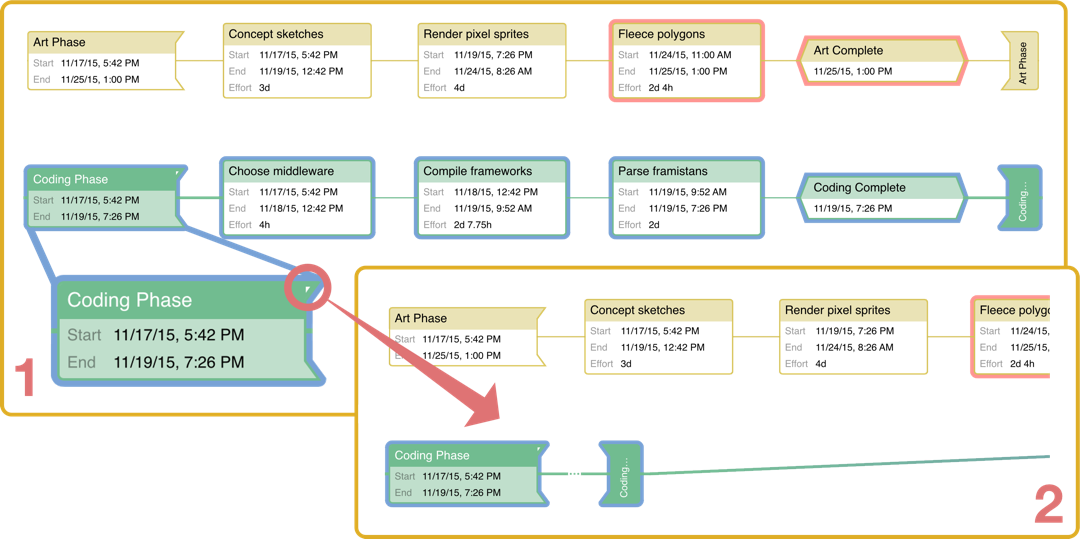
To collapse a group and hide the tasks inside:
-
Move your cursor over the group task (represented in the network diagram by a node shaped like an open bracket). A tab appears on the upper-right corner of the task.
-
Click the tab, and the group collapses. The group task is shown as a set of brackets with an ellipsis between them, indicating that the tasks within the group are hidden.
-
Click the tab at the corner of the group again to expand it, and the tasks return to view within the group brackets.
Customizing Node Metadata
If you’d like to show values on task nodes other than the default, you can fully customize them using the Network View’s View Options. Choose View ▸ View Options (Command-J) to open the View Options menu, and you’ll find the three primary tasks types available for editing — Tasks, Milestones, and Groups.
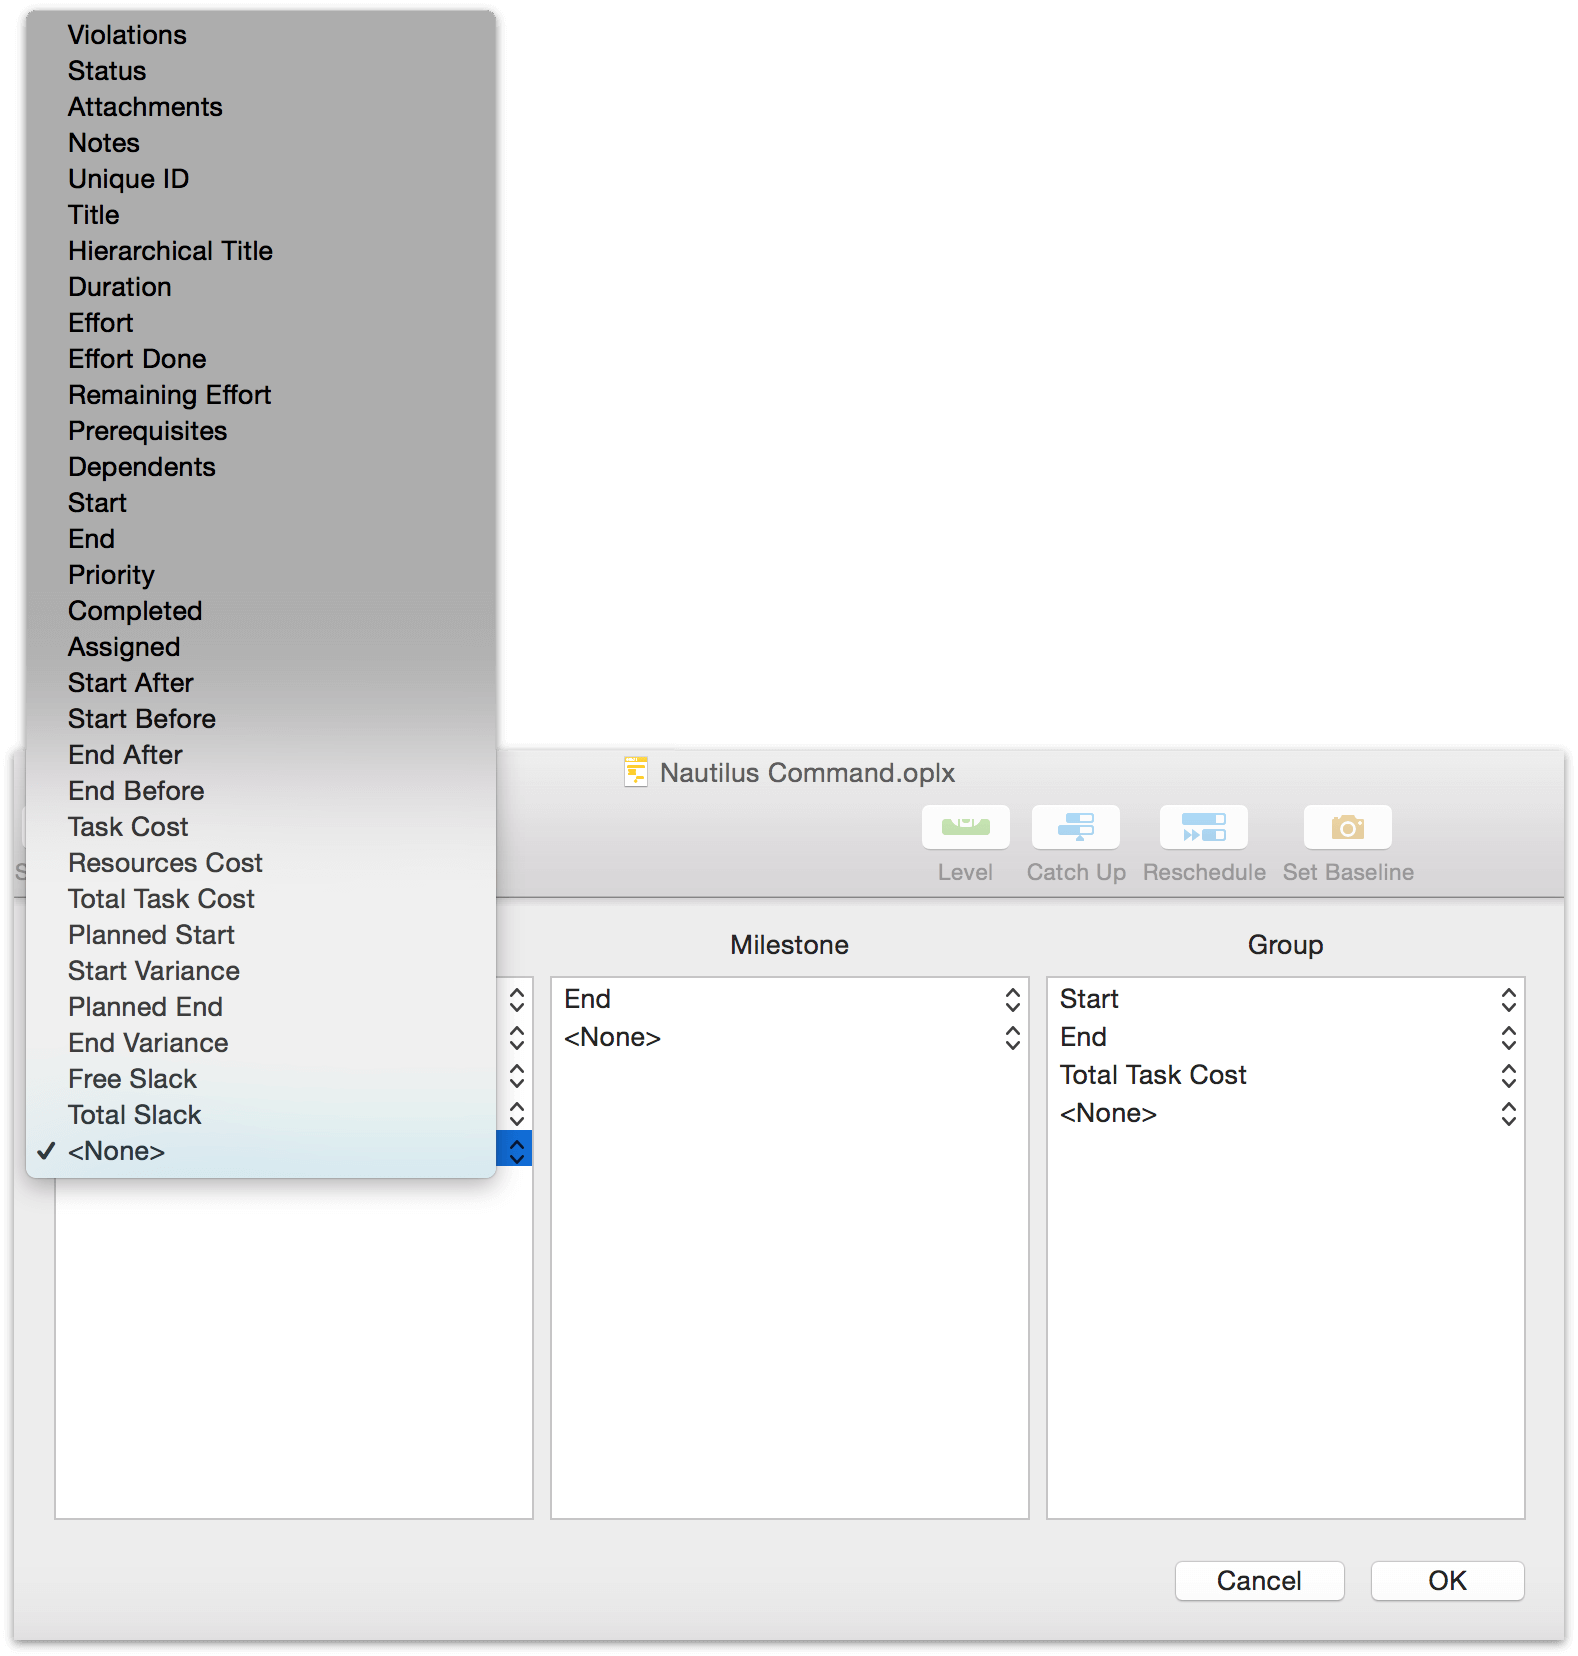
Choose a column type from the popup menu to add it to nodes of the selected task type, or choose None to remove that metadata row from display.
Chapter 109
Working in Styles View
OmniPlan’s default visual presentation is designed for clear and professional display of your project data right out of the box. But if you’d like to configure your project’s appearance so it shines in a different light, you’ll find the tools to do so in OmniPlan’s Styles View.
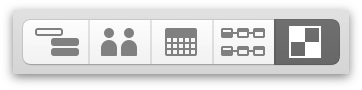
Styles View sets the look of your project’s various parts in a modular way. Changing a setting here changes the default appearance for each item of a given type throughout the document; if you’d rather customize the appearance of a single item or custom selection, ad-hoc styling with the Styles inspector is the way to go.
Styles View is made of three parts that control elements of your project’s visual style in different ways, providing the ability to customize the appearance of your project as a whole as well as individual elements inside it.
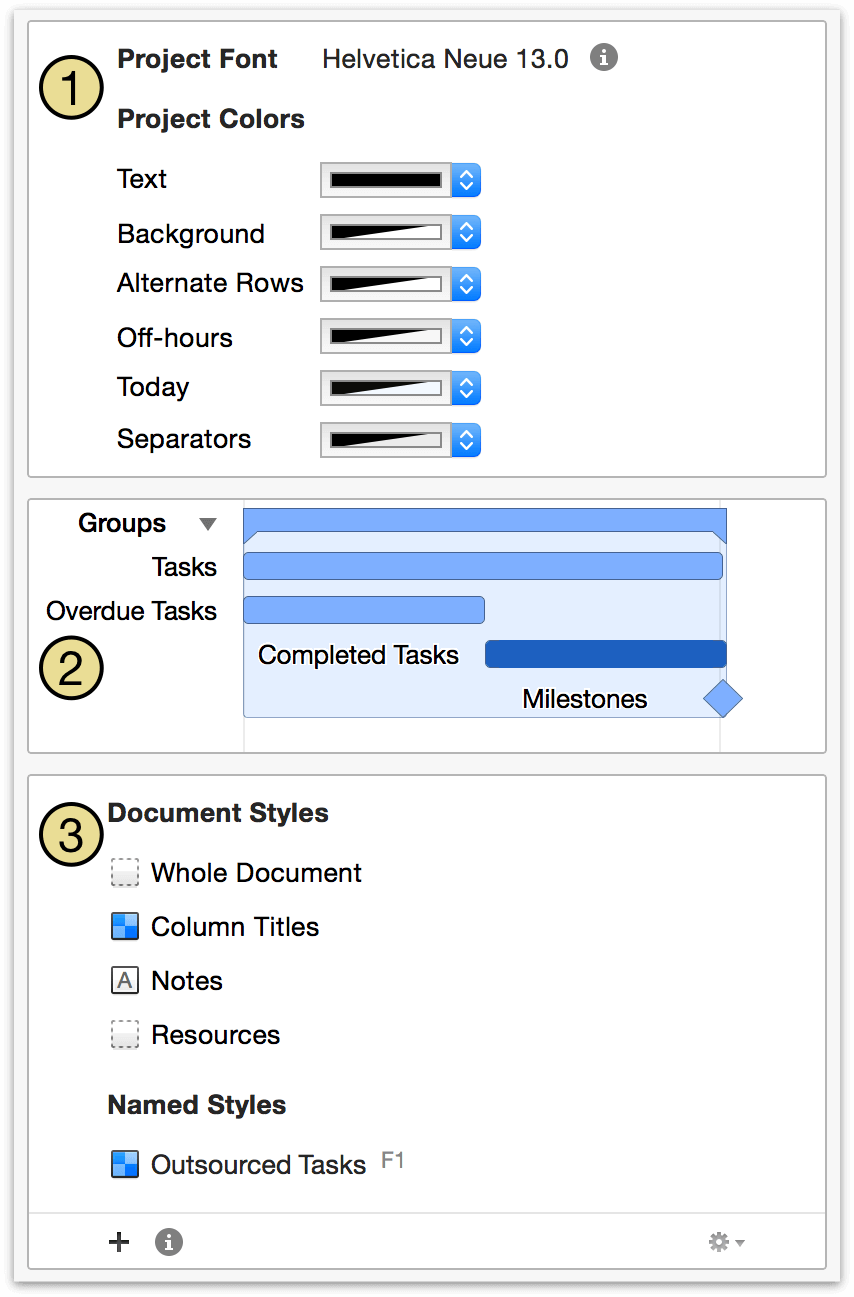
-
Project Font and Colors — Choose a font to be used throughout your project, a color for the text, and colors for structural elements of the OmniPlan view interface.
-
Gantt Styles — Select a feature of the Gantt chart in the preview here and use the Styles inspector to change its default settings throughout your document. The appearance of groups, tasks, overdue tasks, completed tasks, and milestones can be edited here; the preview also updates based on changes made elsewhere in Styles View.
-
Document and Named Styles — Choose a Document Style to update all items of the named type in the OmniPlan interface. You’ll also create Named Styles here, which are custom styles you can use the Styles inspector to apply wherever you like.
Changing Project Font and Colors
The Project Font and Colors section of Styles View provides tools to customize the colors seen throughout your project, including:
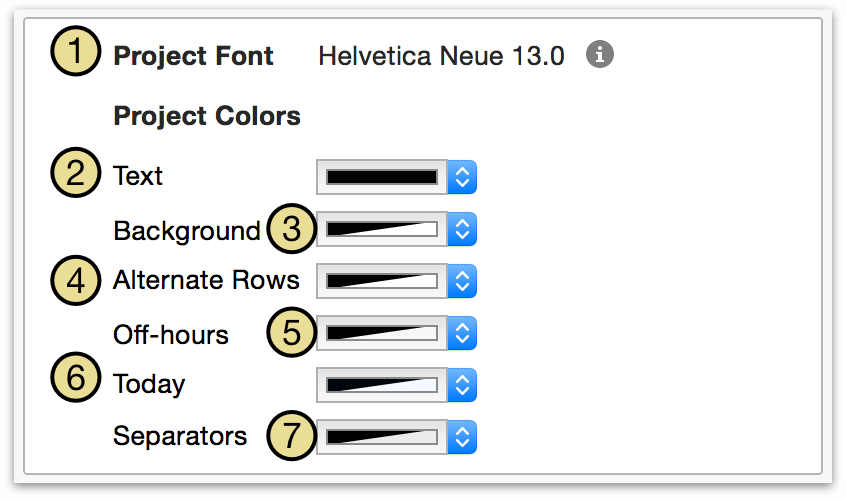
-
The project font. This is the font used for item names and notes throughout the project.
-
The project text color. This is the color applied to the project font throughout the document.
-
The background color of the whole document.
-
A color for every other item; set this to a nice low-opacity color to keep your rows distinctive.
-
The color for non-working hours. Used only if you’ve set up the View Options to show off hours.
-
Today’s date in the chart. Used only if you have a specific start date set in the Project Info section of the Project inspector.
-
The base color for lines between time spans (that fade in and out as you zoom).
Changing the Appearance of the Gantt Chart
Selecting an item type in the Gantt preview changes its appearance throughout the document. With an item selected here, the Styles inspector acts as a control interface for editing its appearance.
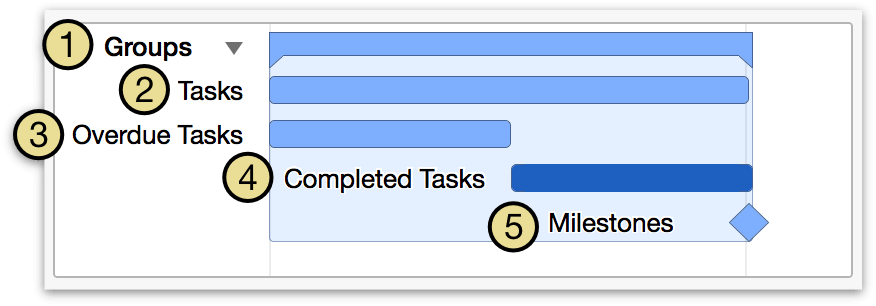
The following visual aspects of the Gantt chart can be edited with the preview:
-
Task Groups — All groups of tasks. By default, their titles are in bold text to distinguish them from single tasks.
-
Tasks — All tasks, but not groups or milestones. Note that the Completed Tasks and Overdue Tasks styles can override this.
-
Completed Tasks — Any task whose completion is at 100%. You could, for example, make tasks’ Gantt bars turn gray when they are finished.
-
Overdue Tasks — Tasks which were scheduled to complete in the past, but are not complete. You might like to turn these bright red so that you can see where your project is getting behind.
-
Milestones — All milestones. By default they are styled the same as regular tasks.
Colors applied to the Gantt preview also appear in the project as shown in Working in Network View.
Changing Document Styles
Beyond project colors and Gantt chart properties, styles of text across the entire project can be edited in the Document Styles section of Styles View.
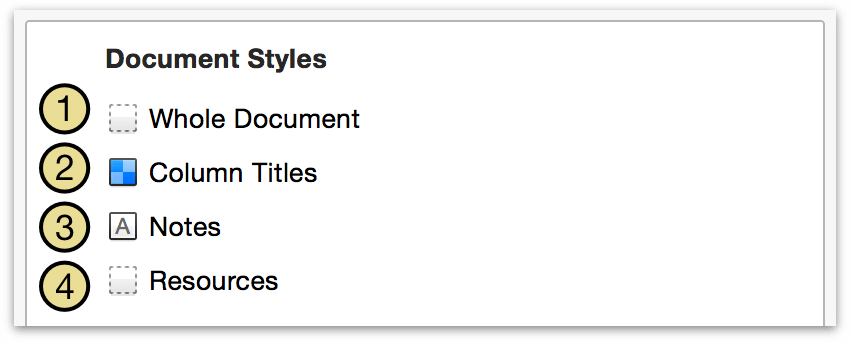
To set up a document style, select the one you want to change from the list in the Document Styles section of Styles View.
Use the style controls in the Styles inspector to change the default style for everything of the selected type.
The following structural styles are associated with various elements of OmniPlan’s interface:
-
Whole Document — All text in outlines throughout the entire document; it can be overriden by the more specific styles listed below it.
-
Column Titles — The headers above the outline views and charts, and the vertical resource names in the resource timeline.
-
Notes — Notes attached to tasks and resources.
-
Resources — All resources, how they appear in the resource outline and as assignments on the Gantt chart.
Document styles are the most general type of style, so named styles or ad-hoc styles can override them.
Creating and Using Named Styles
If there’s a specific style you’d like to apply to individual items multiple times over, you can create and save a named style that you can invoke with the touch of a button.
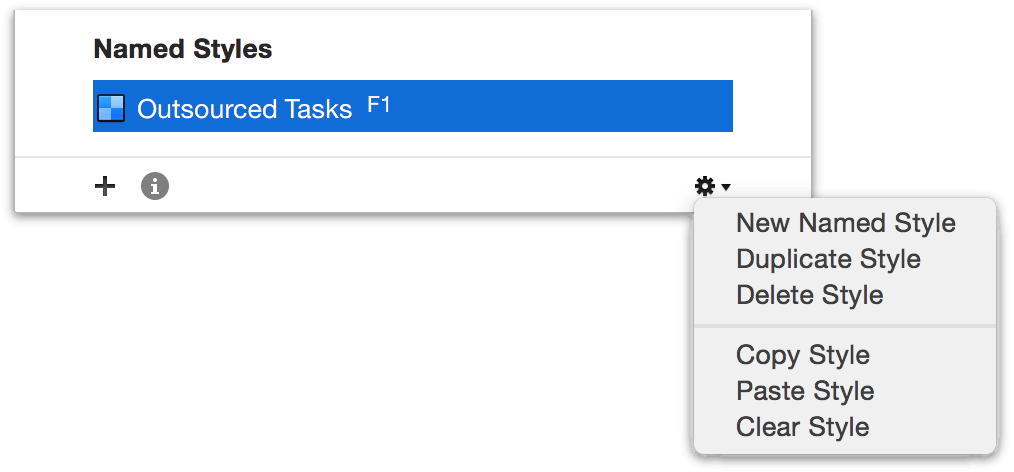
-
Click the plus button at the bottom of the styles list to create a new named style.
-
Then, while you have the named style selected, use the controls in the Styles inspector to change its attributes. The font button next to the plus button beneath the named styles list opens font controls for the selected style.
-
Once the style is set up how you want it, apply it to an item in the main window by selecting the item and choosing the style from the dropdown in the Item Style section of the Styles inspector, or by selecting the item and then pressing the appropriate function key.
By default, each named style you create is assigned to a different function key (F1, F2, F3, and so on, up to F9). This provides automatic keyboard shortcuts for the most common named styles you use; drag and drop styles to rearrange them in the list and promote the ones you use the most.
- You can keep applying the named style to items, and any further changes you make to the named style are applied to every item that has it applied.
Named styles take precedence over document styles; if a document style and a named style are both applied to the same item, the item will be displayed in the named style.
When you have your project styles set up just the way you like, you can save your project as a template to use those styles in new projects.
Chapter 110
Using the Inspectors
So called because they offer tools to inspect your current selection, the inspectors in OmniPlan 3 have been redesigned with even more power, flexibility, and ease of use than ever before.
OmniPlan’s inspectors live in a sidebar on the right side of the main window. You can click and drag on the inspectors’ left edge to hide them, offering more screen space for the main view; drag in from the right side of the window to reveal them if they’re hidden. Choose Inspectors ▸ Show/Hide Inspectors (Shift-Command-I) works to do this as well.
When you select an item in one of OmniPlan’s views (typically a task in Task and Network View, a resource in Resource and Calendar View, or a style in Styles View), the app automatically switches to the inspector most relevant to the type of item selected. When nothing is selected the Project inspector is chosen by default, and edits made in other inspectors affect attributes of the project as a whole.
The Project Inspector
The Project inspector has information about the document as a whole. It’s split into three sections that each provide controls relevant to the structure and chronological flow of your project.
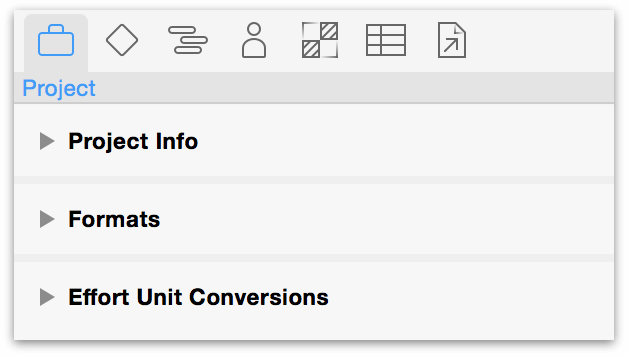
- Project Info — General info about the project as a whole, such as its title and if the project is scheduled from a start date or an end date. Also, home to the scheduling granularity setting.
- Formats — Configure your time and currency units.
- Effort Unit Conversions — Define the hours in a given work day, week, month, and year. Click Edit Work Week to go to Calendar View and make adjustments to your working hours.
Click the disclosure triangle next to each section to show or hide its contents.
Editing Project Information
The Project Info section of the Project inspector describes fundamental aspects of how your project is built out from the start. Deciding on these details is key to understanding the scope and schedule of your project.
Choosing Specific or Undetermined Project Dates
If you don’t know when the project will start or end, you can mark the start date undetermined in the Project Info section of the Project inspector. For the purposes of applying the work week, the project is assumed to start on the first day of the week. The normal work week for the project and for the individual resources is respected, but work schedule exceptions such as holidays are ignored.
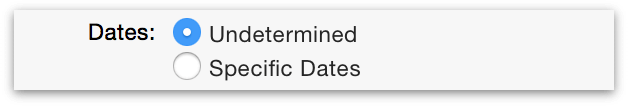
In a project with an undetermined date, all dates are represented in the format T day, for the first day of the project, or T + x, where x is some time duration. For example, T+2w 1d means 2 weeks and 1 day after the start of the project.
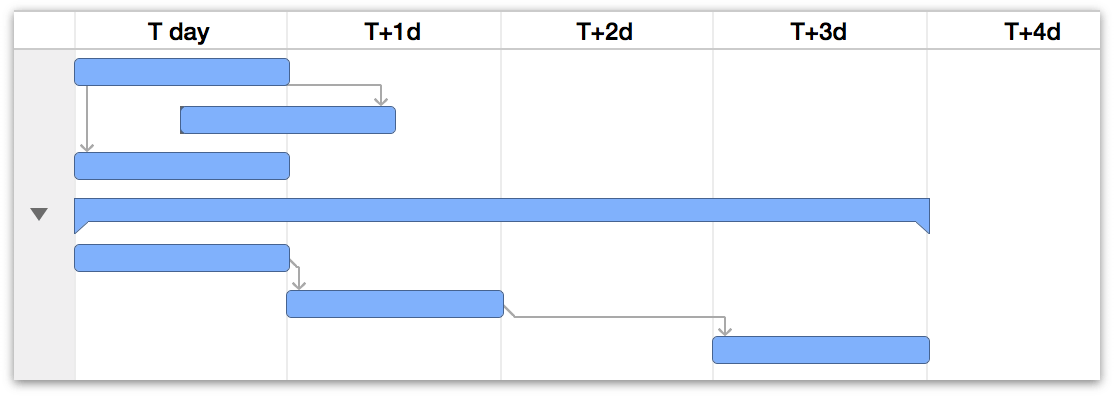
When you change the start or end date of an existing project from an undetermined date to a real date, the project may shift as the new position of weekends, off-days, and other exceptions are taken into account.
Start and End Dates
If you know when the project is going to start or end, you can enter a date here. All of the working hours and work schedule exceptions as set up in the calendar view can then be applied properly, and real dates appear in the interface. When your project has a start date, the tasks are scheduled from that point on as soon as possible. When your project has an end date, they are scheduled from that date backwards, as late as possible. You can change a task’s dates and direction in the Task inspector.
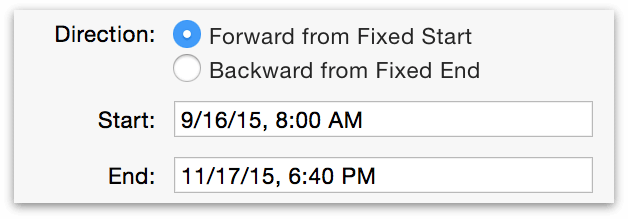
Setting a project’s start or end date defines the project’s direction: whether the schedule is built forward from a start date, or backward from an end date. In the former case all tasks in the project are scheduled for completion as soon as possible (ASAP), while in the latter case all tasks are scheduled as late as possible (ALAP). Changing the direction of individual tasks is covered in Task inspector.
While tasks in most projects are scheduled for completion as soon as possible, it can be helpful to plan a project with a defined ship date from that date backward to help determine when work on it should begin.
Scheduling Granularity
You can use the Granularity control in the Project Info section of the Project inspector to have OmniPlan round every duration up to the nearest whole hour or day. This setting is not just for display purposes, but actually changes how exact OmniPlan is about scheduling tasks.
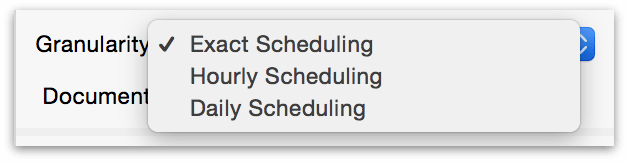
By default, OmniPlan uses Exact Scheduling: if you have a task with an effort of 58 minutes, starting at 8:00, then it is drawn exactly 58 minutes long on the Gantt chart, dependent tasks start at 8:58, leveling makes the resource begin working on the next task at 8:58, and so on. The start and end times of tasks are exact down to the second.
With Hourly Scheduling, start and end times happen at the next whole hour mark. A task starting at 8:00 with an effort of 58 minutes (or even 1 minute), ends at 9:00; successor and resource leveled tasks begin at 9:00, and so on.
With Daily Scheduling, start and end times are always pinned to the beginning or end of work days. The 58-minute task ends at the end of the day, successor- and resource-leveled tasks begin on the next day, and so on. The one exception to this rule, however, is if start times have been set before switching to daily granularity. In that case, the task would start at the specified time on its assigned day in the schedule.
Regardless of the granularity setting, OmniPlan doesn’t forget any of the values you enter. You can still specify task effort and resource units with any amount of precision, and OmniPlan stores those values in case you switch back to exact scheduling.
Quick Look Preview Settings
The final option in this part of the inspector is a switch that controls whether a Quick Look preview of your document is created when you save the project.
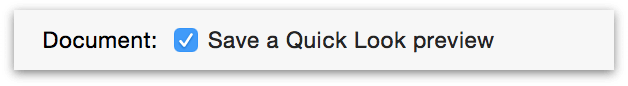
On most modern Macs this process won’t noticeably impact your use of the app, but if you encounter performance issues when saving, turning off Quick Look previews may improve the experience.
Choosing Time and Currency Formats
You can use the Formats section of the Project inspector to define how your project displays units of time and currency.
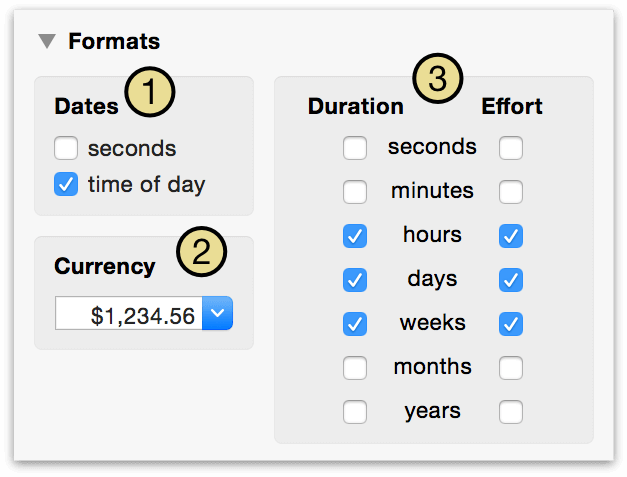
-
Use the Dates section to choose whether to include seconds, the time of day, or both in your displayed dates. Note that this doesn’t affect task scheduling or durations; just how dates are displayed in locations they appear across your project.
-
Choose a standard Currency format from the dropdown list, or just type the currency symbol of your choice and the field will auto-fill with the appropriate format.
-
Time units selected here are used to display durations and amounts of effort. You can plan in hours, days, or whatever works best for you.
Note that, in duration fields, if you enter a number without any units, OmniPlan assumes the smallest unit enabled here. Units of time (Duration and effort) are designated throughout OmniPlan with the following abbreviations:
- s = second
- m = minute
- h = hour
- d = day
- w = week
- mo = month
- y = year
If you want to go further than just customizing the display of durations, you can have OmniPlan schedule in whole hours or whole days with the scheduling granularity setting in Project Info. Note that the date headers in the Gantt chart and resource timelines can also be customized with the Display preferences.
If a value contains a unit of time that is too small to be displayed, you may see a rounded value. For example, if you have turned off the display of minutes in the Formats section of the Project inspector, and you have a task that starts at 9:00 and ends at 9:55, the value you see is < 1h. If you want to know the actual value, you can turn on the smaller units in Formats section, or just check the start and end times of the task. If you want to edit the value to conform to your units, you can just delete the greater-than or less-than sign and the value updates.
Setting Effort Unit Conversions
When you’re not using a standard 40 hour work week or eight hour work day, you can customize your project’s standard units of work-per-time using the Effort Unit Conversions section of the Project inspector.
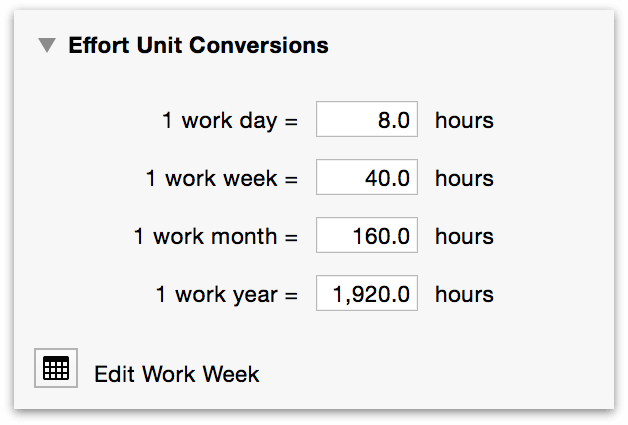
Your work day may be any number of hours. These conversion factors determine how to add up hours into the larger units.
Once you’ve decided on the unit conversions you want, you may find you need to edit the work week to correspond to the new values and ensure enough person-hours are scheduled. The Effort Unit Conversions section includes a handy link to Calendar View where you can do just that.
To reiterate: the effort conversion factors don’t change the working hours for the project, just the way durations are entered and displayed. To change working hours for the project, visit the Calendar View to edit the project’s Normal Work Week.
The Milestones Inspector
Manage milestones and the display of their critical paths with the Milestones inspector.
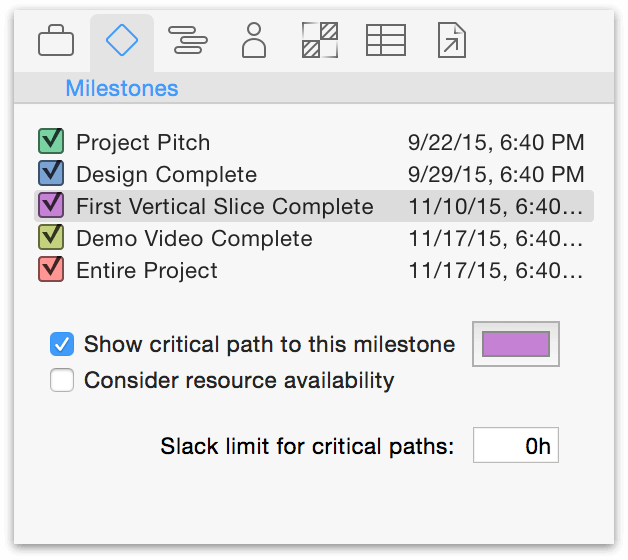
Use the check boxes next to each milestone to toggle display of its critical path in the Gantt chart and Network View. (You can also choose which critical paths to display from the drop-down menu off the Critical Path button in the toolbar.)
When you first choose to show the critical path to a given milestone OmniPlan will automatically assign a color to it; you can change the color by clicking the color selection swatch next to the Show critical path to this milestone switch.
Choosing to Consider resource availability makes the display of critical paths take into account not only the dependencies between tasks and the slack limit, but also whether the necessary resources are available to complete tasks that are otherwise independent.
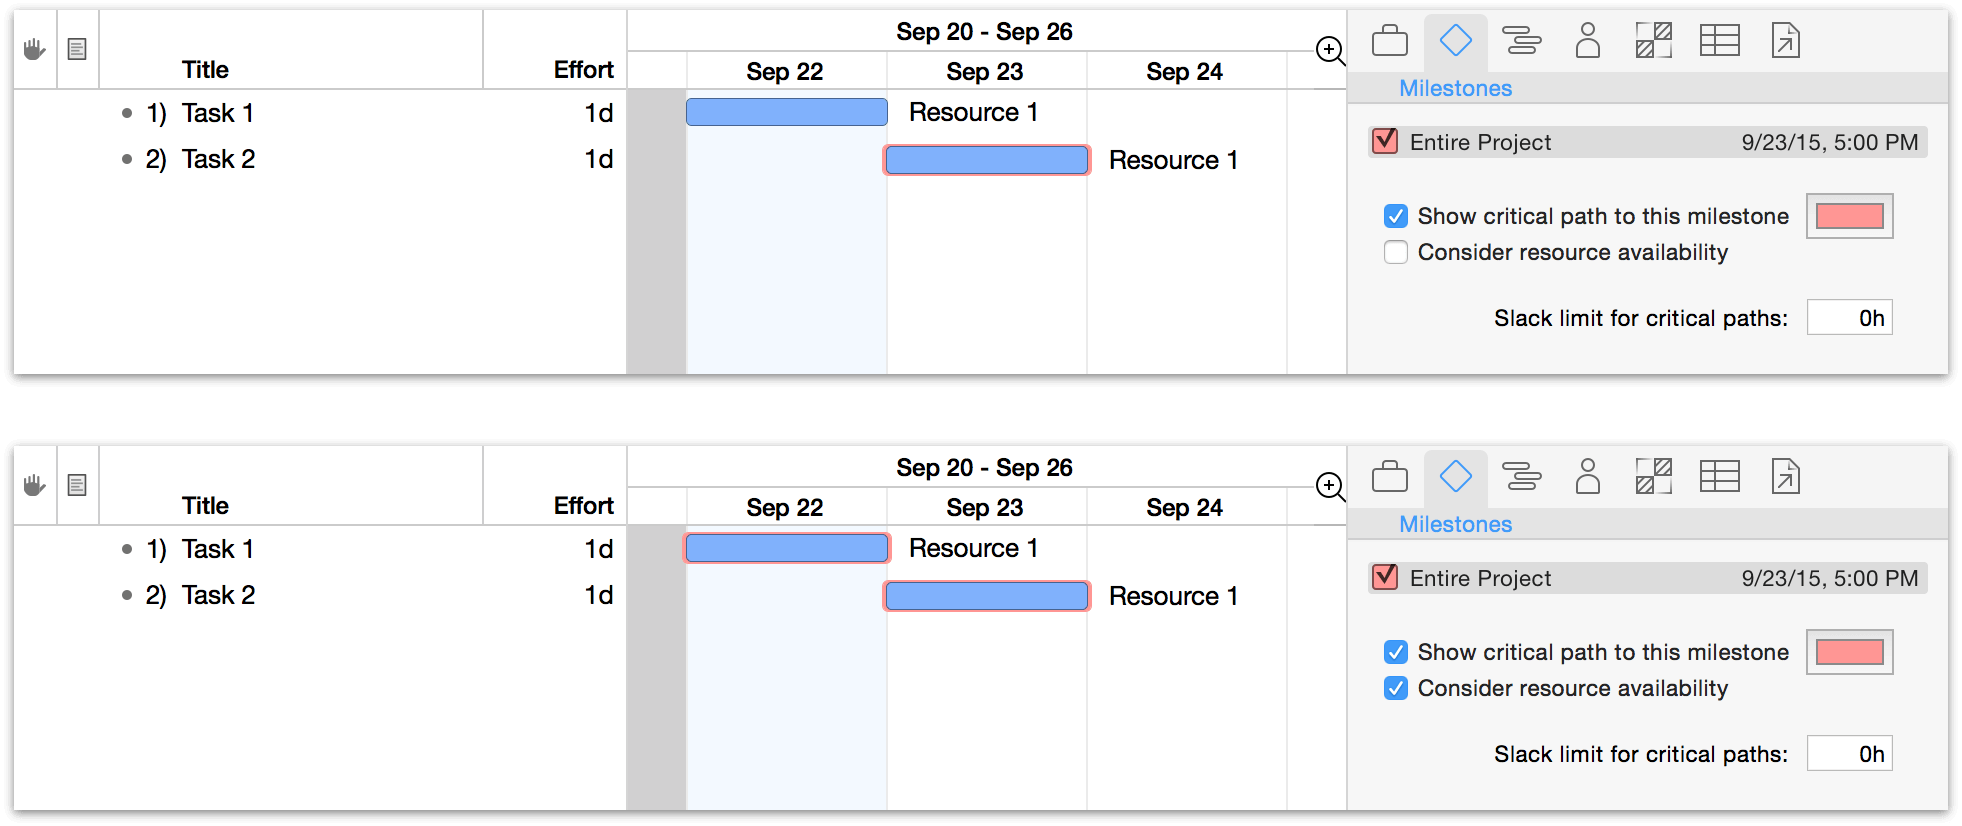
The clearest way to see how this works is to create a project with two independent tasks, and assign the same resource to both of them. Level the project, and you’ll see the second task move to follow the first. At this point, showing the critical path will only highlight the second task (1). Choosing to consider resource availability will highlight both (2), illustrating that while the second task doesn’t rely on the first to begin, it’s constrained by the resource required to complete it.
The slack limit for critical paths determines how closely a task can come to pushing a milestone back before it is considered part of the critical path. Increasing the time value here broadens the scope of critical paths to potentially include more tasks. In other words — the higher the value, the less comfortable a time cushion between tasks will feel.
The Task Inspector
The Task Inspector has information about any currently selected tasks (milestones, groups, and hammock tasks all count as tasks).
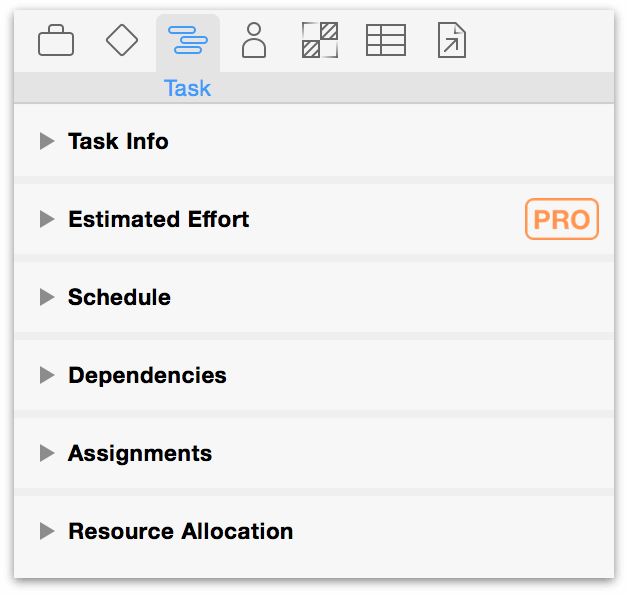
- Task Info — General info about the selected task, such as when it’s scheduled and how long it will take.
- Estimated Effort (PRO) — Used with the Simulations feature of OmniPlan Pro, manually configure estimations of effort here.
- Task Schedule — Info about the selected task’s schedule, like its start and end dates, and how it should be affected by leveling.
- Task Dependencies — A list of the dependencies this task is involved in.
- Task Assignments — A list of the resources assigned to this task.
Editing Task Information
Key attributes that define the type and scope of a task can be edited using the Task Info section of the Task inspector.
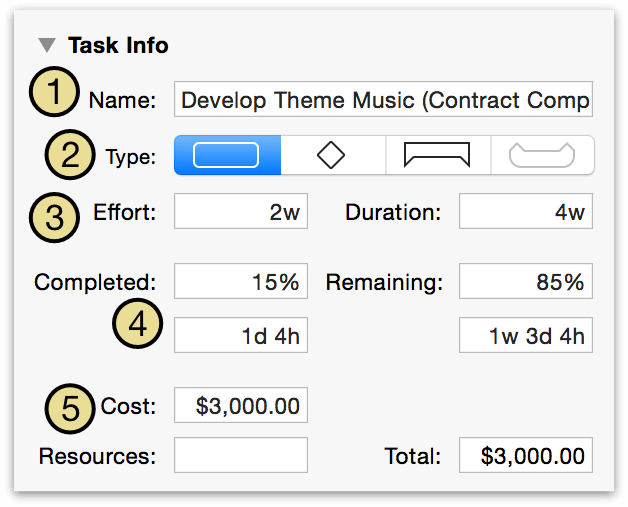
-
The task Name is the same as the one that appears in the task outline.
-
You can change the Type from a normal task to a Milestone (a zero-length event which represents an important moment in the project’s life), a task Group (which can contain child tasks), or a Hammock Task (one whose duration varies based on the completion of the preceding task and the start of the task that follows).
-
Effort is how much total work it will take for this task to be complete. Duration is how much time it will take to get that work done. These can differ based on how many resources are assigned to the task, and the efficiency of the assigned resources. Note that if you enter a number without any units, OmniPlan assumes that you mean the smallest enabled unit in the Project inspector’s Formats section.
-
The amount Completed is a percentage of how far along the task is. This is also displayed as shading on the task bar in the Gantt chart. You can adjust this manually by dragging the slider or entering a time in the field.
-
The task Cost is how much money the task takes to complete. The resources are the per-use or per-hour costs of resources assigned to the task.
Estimating Task Effort (PRO)
The Effort Estimation feature of OmniPlan Pro works in tandem with Monte Carlo simulations to forecast the timeliness of milestone completion.
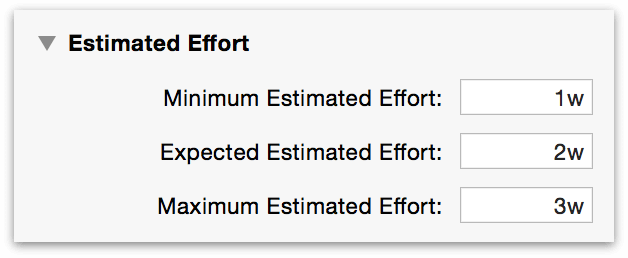
You can use the Simulations button in the toolbar to auto-estimate the effort required to complete any number of selected tasks. However, if you’d prefer fine-grained control over the range of effort used in completion scenarios, this section of the Task inspector provides fields for using any values you’d like.
In OmniPlan 3, values for Effort throughout the app (including the Effort column in the Task outline, the Effort field in the Task inspector, and others) are calculated based on the average of the three values in the estimated effort fields above. As long as the average remains equal to existing values elsewhere you won’t see them change (the Simulations automatic effort estimation feature is built to ensure this). However, manually changing the values here (or in the associated custom columns) will cause other effort values to change.
Scheduling Tasks
The Schedule section of the Task inspector describes where the task is positioned in time — both actually, and relative to the baseline — along with other temporal constraints and scheduling priorities.
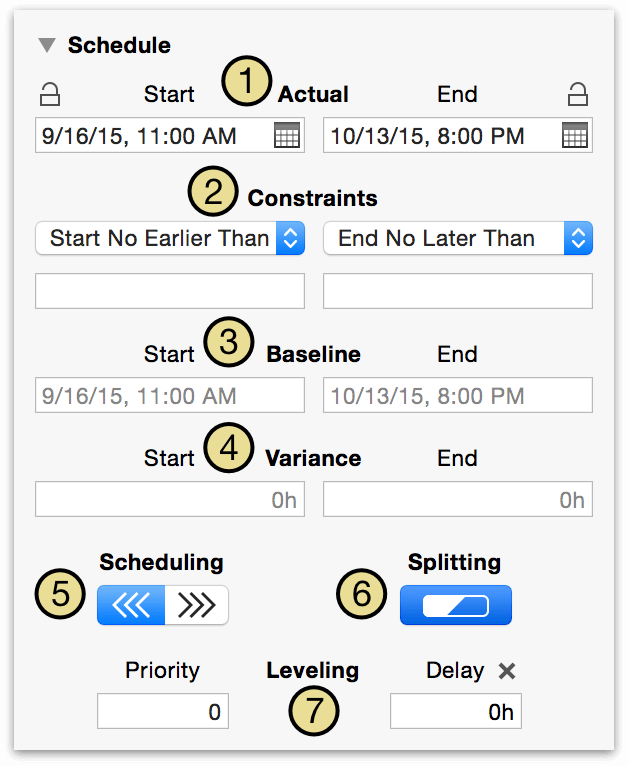
- The Actual start and end dates are when the task really happened during the execution of the project. These can be locked against accidental editing, changes from dependencies, and leveling.
- Constraints indicate the earliest a task may begin and the latest it may end. Select a date field below to show a calendar icon at its right; click it to summon a mini calendar you can use to choose a date and time for the constraint.
- The Baseline start and end dates indicate when the task is expected to start and end, according to the original plan. These appear once you use the Set Baseline command on a project.
- The Variance shows how much the actual dates differ from the baseline dates. This is calculated automatically; you don’t have to enter it yourself.
- Use Scheduling to choose whether the task is scheduled as soon as possible (ASAP) or as late as possible (ALAP).
- When leveling, if Splitting is allowed the task may be divided into multiple parts to maximize efficiency of resource use. Otherwise the task will be scheduled as a contiguous time span.
- Use the Leveling controls to set a priority for the task; this determines the order in which tasks are assigned resources when leveling. Delay is a value set automatically in the leveling process that notes how long a task has been postponed to wait for resource availability.
ASAP and ALAP scheduling can be set both for individual tasks and at the project level. This is also referred to as setting the direction of the task or project.
While tasks in most projects with defined start dates are scheduled to begin as soon as possible, individual tasks may benefit from ALAP scheduling when completing them later would be advantageous (some marketing work, for example, may benefit from a product being as fully developed as possible before it begins).
Describing Task Dependencies
Use the Dependencies section of the Task inspector to get an at-a-glance view of the selected task’s relationship with other tasks in the project, alter or remove dependencies on the fly, and add lead or lag time to related tasks.
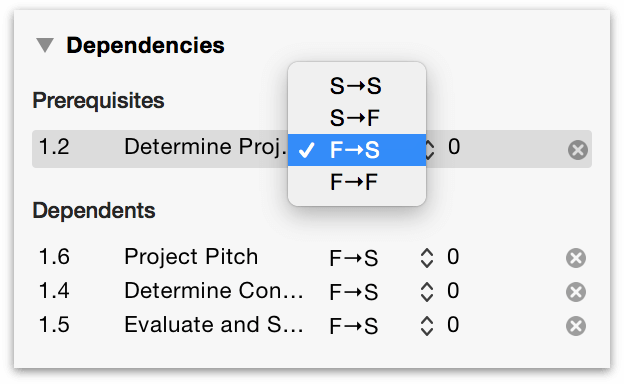
The Prerequisites section lists tasks that must be completed before the selected task can begin, while the Dependents section lists tasks that rely on the selected task to be completed before they can begin.
Use the popup menu in each task’s row to change the type of dependency between it and the selected task, or click the X to the right of the task to remove its relationship with the selected task entirely.
The column to the right of the dependency type popup menu lists the Lead Time for each prerequisite or dependent task. By default this is zero; double-click the number to add lead or lag (with a negative number) to the task. Lead time is calculated from the project’s work hours, unless an e (for Elapsed Time) is entered before the value; for example, 48eh.
Editing Resource Assignments
Use the Assignments section of the Task inspector to see what resources are assigned to the task, change the amount of effort a resource is contributing, remove existing resources from the task, and add new ones.
-
Double-clicking on an assigned resource name switches to Resource View with that resource selected in the Resource inspector.
-
Double-clicking on the X% out of X% field opens it for editing, which will change the percentage of the resource’s effort that’s devoted to the selected task.
-
Clicking the X next to the resource removes its task assignment.
-
Selecting a resource from the menu at the bottom adds it to the task at full effort.
If a resource that’s part of a resource group is assigned to a task, its group will be as well, but just as an informational marker; groups don’t have effort attributes, and can’t have their assignment directly removed. Resource groups shown in this way will disappear when all members’ assignments are removed from a given task.
Choosing How Resources are Allocated
When resources are being added to — or removed from — work on a task, the way the task is automatically rescheduled depends on the setting chosen in this section of the Task inspector.
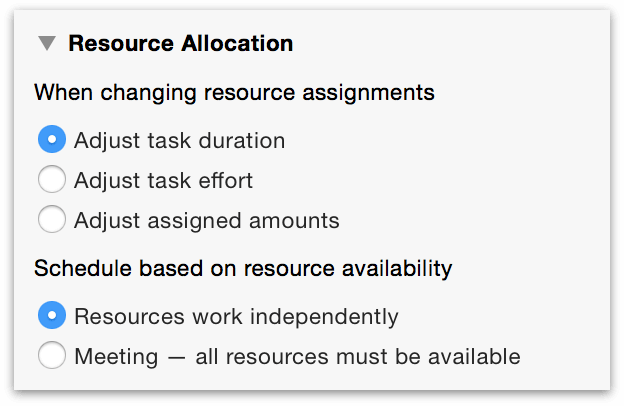
When changing resource assignments, the following options are available:
- Adjust task duration
- Adding new resources increases the effort available to complete them, and this option uses that effort to shorten the amount of time the task will take to complete. The opposite is also true, as removing a resource from the task will increase its duration.
- Adjust task effort
- Adding new resources keeps the duration the same, and adds the effort they contribute to the total required to complete the task — this represents pouring work into a fixed timeframe. Removing resources indicates that less effort is needed to complete the task in the same amount of time as originally planned.
- Adjust assigned amounts
-
With this option the duration and effort stay the same regardless of resource assignments. Instead, when new resources are added, the amount of effort asked of each resource is reduced evenly across the board (one resource contributes 100 percent, two resources contribute 50 percent each, and so on).
This section is also the place where the meeting task type can be chosen for the task. When a task is designated as a meeting, it will not be scheduled until all of the resources assigned to it are available — this is particularly useful for meetings, of course, but also any other task that requires the simultaneous attention of the team.
The Resource Inspector
The Resource inspector contains a summary of the properties of a selected resource, with fields for quickly editing them. See Working in Resource View for greater detail on how resource attributes are related to your project.
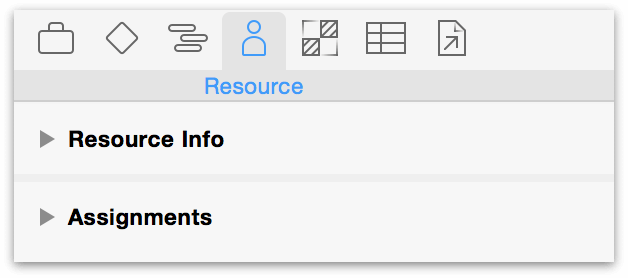
- Resource Info — General information about the selected resource, such as how much of it is available and how much it costs.
- Resource Assignments — A list of the tasks this resource is assigned to.
Editing Resource Information
The Resource Info section of the Resource inspector contains all of the vital details about a staff member, piece of equipment, or raw material used in completing your project.
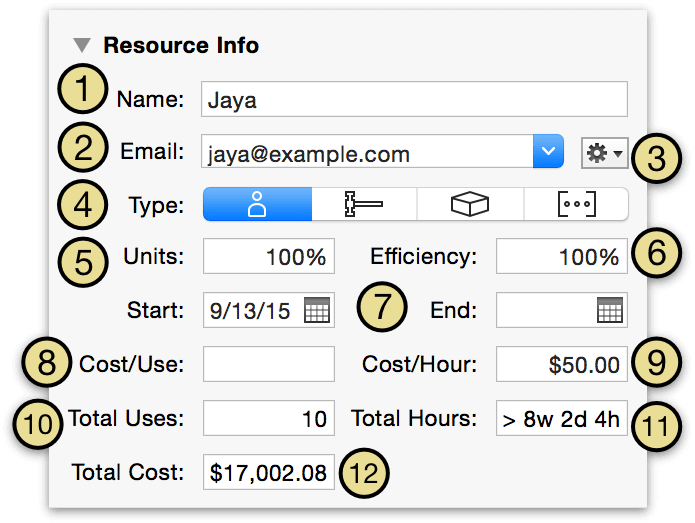
-
The resource Name is the same as the one that appears in the resource outline.
-
A staff resource can be assigned a unique Email address that serves as an identifier across projects. If the resource is associated with a macOS Contacts card, you can use the dropdown menu to pick which address to use.
-
Click the Gear button to associate this resource with a Contacts card, open the card in Contacts, or send an email.
-
The resource Type can be Staff, Tool, Material, or Group.
-
The amount of a tool or staff member’s time dedicated to the project (relative to their full time schedule) is expressed by the resource’s Units value.
For materials, Units describes the quantity of material used (based on the number of tasks the resource is assigned to) instead.
-
Efficiency represents the amount of effort-per-time a resource contributes to tasks to which it is assigned.
-
The Start and End dates determine for which dates the resource is available.
-
The Cost per Use is an amount of money for each time the resource is assigned to a task.
-
Cost per Hour is an amount of money for each hour of effort the resource is assigned.
-
Total Uses means the number of times this resource is assigned to a task.
-
Total Hours is the sum of the effort of all tasks the resource is assigned to.
-
Total Cost is the combined cost of all uses and all hours for this resource.
If you didn’t choose to grant OmniPlan access the first time you tried using the gear menu to interact with Contacts, you can grant it after the fact with Apple’s System Preferences ▸ Security & Privacy ▸ Privacy tab.
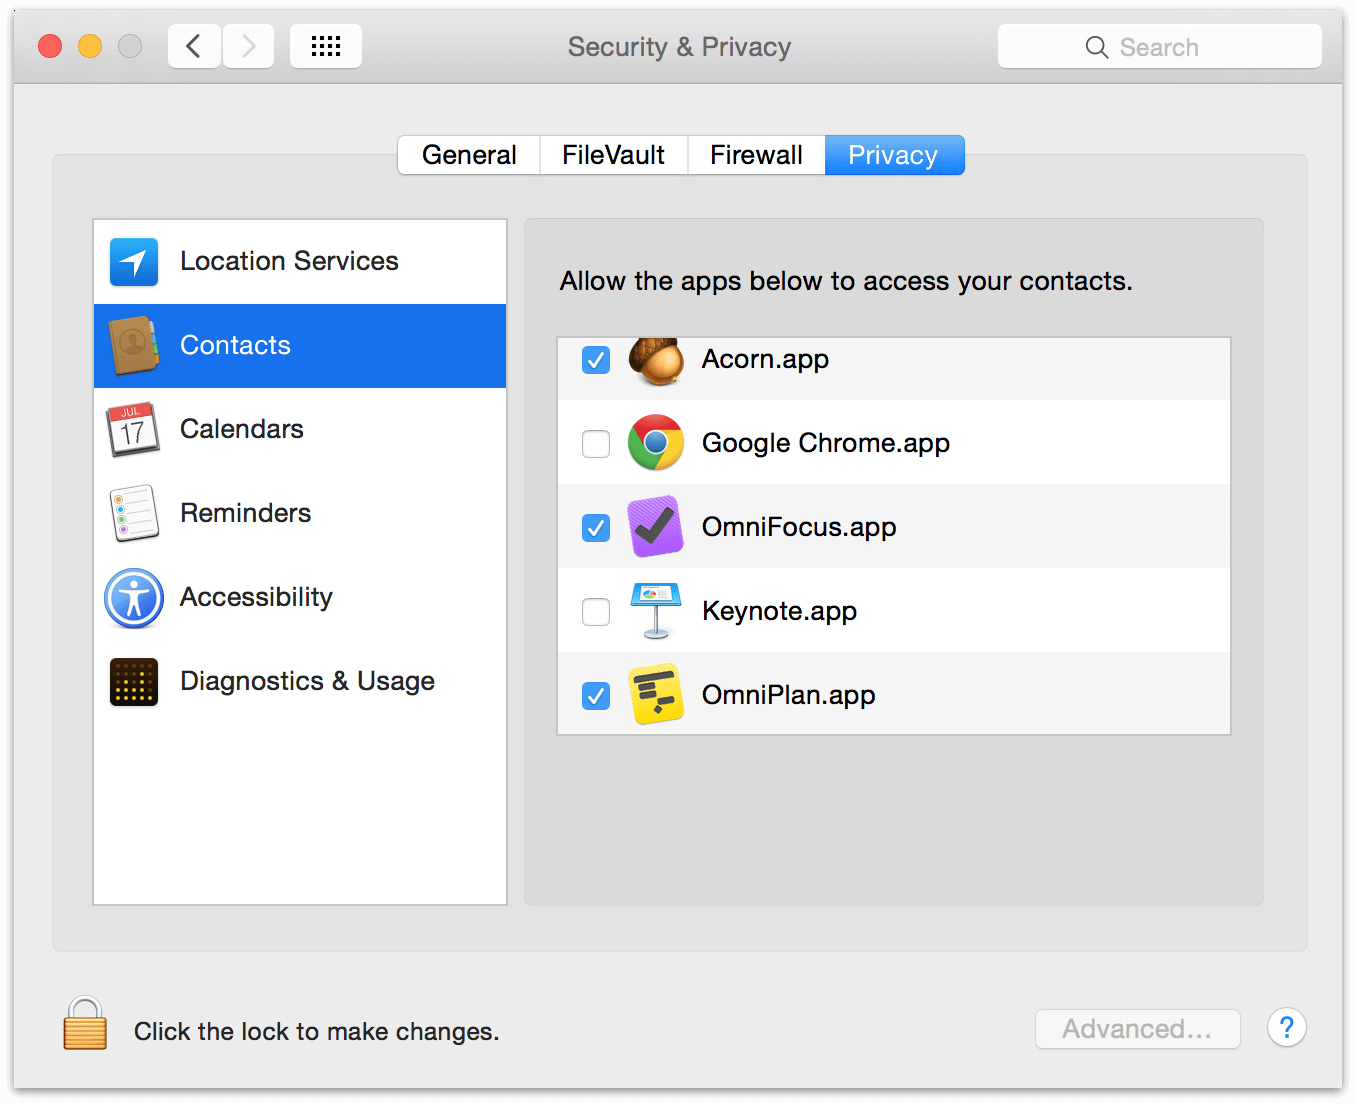
Reviewing Resource Assignments
Use the Assignments section of the Resource inspector to get a quick overview of all the tasks a particular resource is assigned to (or if multiple resources are selected, the intersection of their task assignments).
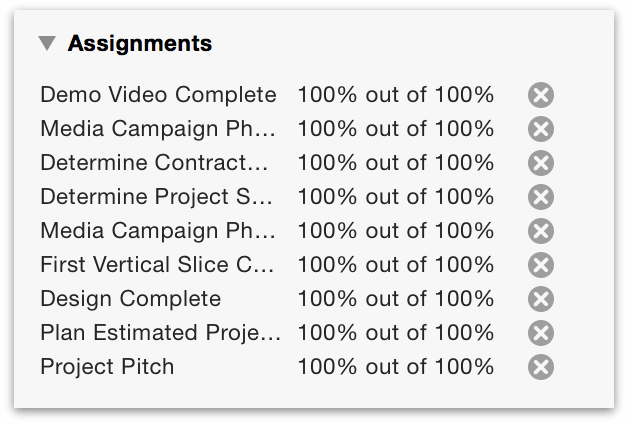
-
Double-clicking on an assigned task name switches to Task View with that task selected in the Task inspector.
-
Double-clicking on the X% out of X% field opens it for editing. The values here represent the percentage of the resource’s effort that is devoted to each task where the resource is assigned. The first of the two percentiles can be edited which will change the percentage of the resource’s effort that is devoted to the selected task.
-
Clicking the X next to the task removes it from the resource’s list of assignments.
The Styles Inspector
The Styles inspector is your window on the visual styles affecting the current selection, and provides tools for changing those styles on the fly. When you want to edit the appearance of a particular task or custom selection of items, this is a great way to quickly add some visual punch to your project; or if something’s looking a bit off, you’ll see what styles affect it and restore order with a mouse click.
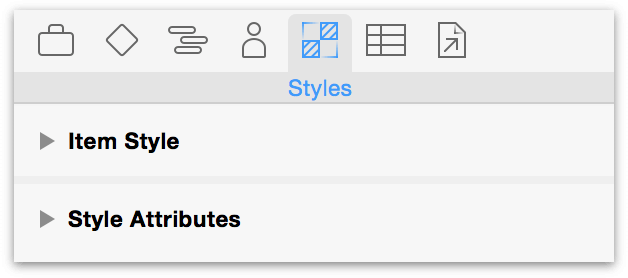
- Item Style — Tools for customizing the style of a selected task or resource on the fly, or assigning a named style to it.
- Style Attributes — A list of the styles currently applied to the selected item(s), and their sources.
If you’re setting up the visual theme of your entire project, the Styles inspector also acts as an editor when working in Styles View.
Applying Item Styles
You’ll use Styles View to apply styles to classes of items across your entire project, but if you’d like to apply a special named style to an individual item, select it and choose the style from the drop-down menu here. If you change that style later, those changes will update across all uses of the style in your project.
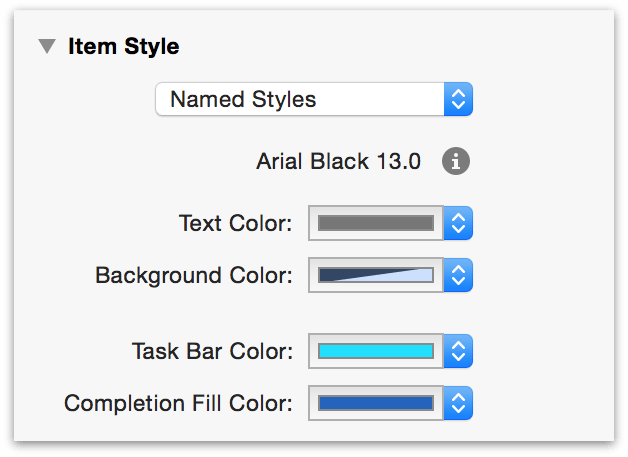
If you just want to apply a style to something without any special logic or updating, you can use the other controls in Item Styles to apply an ad-hoc style.
-
In the main window, select the items, or the part of a note, you want to style.
-
Use the controls in the Item Styles section of the Styles inspector to style the selected items.
Ad-hoc styles have higher precedence than any other type of style. If an item has an ad-hoc style applied to it, that style wins over any named styles or structural styles.
Reviewing Style Attributes
The Style Attributes section of the Styles inspector displays information about any custom text styles applied to the current selection, and allows styles to be copied (drag the style swatch from the inspector to an item in the current view) and removed (click the X to the right of the style in the inspector). It also indicates whether the style is applied to a class of items (such as Task Groups) or an individual item, and applies changes accordingly.
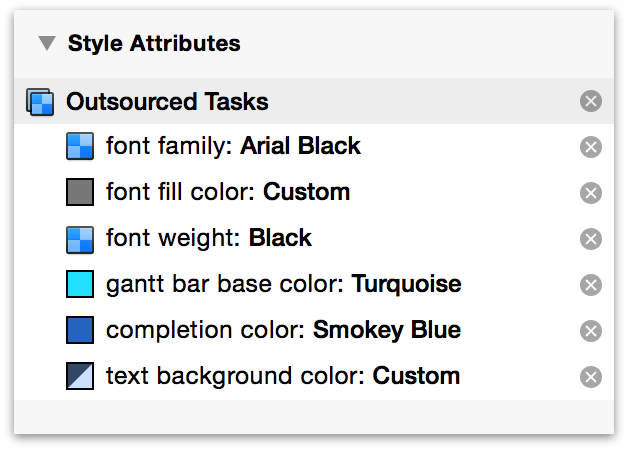
The Custom Data Inspector
Use the Custom Data inspector to keep your own information about the project or about individual tasks and resources. Select a task or resource to add custom data to it here; adding custom data with nothing selected will add it to the project as a whole.
Custom data is stored as key/value pairs. The Key is like a label for what type of information you are storing, and the Value is the information itself.
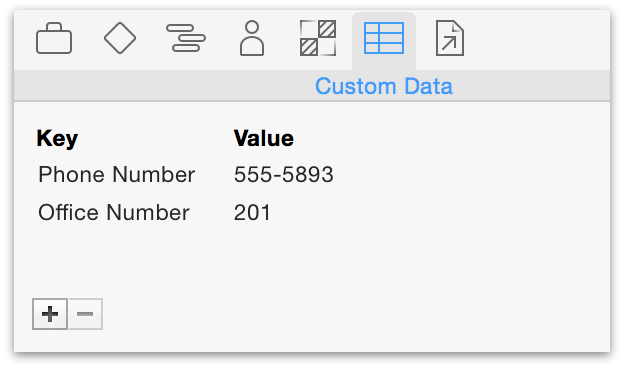
For example, here’s how you could keep track of staff members’ phone numbers:
- Select a staff resource in the resource outline, and open the Custom Data inspector.
- Click the plus button at the bottom of the inspector to create a new key/value pair.
- Name the key Phone Number.
- Enter a number as the value for the selected resource.
Now that you’ve created the key for this resource, every other resource has the same key, ready for you to enter a value.
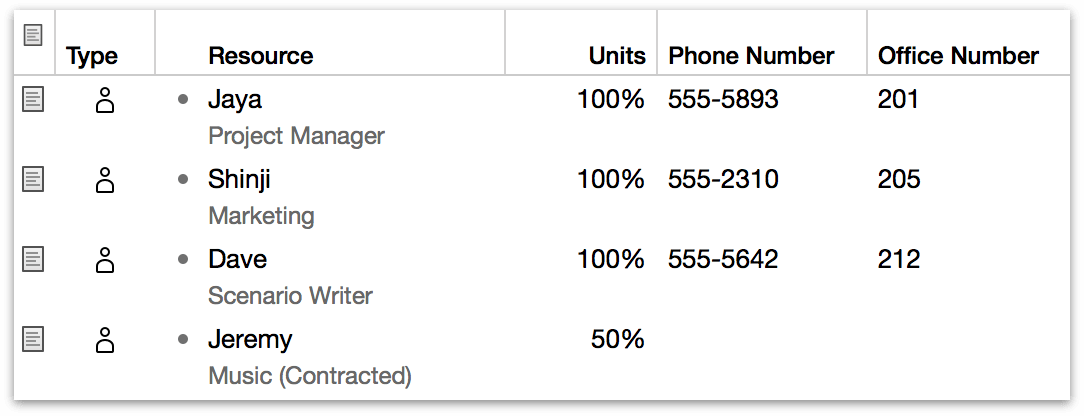
You can show custom data as a column in the task and resource outlines, or as a label in the Gantt chart and resource timeline, by choosing View ▸ View Options (Command-J).
The Attachments Inspector
Use the Attachments inspector to keep references to files that are relevant to your project or to particular items in it. Select a task or resource to add an attachment to it; adding an attachment with nothing selected will add it to the project as a whole.
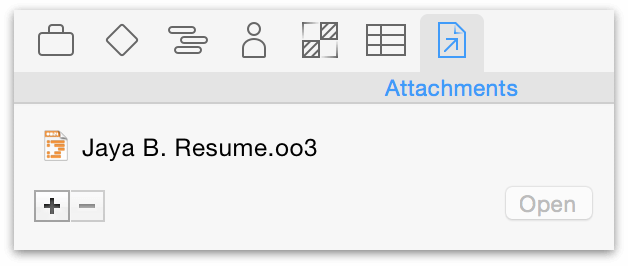
To link a file to an item in the task outline or resource outline:
- Click the item to select it.
- In the Attachments inspector, click the plus button below the attachment list, then choose a file in the dialog that appears. If you are showing the Attachments column in the outline, you could also click the arrow icon and choose Attach File from the pop-up menu, then choose a file. Or, easiest of all, just drag a file into the attachments list.
- The file appears in the inspector’s attachments list.
To attach a file to the project itself:
- Make sure nothing is selected in the main view.
- In the Attachments inspector, click the plus button below the attachment list, then choose a file in the dialog that appears. Or, just drag a file into the attachments list.
- The file appears in the inspector’s attachments list.
You can open an attached file by selecting it in the Attachments inspector and then clicking the Open button, or by choosing it from the pop-up menu in the Attachments column of an item’s row in the outline.
Every file attachment is a reference to the file elsewhere on your disk. If you move the files around, the references try to keep track of the new location. But if you are going to send a project to someone else, or otherwise move your project to another computer, the other files won’t automatically come along for the ride. In that case you should gather all of the attached files into one folder along with the OmniPlan file itself, and send the whole folder.
You can show attachments as a column in the task and resource outlines by choosing View ▸ View Options (Command-J), or by Control-clicking on the outline’s column header and choosing Attachments from the contextual menu.
Chapter 111
Importing and Exporting
OmniPlan works great as a standalone app, but its capabilities don’t end there. When you need to reach out to customers or colleagues across platforms, OmniPlan interacts with other apps and services in a wide variety of ways.
Importing from Other Formats
OmniPlan understands several other applications’ file formats. You can open files of these types in OmniPlan the same way you would open an OmniPlan document. The file is imported into a brand new OmniPlan document, which you can then edit, save, or export.
When it’s time to import a file other than an OmniPlan .oplx file (or with Pro, an .opld Dashboard file), choose File ▸ Open (Command-O), and be sure that Allow import of other recognized file types is checked in the Open dialog.
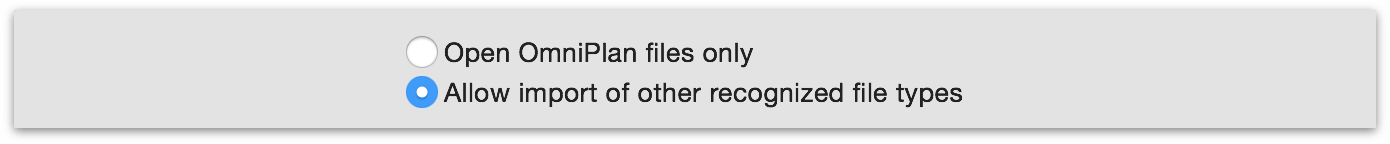
The following file formats are recognized and can be imported by OmniPlan 3:
- Comma-Separated Values (.csv) and Tab-delimited text files (.tsv)
- OmniPlan can read comma-separated or tab-delimited values from a plain-text file. To see how the data in a CSV file should be formatted, export an OmniPlan document as a CSV file and open the result in any text editor. Tab-delimited files are formatted like CSV files, except that tab characters are used instead of commas to separate fields.
- OmniOutliner 3 (.oo3 and .ooutline)
- Task lists can be imported from OmniOutliner files. A column mapping dialog appears, where you can choose which outline column should correspond to which field of task information. If the outline has multiple levels of hierarchy, task groups are created.
- OmniGraffle (.graffle)
- Task lists can be imported from OmniGraffle diagrams. The title of an object becomes the task title, and the hierarchy of connection lines determines the hierarchy of task groups.
Exporting to Other Formats
OmniPlan can write files in several formats for use with other applications. To export an OmniPlan file, choose File ▸ Export (Option-Command-E). When you export, a new file is created, leaving your original document as it is on the screen. Note that not all aspects of an OmniPlan document can be represented in all file formats; if you’re working in tandem with others, consider Publishing and Subscribing.
If you export a project while a filter is on, you can choose whether to export the entire project or only the contents that are visible.
- OmniPlan Document (.oplx)
-
Of course, OmniPlan can export to its own format. This is useful when you want to use the filtering feature to make a new OmniPlan file of tasks matching certain criteria — just filter the tasks and make sure that Only Filtered Contents is checked when you go to export the project.
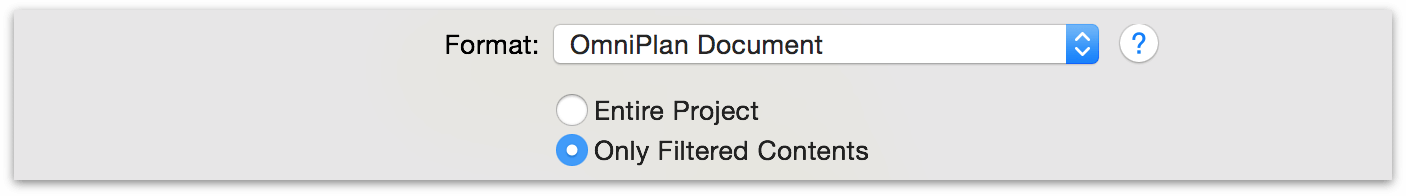
- iCalendar (.ics)
-
This is the calendar format used by Apple iCal, Apple Calendar, and many other calendar applications. You can choose to export the tasks as calendar events or as items on a to-do list. If you export calendar events, you can also choose whether each task should become to a single event, regardless of how long it may be (One event per task), or whether tasks should be broken into chunks when they span working and non-working hours (One event per work period).
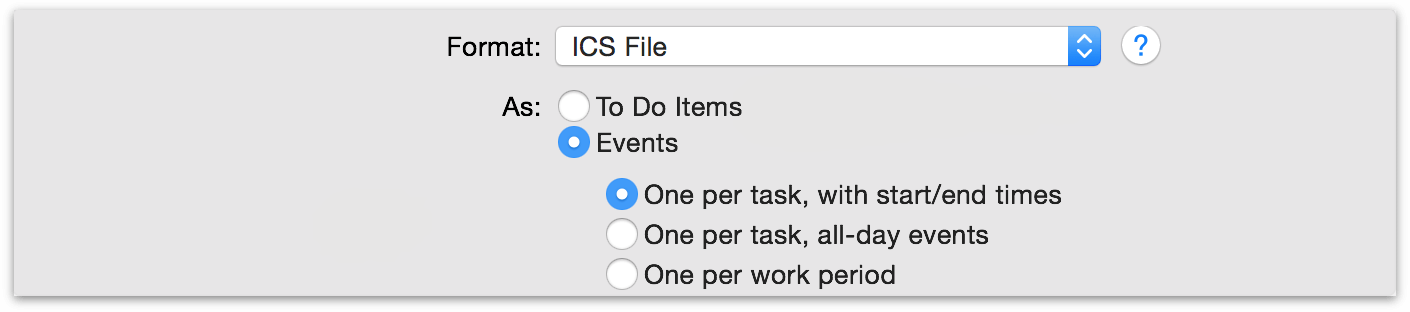
- Comma Separated Values (.csv)
-
CSV is a common, plain-text format that can be read by many different applications.
If you’re having trouble persuading other applications to read the non-ASCII characters in your CSV file, such as accented letters or non-Roman characters, try exporting with one of the other encoding options. This makes it easier for some applications to detect the correct encoding and interpret your characters properly.
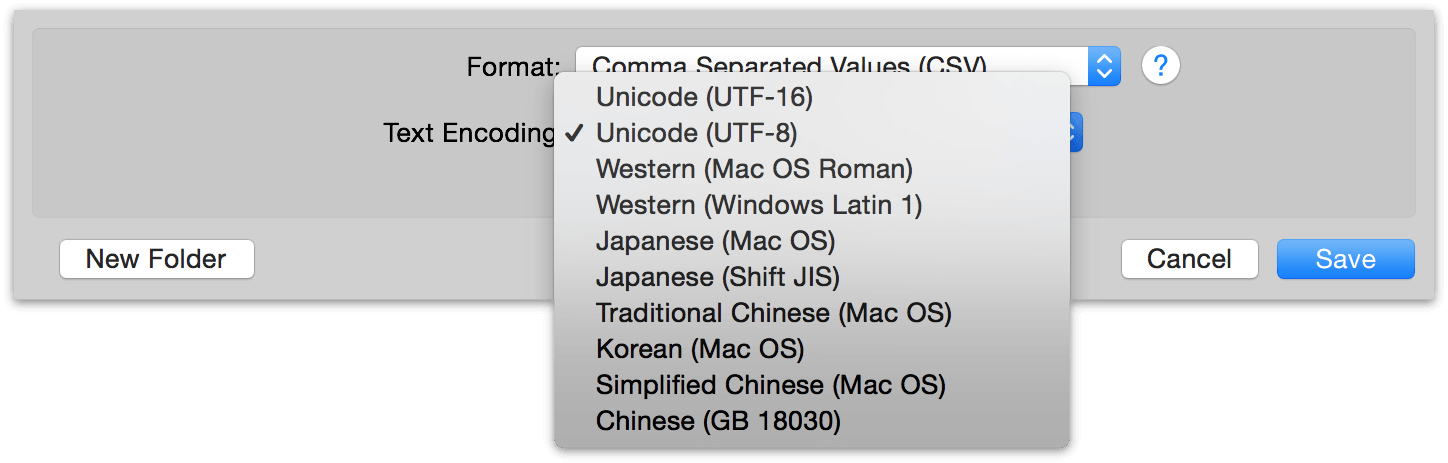
- Image Export (.png, .pdf, .tiff, .jpg)
-
You can export a picture of the task view or the resource view, whichever one is open in the main window. In the Export panel, you can choose whether the image should include the outline, the chart, or both.
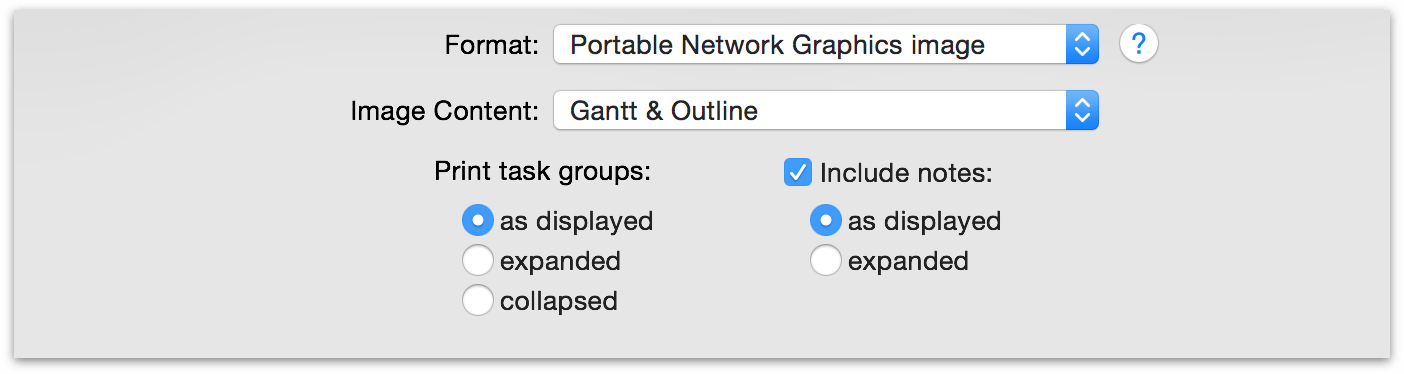
- OmniOutliner (.oo3)
-
The task outline is exported as an OmniOutliner file (supported by OmniOutliner 3 and 4), with row hierarchy that corresponds to OmniPlan’s task groupings and columns corresponding to those available in OmniPlan’s Task View. An OmniPlan project exported to .oo3 format opens in OmniOutliner 4 like this:
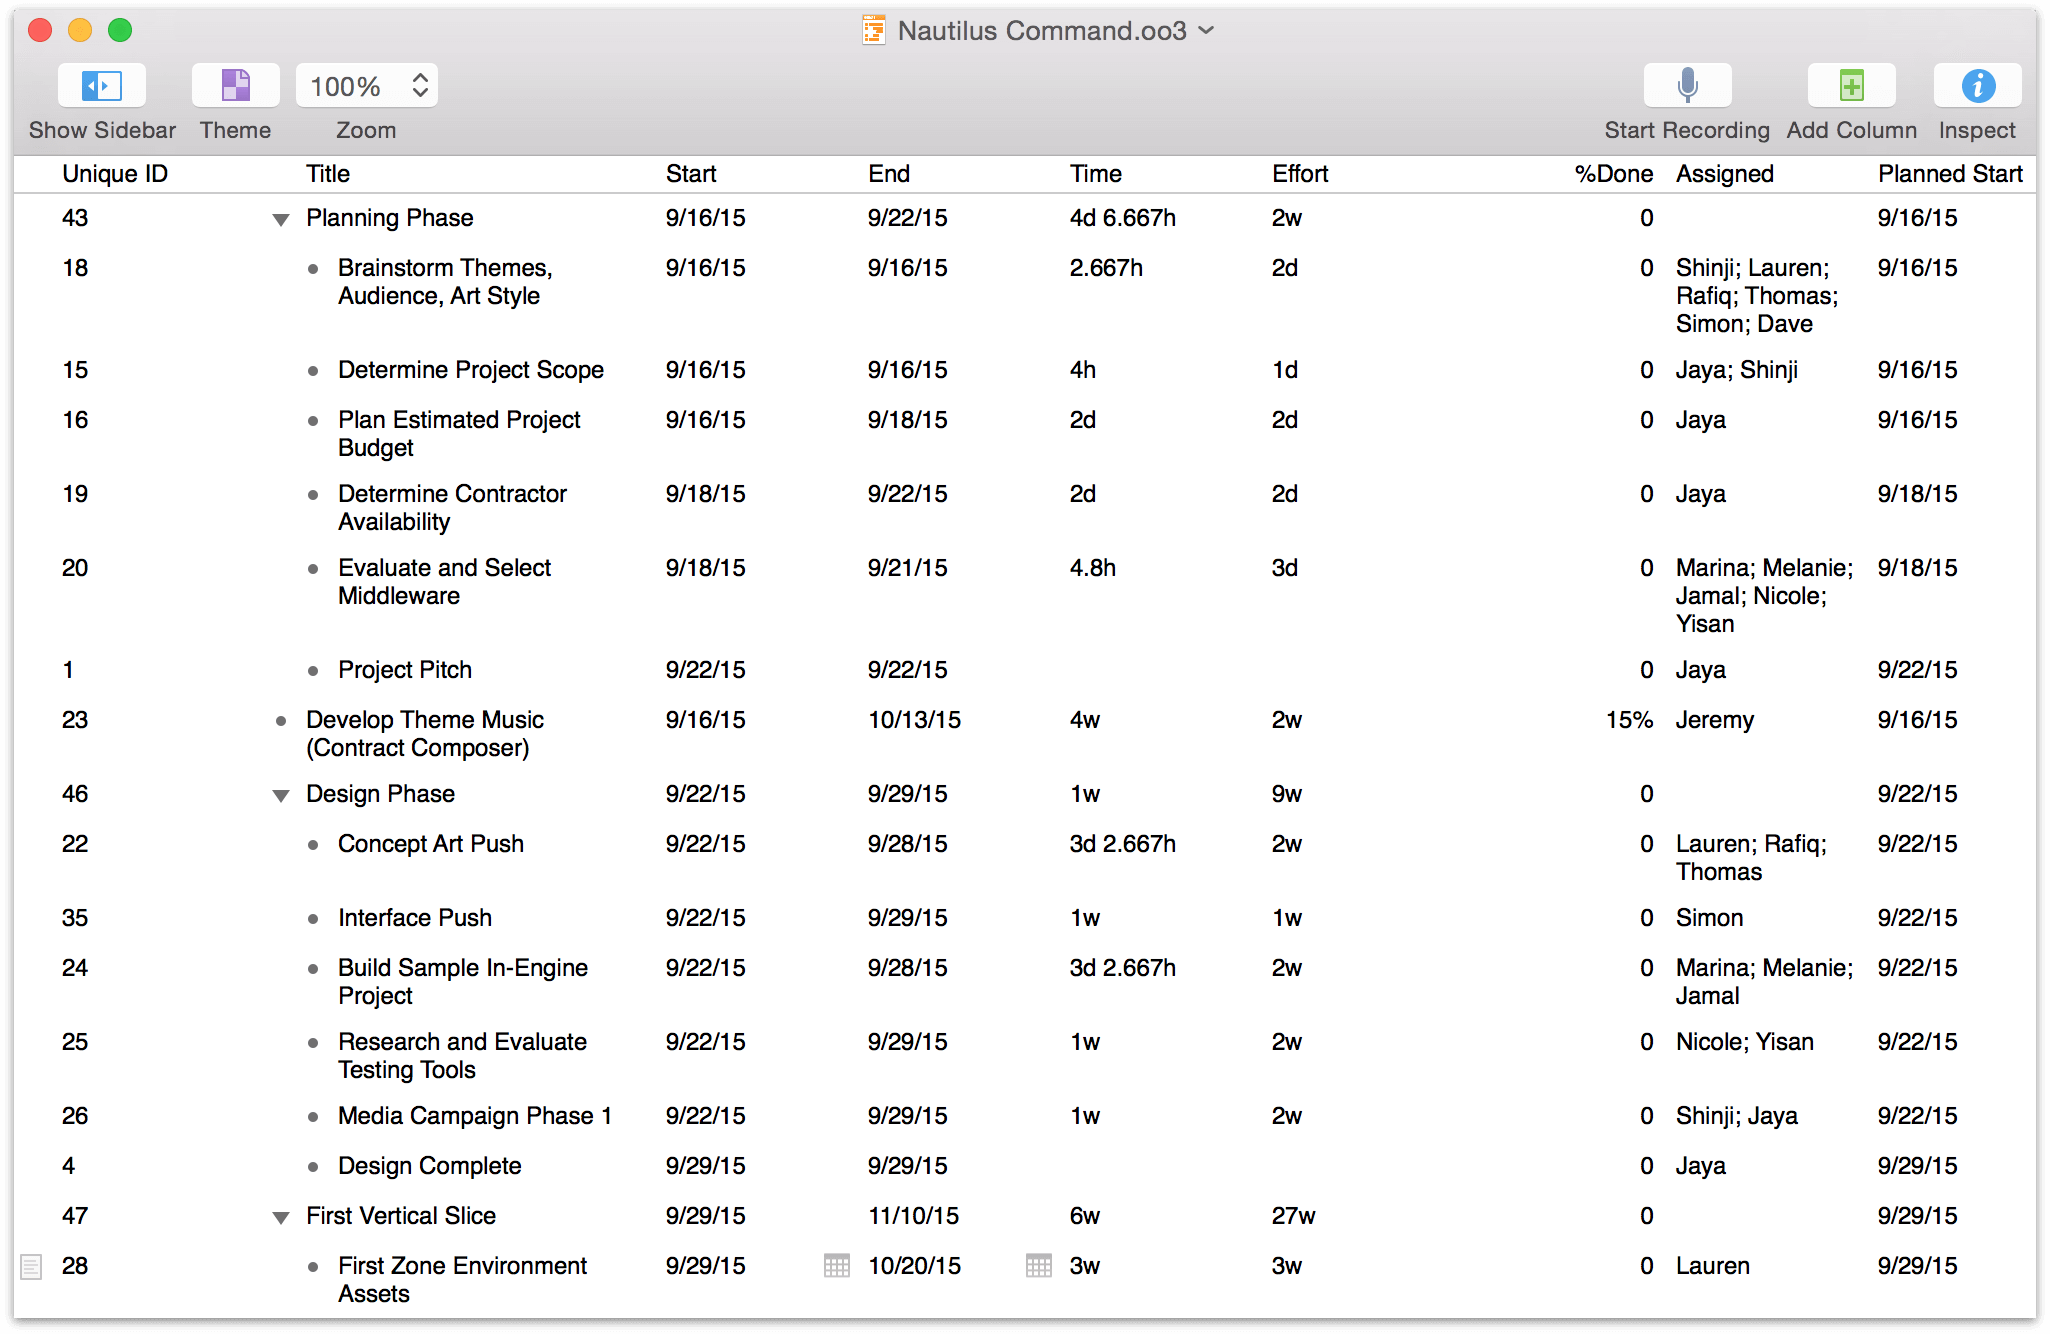
- OmniGraffle
-
There are several types of OmniGraffle export available across an array of diagram types and styles.

Available diagram types for export include:
-
Work Breakdown Structure — Tasks and groups are represented by a tree of objects. The connection lines in this diagram type represent the hierarchy of the task outline; dependency lines are not represented.
-
Activity-on-Node Network Diagram — Tasks are represented by objects, connected by dependency lines. While a Gantt chart emphasizes durations, this type of chart emphasizes the path of dependencies.
-
Activity-on-Arrow Network Diagram — Tasks are represented as lines between objects, with the title and duration of the task as a label on each line. Like the Activity-on-Node network diagram, this diagram type emphasizes dependencies.
-
When exporting to a Work Breakdown Structure or an Activity-on-Node network diagram, you can choose between two different node Styles: nodes that represent tasks as basic objects (which just show the task name) or as tables (which show the task name, assigned resources, start date and end date).
If you own OmniGraffle, you can style and edit diagrams exported from OmniPlan. If you don’t, you can use an unlicensed copy of OmniGraffle (available on Omni’s website) to view, print, or export them.
Microsoft Project Support (PRO)
If you’re ever called upon to reach across the aisle and use OmniPlan in tandem with Microsoft Project, there’s good news — OmniPlan Pro supports both export to and import from the vast majority of Project file formats.
Documents in the Microsoft Project XML or MPP formats created with Microsoft Project versions 2003 through 2016 can be opened by OmniPlan Pro. A newly opened Microsoft Project file appears in OmniPlan like this:
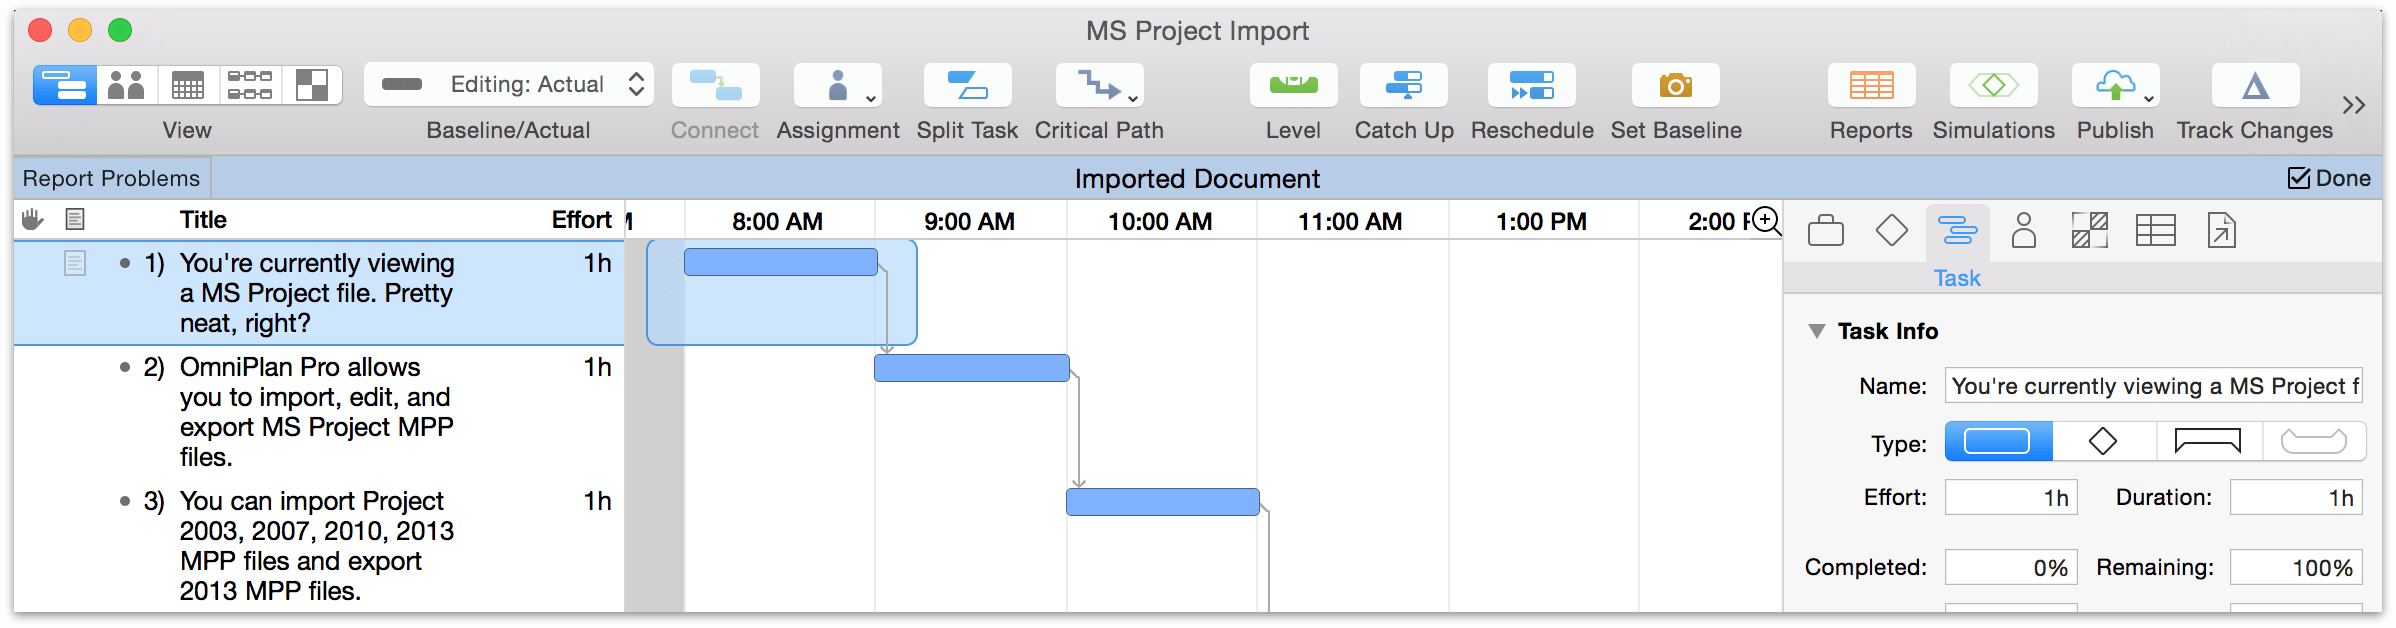
If errors show up in the document, you can use Report Problems in the blue Imported Document bar to let us know about them. Click Done to dismiss the bar and get back to work.
Along with importing from the most-used MS Project formats, OmniPlan Pro can output to them as well. The following Microsoft Project formats are supported:
- Extensible Markup Language (XML) and Microsoft Project Plan (MPP)
- Microsoft Project 2003 to 2016 can read and write these formats. MPP is the preferred format for most interactions with modern versions of Microsoft Project; as an open standard, XML is useful for interaction with other applications as well.
OmniPlan’s Microsoft Project MPP export is updated to be most highly compatible with the newest MPP format we support (that used by Microsoft Project 2016). MPP files generated by OmniPlan will still open in older versions of Microsoft Project, but may not be as fully readable to them.
Older versions of Microsoft Project may prompt you to download an update or converter from Microsoft to support the newer file format exported by OmniPlan.
Quirks in Microsoft Project Import and Export
OmniPlan is pretty good at working with Microsoft Project documents up to and including the Microsoft Project 2016 MPP format, and we’re always working to make it even better. There are a few things to note as you work with Microsoft Project documents in OmniPlan:
-
Assignments to Task Groups — In Microsoft Project, a resource can be assigned to a group of tasks. In OmniPlan, this just assigns the resource to all tasks in the group, not to the group itself. When you import a Microsoft Project document with an assignment to a task group, a warning appears in the violations column to let you know that the assignment was not imported.
-
Custom Columns — Many of the optional columns in the Task and Resource View outlines don’t have direct analogs in Microsoft Project, and vice versa. These columns won’t be displayed when importing from or exporting to the affected app, and data in them will be left behind as well.
-
Efficiency — Microsoft Project doesn’t support the OmniPlan efficiency attribute for resources.
-
Styling (Document, Tasks, and Resources) — Styles you apply to items in OmniPlan, as well as those for the project as a whole, aren’t carried along when you export to Microsoft Project formats.
-
Unequal Assignments — In Microsoft Project, if you assign more than one resource to a task you can specify how many hours of effort each assigned resource should contribute. If you don’t specify, it assigns however much work to each that will complete the task earliest (taking schedule and resource assigned units into account). OmniPlan always uses that same automatic method. So, a task with effort hours specified for its resources may take a different amount of time in OmniPlan than it did in Microsoft Project.
-
Overloaded Resources — When importing a Microsoft Project file, OmniPlan will not overload resources as it schedules tasks. If a resource is overloaded in the original Project file, the auto-scheduled dates will change to avoid overloading resources (allowing for a maximum of 100% utilization of any resource). Therefore, the initial scheduling of tasks with previously overloaded resources will differ from the dates in the Project file.
-
Tasks with ALAP Scheduling and Other Constraints — ALAP is a mutually exclusive status with other constraints on a task in Microsoft Project. When exporting an OmniPlan project as an MPP file, tasks that are marked to start as late as possible (ALAP) and have have another constraint applied will lose ALAP scheduling (and be reverted to the default ASAP) when exported to MPP. The other constraint will be preserved.
-
Inactive Task Status — OmniPlan lacks an equivalent of Microsoft Project’s “inactive” task status. Any tasks marked Inactive in an MPP file will have that status removed and be treated as regular active tasks when imported to OmniPlan (potentially affecting task scheduling and resource allocation).
Chapter 112
Reporting and Printing
When it’s time to share your project with colleagues or the outside world, in addition to exporting to a variety of formats, OmniPlan offers a robust and customizable set of printing features — and with OmniPlan Pro, an all-new interface for creating beautiful custom reports.
Printing in OmniPlan
OmniPlan offers a highly flexible set of options for printing your document straight from the standard print dialog of macOS.
Choose File ▸ Print (Command-P), and choose Show Details from the pop-up menu in the print dialog to see OmniPlan’s print options.
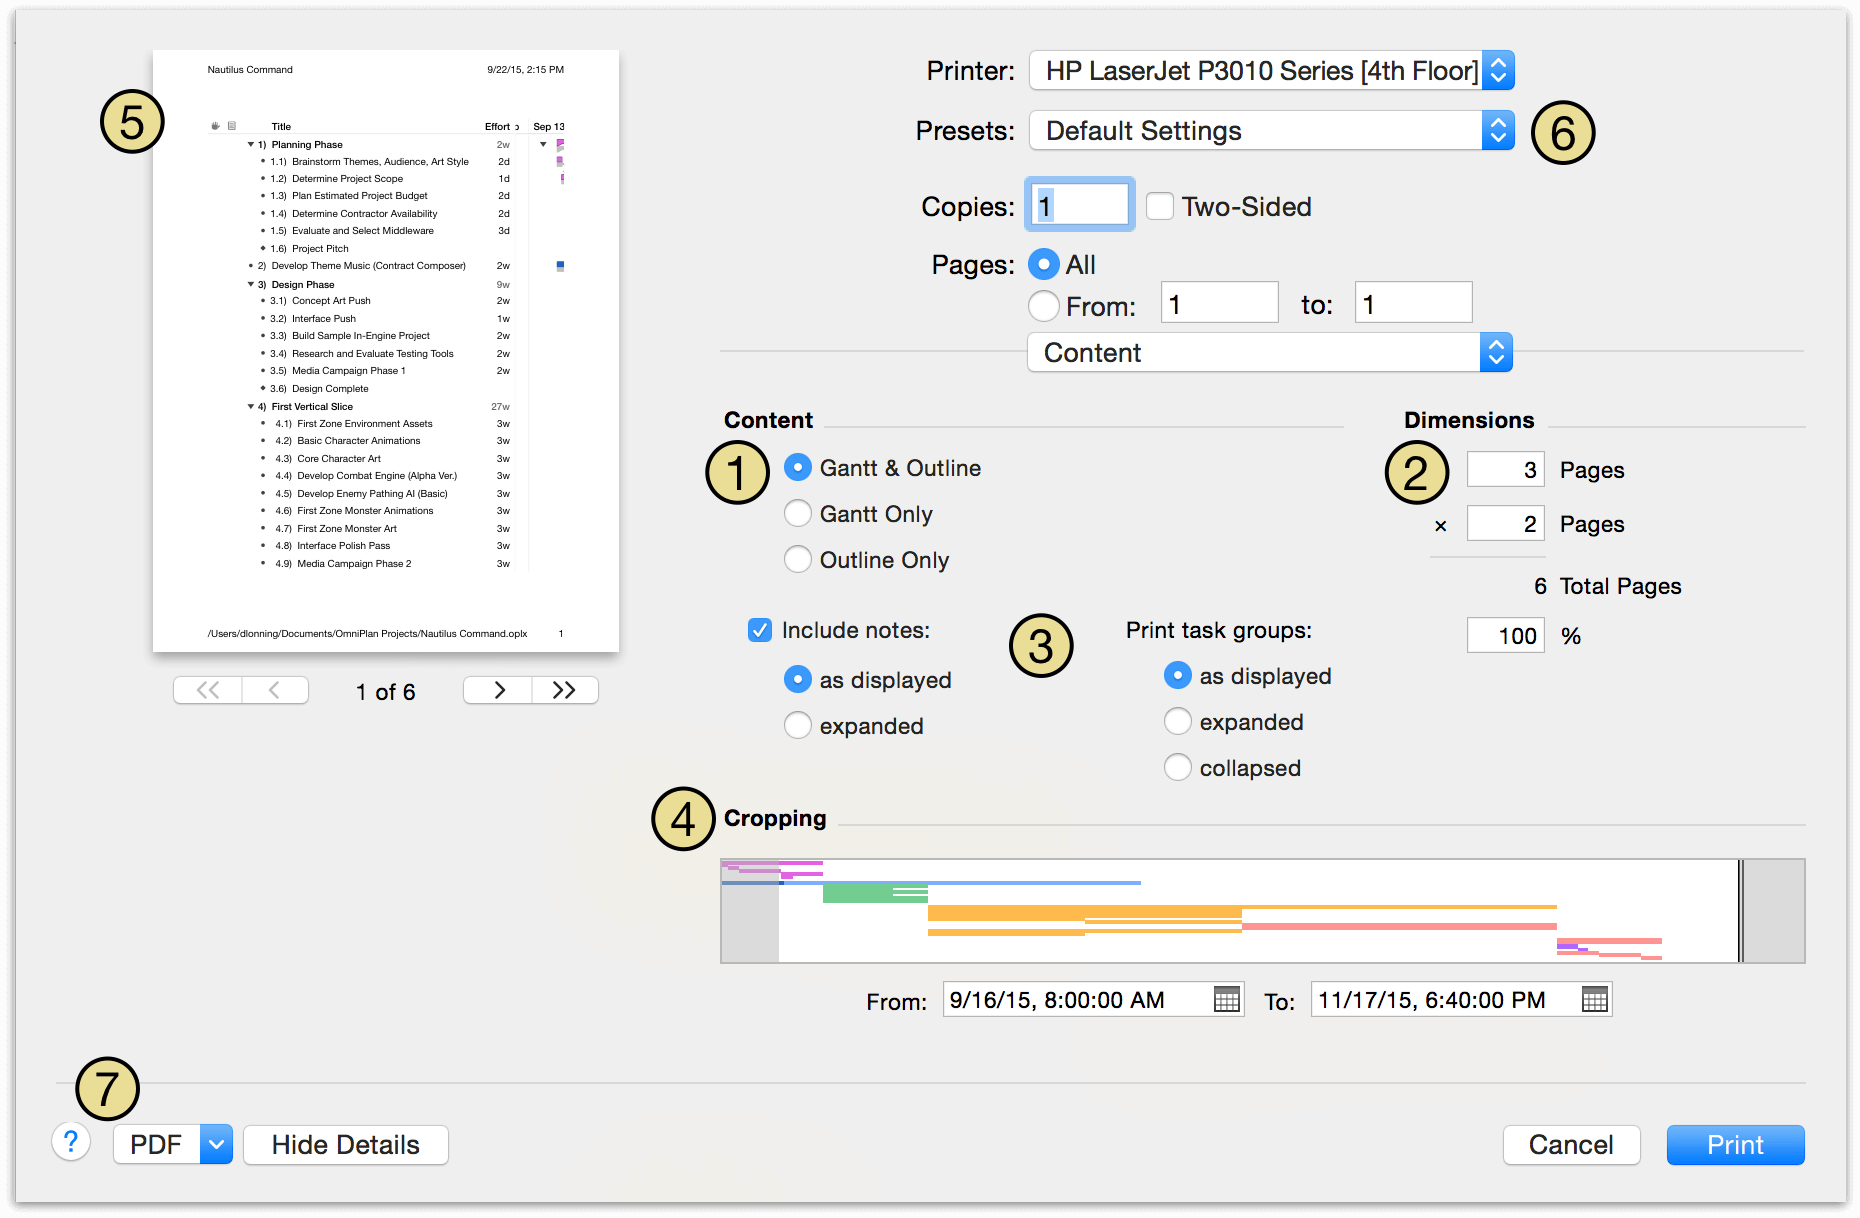
-
You can print the Task View, the Resource View, or the Network View — whichever one is open in the main window. In Task and Resource views you can choose whether to print the outline, the Gantt chart or resource diagram, or both; since Network View has no outline, you’re taken right to the headers and footers section instead.
-
The dimensions are calculated based on the size of the project and the scale set in the percentile field here. When you change the width or height, the other one changes accordingly. Note that this overrides the Scale setting in the Page Setup dialog. When printing in Network View, a Scale percentage setting is available in the headers and footers section.
-
You can choose whether to include notes when printing from the outline, either as displayed or all expanded. Task and resource groups can be printed as displayed in the project, or all expanded or collapsed.
-
You can use the Cropping settings to chop off any part of the project you don’t need. An overview of your project is here. To define the area to print, resize the cropping box by dragging its left or right edge, or move the box by draging its center. If you enter dates in the From and To fields, the cropping box updates to match.
-
The preview shows what your project will look like on paper. Use the buttons to step through the pages and get an idea of the scale and layout.
-
When you have your print options set up just the way you like, you can use the Presets menu to Save Current Settings as Preset. You can choose whether the preset applies to the currently selected printer or all printers, and view and edit your new preset — along with others — from Show Presets in the Presets menu.
-
As with other applications that use the macOS printing system, you can “print” to a PDF file instead of to real paper.
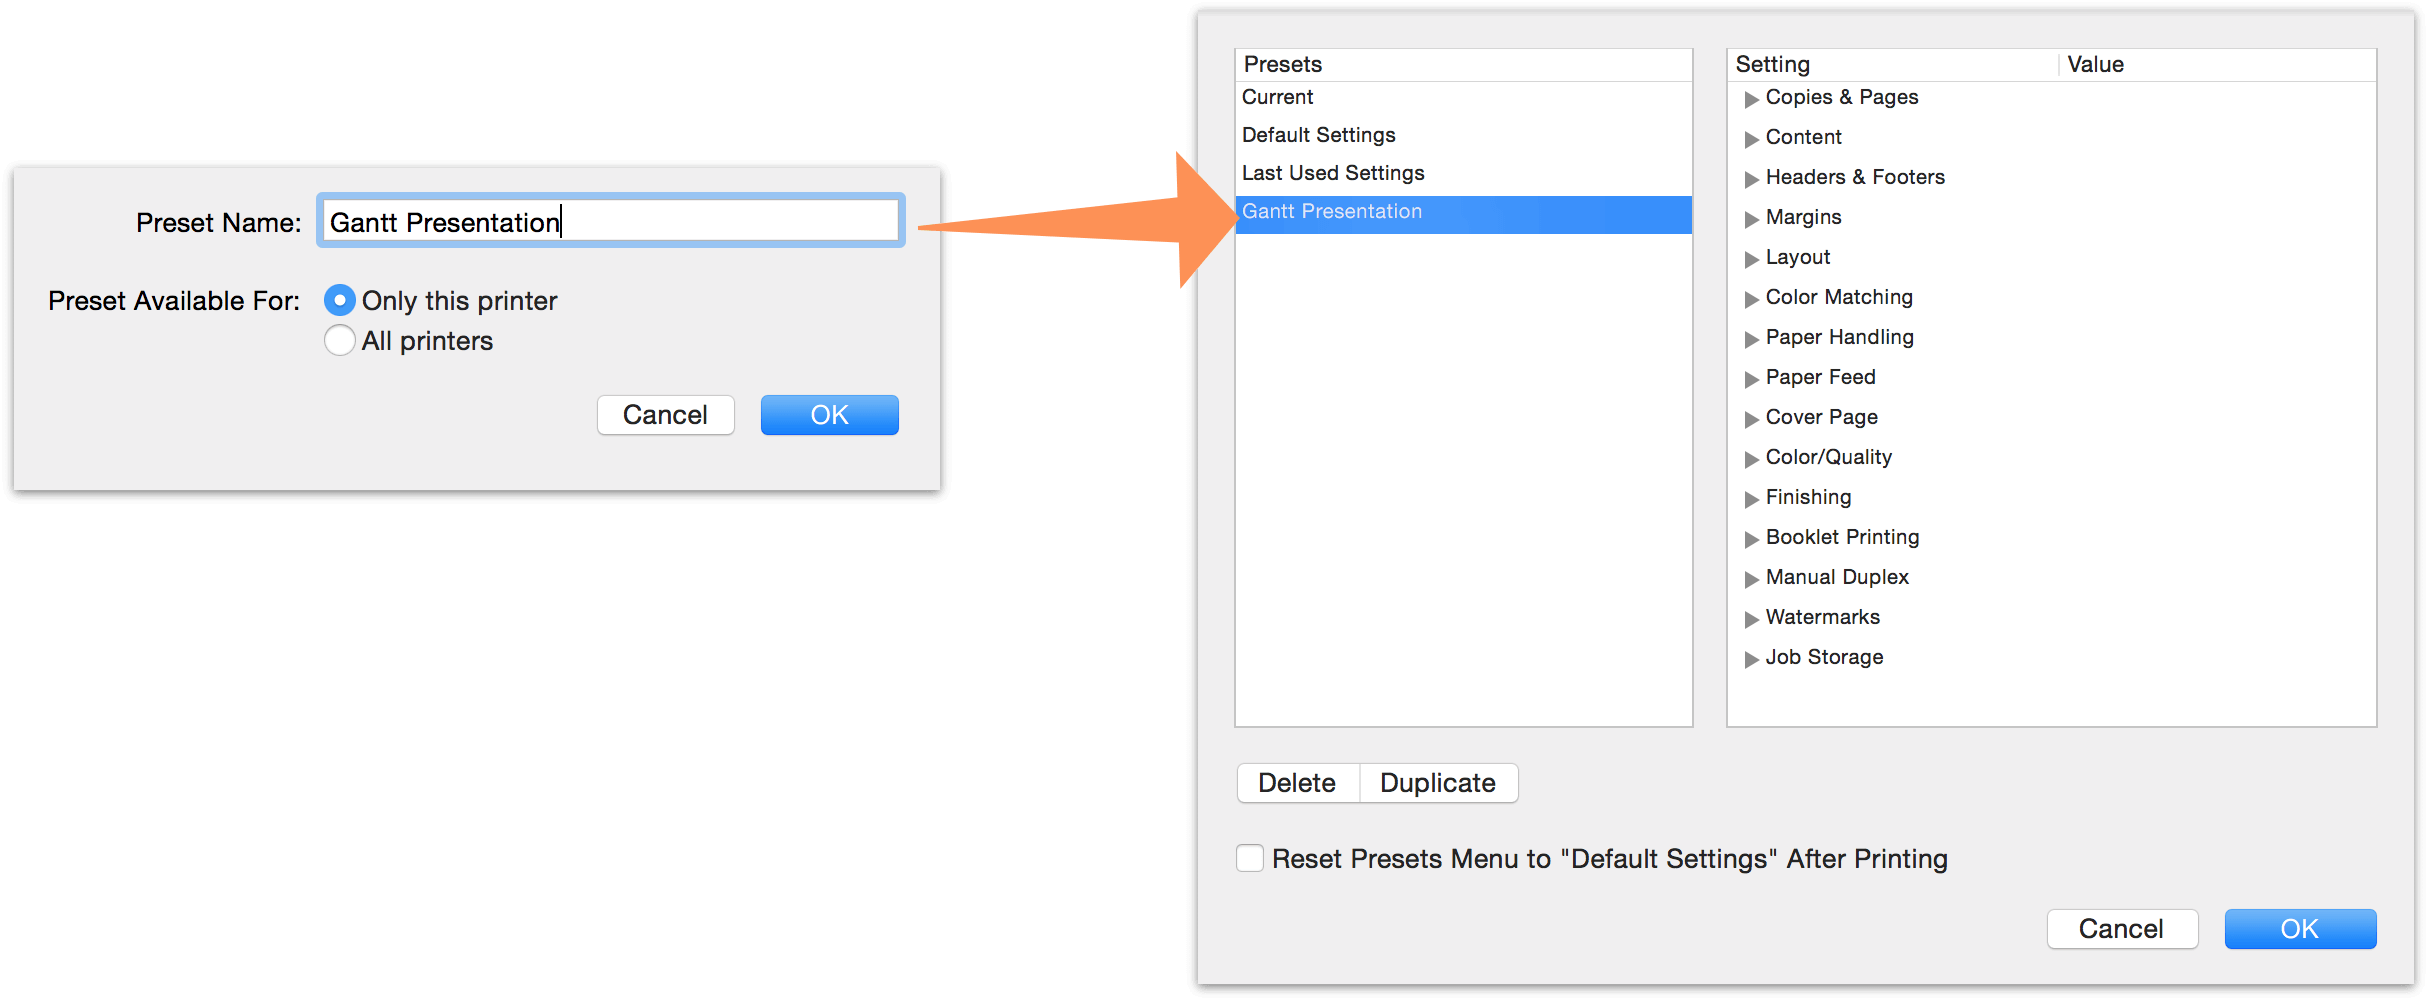
When printing from Network View, the scale of the diagram in the view itself determines the initial scale at which it will be printed via the print dialog. You can edit this with the Scale control in the print dialog, or by changing the scale in Network View (Use (-) and (+) or the zoom controls in the bottom right corner of Network View to zoome out and in).
In addition to the print dialog options described above, OmniPlan supports the standard macOS Page Setup dialog; choose Page Setup from the File menu to access it. You can set the paper size, print orientation, and document scale here; this information is saved with the document.
Customizing Headers and Footers
Headers and footers can be customized extensively for printing by choosing Headers & Footers from the dropdown menu in the Print dialog’s detail view.
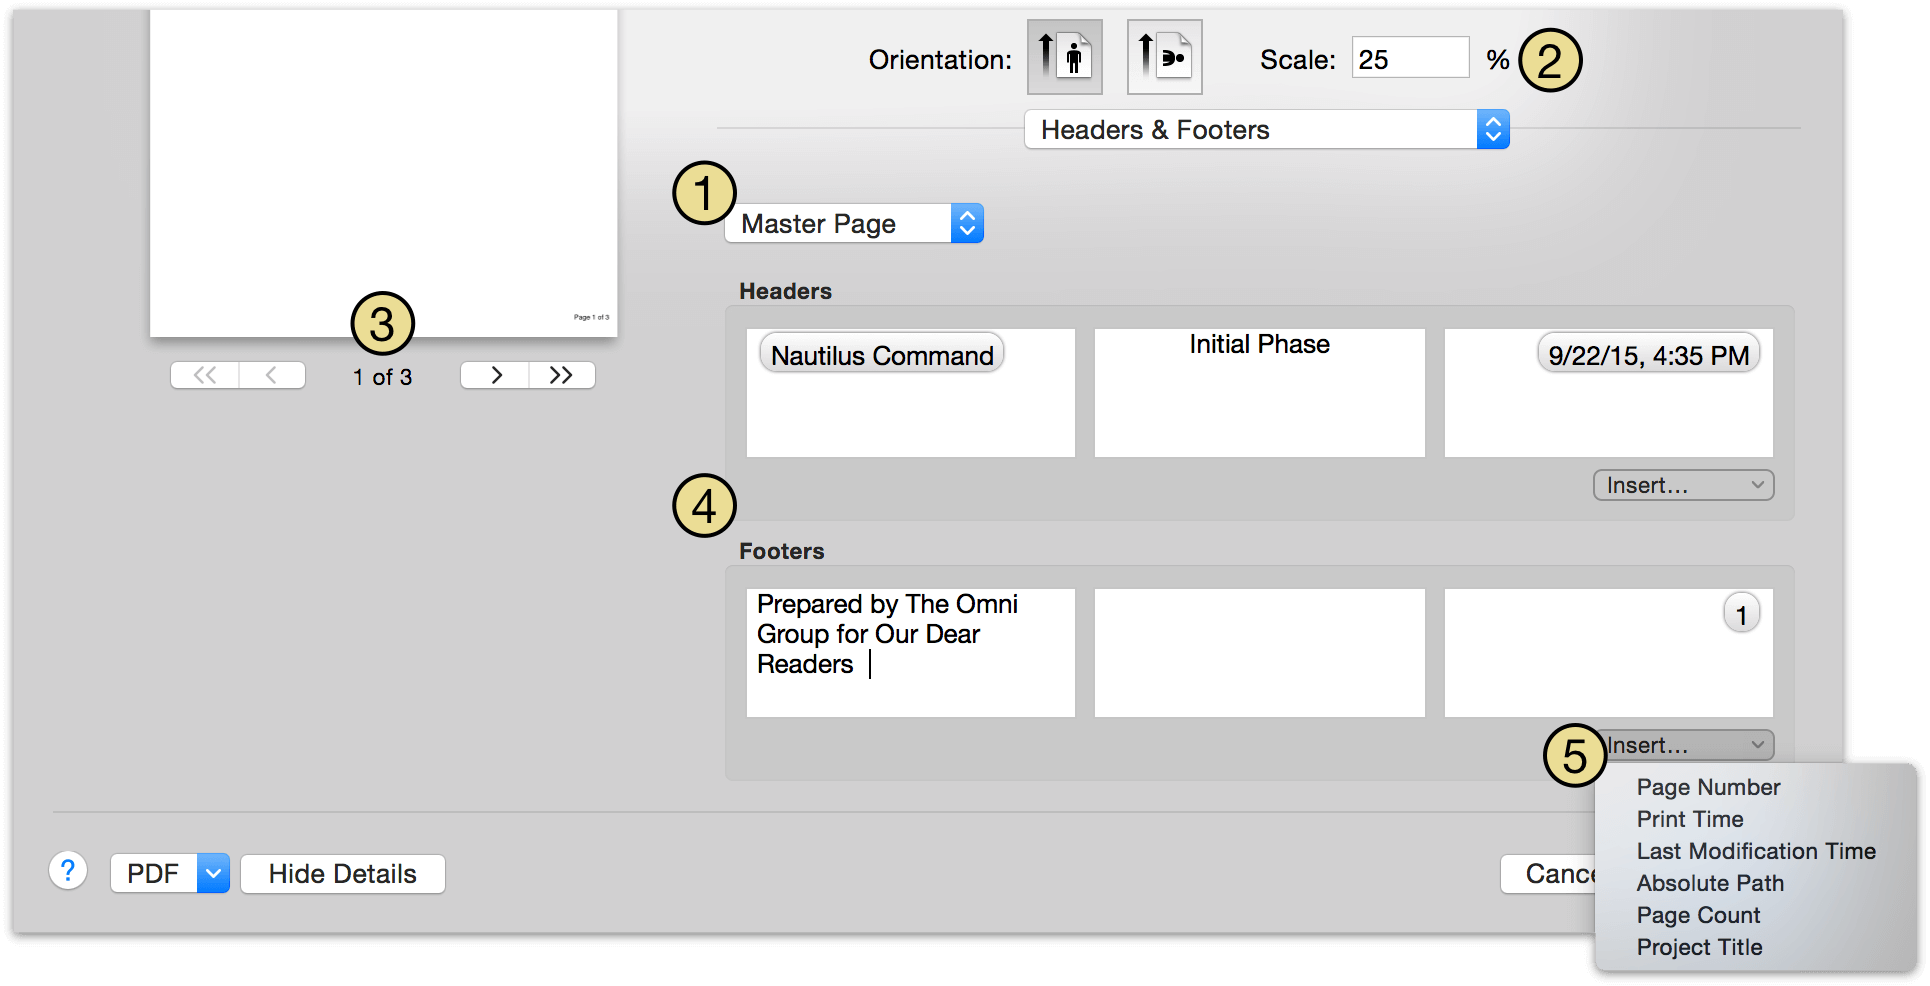
-
Use this menu to choose where custom headers and footers will appear in your printed document. Options include the Master Page (applied to every page printed, unless overridden by another page style), the First Page, Odd Pages, and Even Pages.
-
This Scale setting appears when printing from Network View, and controls the scale (as a percentile) at which the document is printed relative to its original size.
Scales for printing from Task and Resource Views are defined in the Dimensions section of the print dialog’s Content details.
-
As you update your custom headers and footers, changes are reflected in the print preview to give you an idea of how your document will look on paper.
-
The header and footer sections each have three fields that can be customized: left, right, and center-justified. You can enter custom text here, or:
-
Use the Insert menu to add information automatically derived from your document to a header or footer field. These automatically generated attributes include:
- Page Number — The current page as scheduled to be printed based on other configuration choices.
- Print Time — The computer clock-derived time when the document goes to press.
- Last Modified — The date and time when the document was last modified.
- Absolute Path — The location of the document in your computer’s file system.
- Page Count — The total number of pages in the printed document.
- Project Title — The name of the project file.
If you print the project while a filter is on, only the visible tasks are included in the printed copy.
Using the Report Window (PRO)
With OmniPlan 3 Pro, we’ve prepared some great new reporting templates for your project that you can use to print or export your data with a more polished and easily readable look.
To preview your project with any of the available templates, use the Reports button in the toolbar or choose File ▸ Report (Option-Command-R) to access the new HTML reports interface. You can print or export your report with the chosen template directly from the interface.
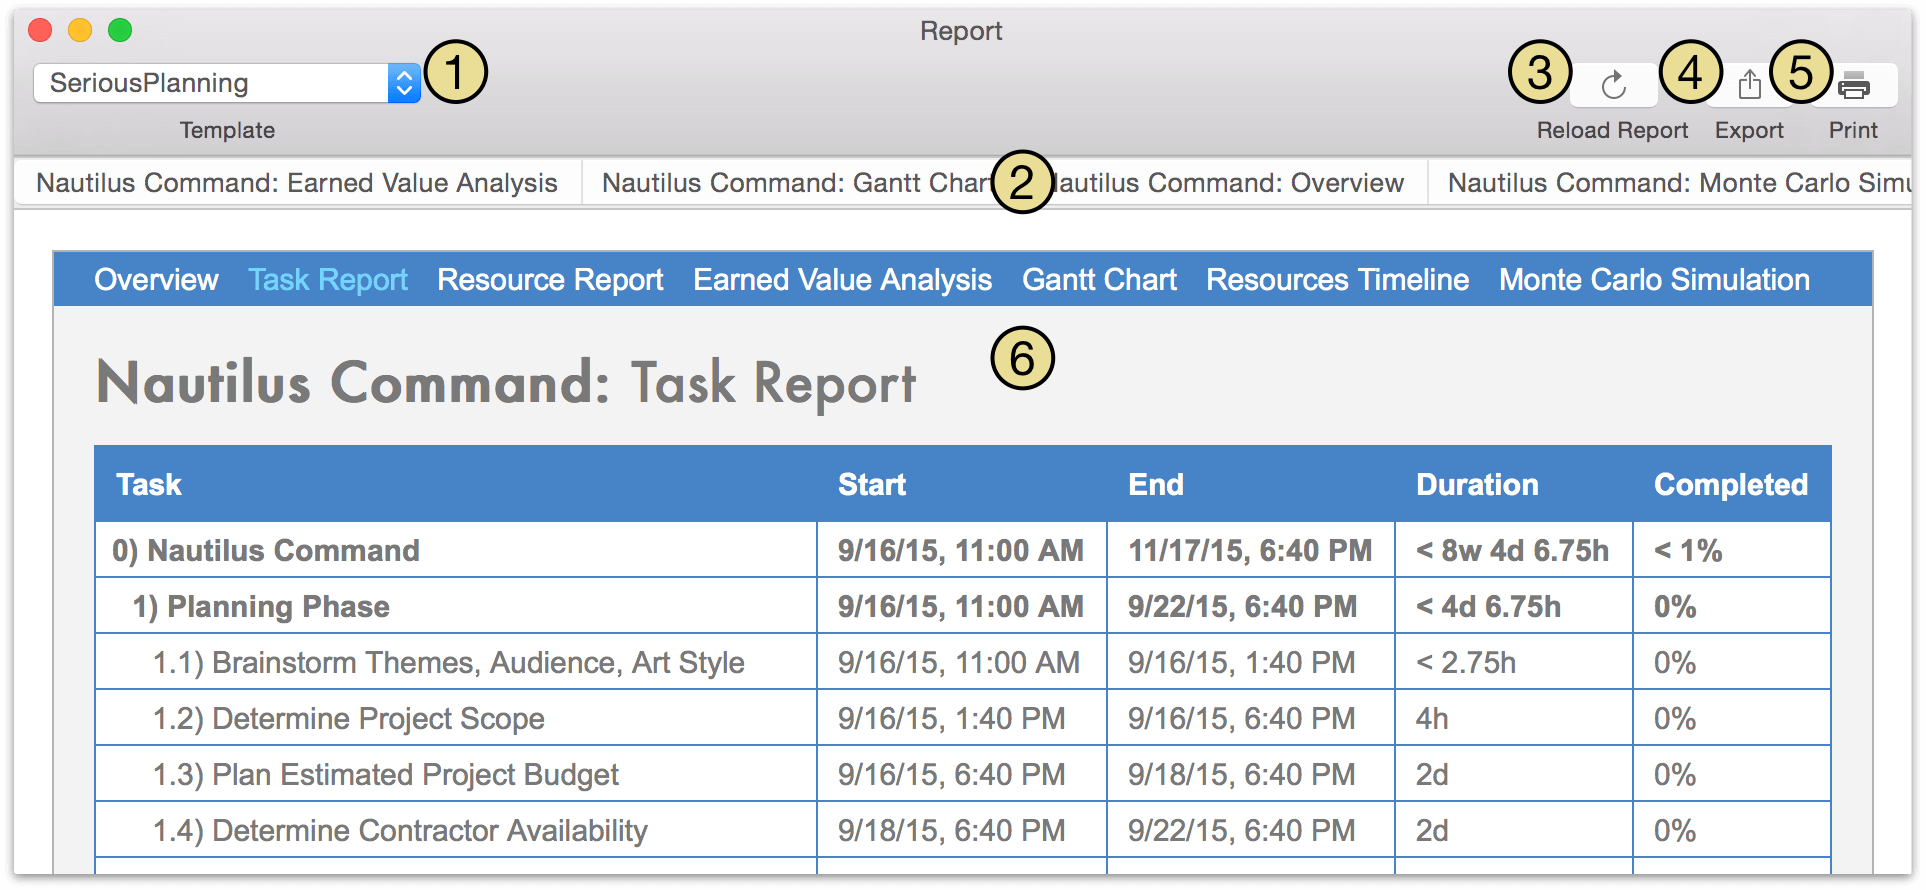
-
Use the dropdown menu to choose the template you’d like to use to print or export your project.
-
Swipe or scroll horizontally to browse the available report types in the current template. You’ll see the report types duplicated in the body of the report as well — this is to provide navigation internal to the report when it’s exported as HTML.
Available report types include:
- Project Overview — An overall project status report, highlighting project variance, completion percentage, and cost.
- Task Report — A report on the status of project tasks, as shown in the outline of Task View.
- Resource Report — A report on the status of project resources, as shown in the outline of Resource View.
- Earned Value Analysis — A report on the earned value of tasks in your project, as shown in the outline of Task View.
- Gantt Chart — An image-based snapshot of the current status of the Task View’s Gantt chart.
- Resource Timeline — An image-based snapshot of the current status of the Resource View’s timeline.
- Monte Carlo Simulation — A report including simulation results estimating the best, worst, and expected cases for cost and completion time of the milestones in your project.
-
Use the Reload Report button to generate an up-to-date version of the report based on any new changes made to your project.
-
Use the Export button to generate a PDF or HTML exported copy of your full project report (including all of the report types available). Details on the contents of an HTML Full Report can be found below.
-
Use the Print button to print the currently selected report type using the standard macOS print dialog options. The option to save the print output as a PDF file is also available here.
-
This is the HTML preview of your report, representing how it will appear when exported.
When you choose Export ▸ HTML Full Report from the Report window, you’ll have the option to pick a location in Finder to save the report.
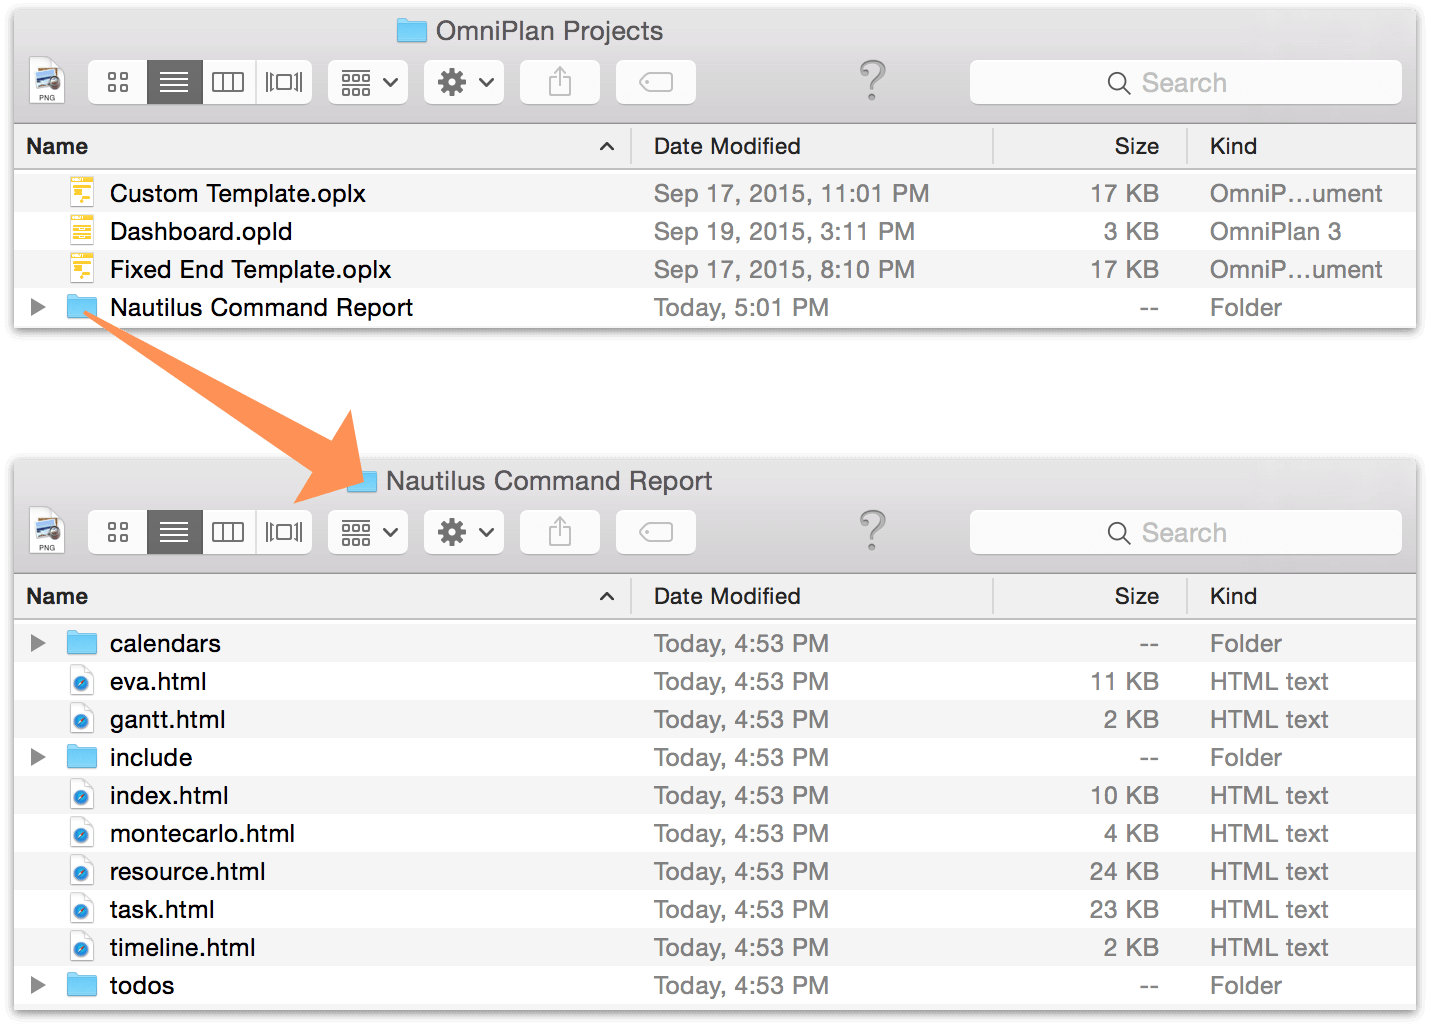
Upon saving, a folder is created that contains a full report of the project in HTML format. Depending on the template used for export, the following items may be included (the built-in SeriousBusiness template includes all of these):
- HTML files corresponding to each type of report previewed in the Report Window (Overview, Task Report, Resource Report, Earned Value Analysis report, Gantt Chart, Resource Timeline, and Monte Carlo Simulation).
- A folder labeled calendars that contains a Reminders checklist of the project’s milestones (in .ics format), and each resource’s tasks as Calendar events (also in .ics format).
- A folder labeled todos that contains Reminders checklists of each resource’s tasks.
- A folder labeled include that contains image assets and a .css file that describes the appearance of your report.
While both Apple Calendar events and Reminders checklists are exported using the same file format (.ics), macOS is smart about figuring out which one goes where, and will prompt you with the correct location to add your scheduled items when you double-click the file.
Once you’ve exported your full report, you can open and print individual pages in Safari, send Calendar events and Reminders to your team, or edit the CSS and HTML for a pixel-perfect representation of your project status.
Customizing Reporting Templates (PRO)
With some knowledge of HTML and CSS, you can make your own HTML templates for printing and exporting. Get started with your custom template in a few quick steps:
-
First, go to the HTML pane of OmniPlan Preferences.
-
To create a new template, select an existing template and choose Edit a Copy from the gear menu below the list.
-
Enter a name for the template and save it in a convenient location.
-
The new template opens in Finder; it is a folder of HTML and CSS files that you can customize to your liking.
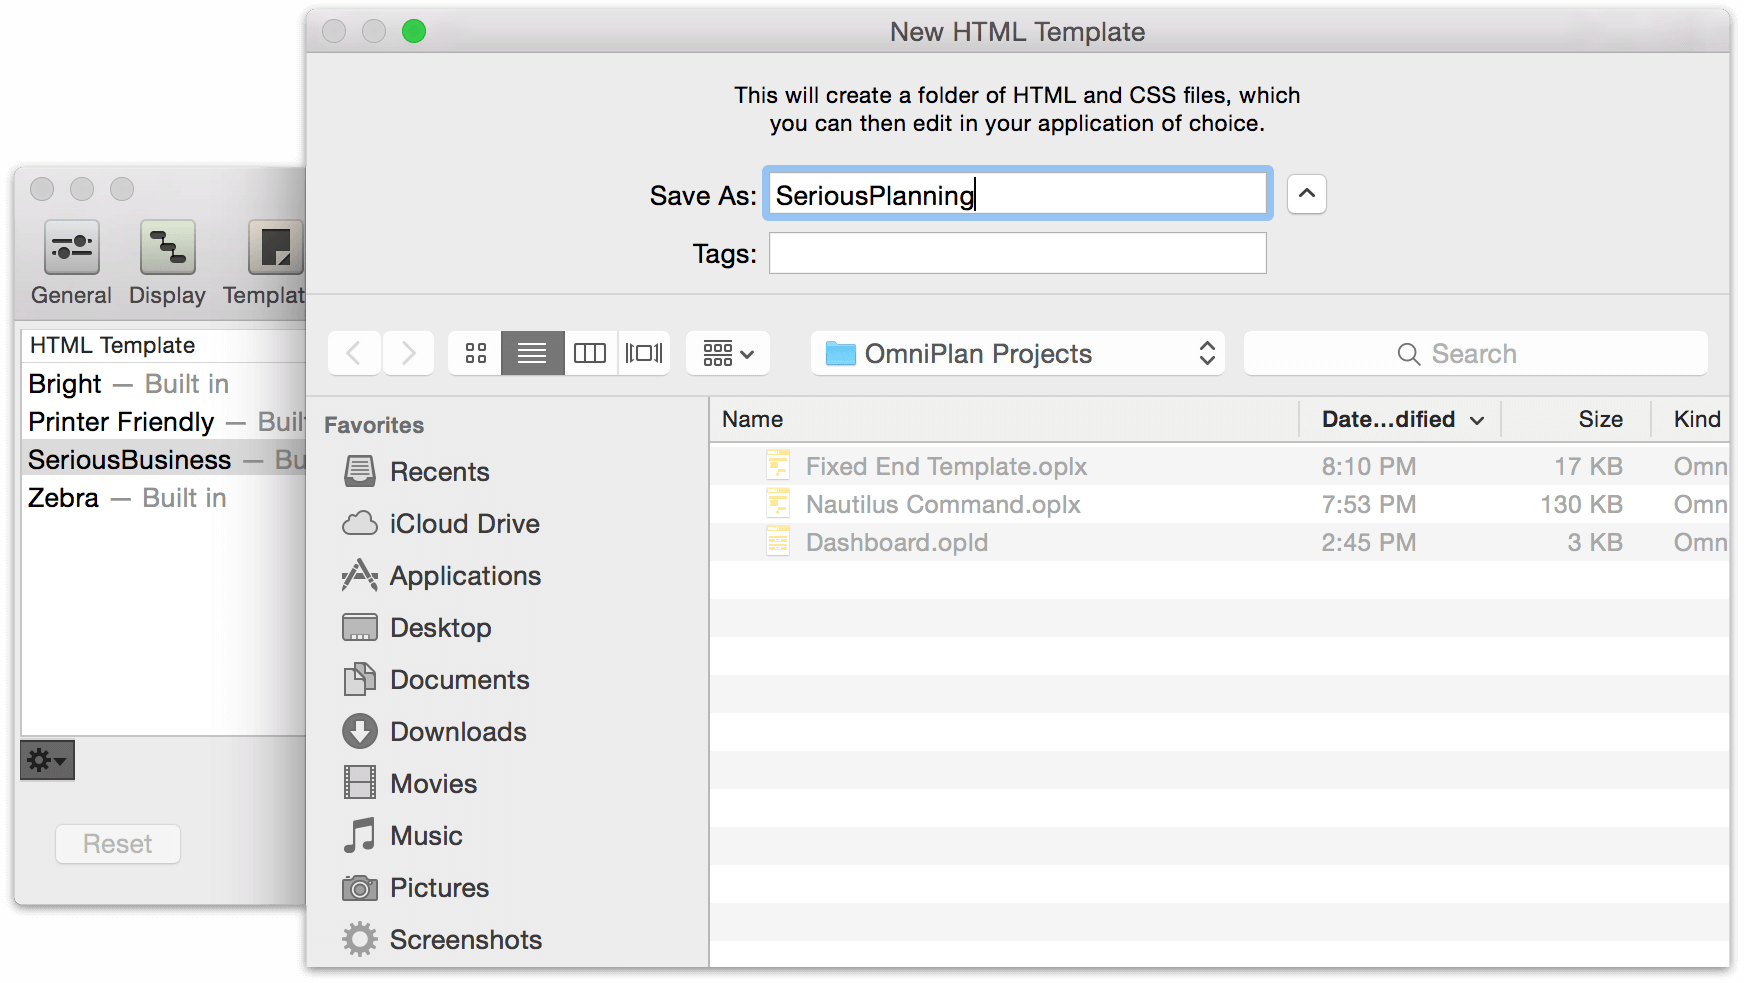
Due to security changes in macOS, HTML templates created in versions prior to OmniPlan v2.3 are automatically relocated and not available for direct editing. To change the contents of a migrated template, select it and choose Edit a Copy from the gear menu.
When you have the template set up the way you want, you can manage it from the HTML Preferences pane and choose it in the Report Window as a template for printing and exporting.
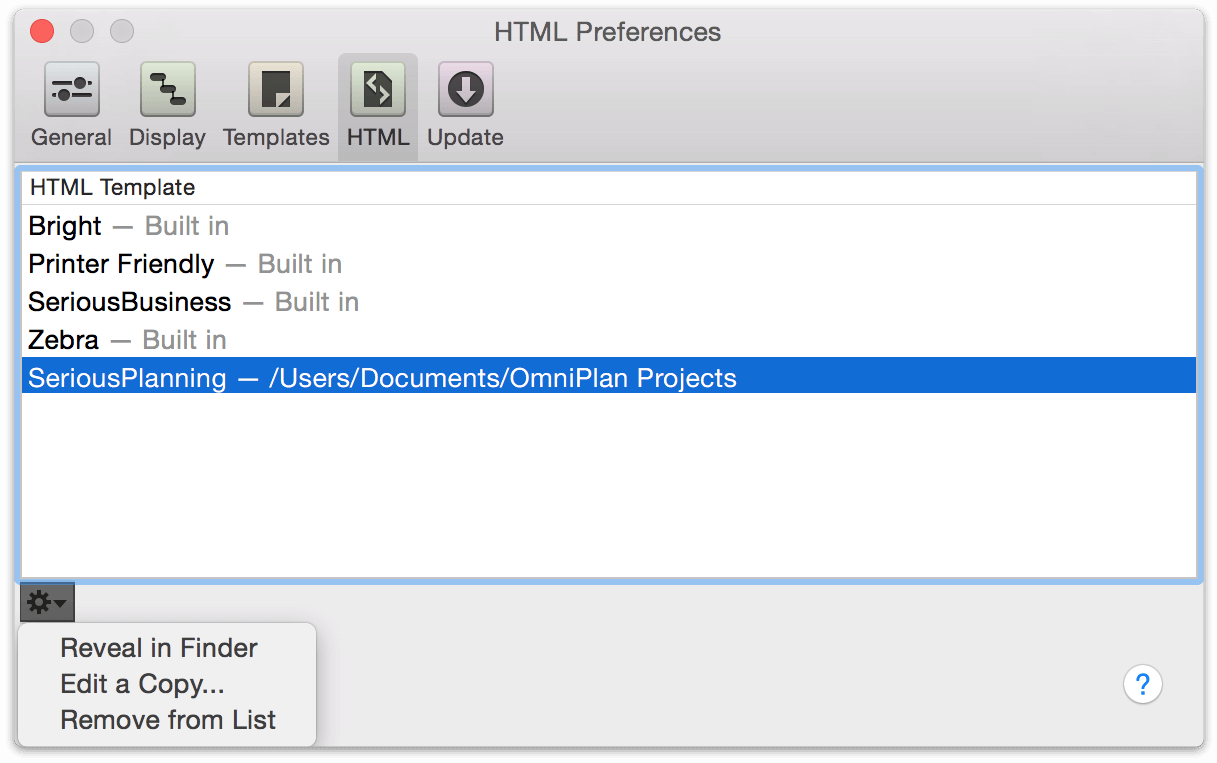
Custom Template Tokens
HTML reporting templates use a special syntax for inserting data from your project. Open one of the HTML files in the text editor of your choice, and you’ll find standard XHTML interspersed with OmniPlan tokens that look similar this:
{@Token Name@}
These tokens are placeholders for data about the project as a whole. When the template is used to export an OmniPlan file, each token is replaced by the data corresponding to the token name.
A reference for the various available tokens follows:
Project Tokens
{@Date@}— The date of the export.{@Version@}— The version of OmniPlan that exported the report.{@Project Title@}— The title of the project, as set in the Project inspector’s Project Info section.{@StartDate@},{@EndDate@}— The start or end date of the project.{@StartTime@},{@EndTime@}— The start or end time of the project.{@Duration@}— The duration of the whole project.{@Completion@}— The completion percentage of the whole project, as calculated from all tasks.{@Cost@}— The cost of the whole project.{@ResourceData@}— Place this at the tr level of a table; for each resource it creates a row of three cells, containing the resource name, a link to an iCalendar file of the resource’s assignments as events, and a link to an iCalendar file of the resource’s assignments as to-do items.{@ProjectCalendarLink@}— A link to the Project Milestones calendar, if there are any milestones.
Stylesheet Token
{@ApplyStyleSheet include/style.css@}— This token applies a CSS stylesheet to the page, by specifying the path to the stylesheet. When the export happens, this token is replaced by one of two things:
If exporting a full HTML report, a link to the stylesheet as an external file. This lets all of the exported HTML files link to the same stylesheet.
<link rel="stylesheet" href="include/style.css"type="text/css" />
If exporting just one HTML page (a task list or resource list), an embedded copy of the stylesheet. This keeps everything in one HTML file.
<style type="text/css"> [...] </style>
Loop Tokens
These work like open/close HTML or XML tags. When the export happens, OmniPlan cycles through everything between the opening and closing tokens, inserting data about each task or resource. The Assignments loop has to happen inside the Resources loop, as it lists tasks that are assigned to a particular resource. Make sure that you include the closing token, and that your task-specific or resource-specific tokens are between the appropriate loop tokens.
{@Tasks@}and{@/Tasks@}— Lists all tasks in the export; inside this loop you can use task-specific tokens.{@Resources@}and{@/Resources@}— Lists all resources in the project; inside this loop you can use resource-specific tokens and Assignments loops.{@Assignments@}and{@/Assignments@}— Lists all assigned tasks for a resource; this can only be used inside the Resources loop. Inside this loop you can use task-specific tokens.
A handy option for a svelte template is to remove the {@Assignments@}``{@/Assignments@} section from the Resources loop. {@Resources@} gives you each resource, while {@Assignments@} gives you each assignment for the current resource; if you omit the {@Assignments@} that leaves just the resource summary info. This is demonstrated in the index page of the built-in Printer Friendly template.
Tokens for Tasks
These tokens can be used inside the Tasks loop or the Assignments loop of a resource.
{@ID@}— The task’s number in the outline.{@Title@}— The task name.{@Start@},{@End@}— The actual start or end time of the task.{@Time@}— The duration of the task.{@Effort@}— The effort value for the task.{@Effort Done@}— The amount of effort completed for the task.{@Remaining Effort@}— The amount of effort remaining for the task.{@%Done@}— The completion percentage for the task.{@Dependencies@}— A list of the task’s dependencies, in the same format as the Dependencies column in the task outline.{@Cost@}— The Cost of the task itself.{@Resources Cost@}— The cost of the assigned resources.{@Total Cost@}— The cost of the task and the assigned resources.{@Assigned@}— A list of assigned resources.{@Planned Start@},{@Planned End@}— The baseline start or end time of the task.{@Start Variance@},{@End Variance@}— The difference between the baseline and actual times for the start or end of the task.{@Constraint Start@},{@Constraint End@}— The constraint on the task’s start or end time, if any.{@Notes@}— Text of the task’s note, if any.{@Priority@}— The task priority, just like the column in the task outline.{@Status@}— Some words to describe the task’s due or overdue state, like the Status icons in the task outline.{@Violations@}— The number of violations that involve this task.
Custom data keys that you have created for your project can be included in templates. If you add a token that exactly matches the name of one of your custom data keys, it is converted to the value of that key for the given task. For example, if you have a “Location” key for your tasks, you can use a {@Location@} token in your template.
Any column names not listed above can be converted to tokens in this manner as well.
Tokens for Resources
These tokens can be used inside the Resources loop.
{@Resource@}— The resource name.{@Start@},{@End@}— The actual start time of the resource’s earliest assignment, or end time of the resource’s latest assignment.{@Time@}— The total duration of all tasks assigned to the resource.{@%Done@}— The completion percentage of all tasks assigned to the resource.{@Resources Cost@}— The total cost of assigning this resource to its assigned tasks.{@Resource Type@}— The type of resource (Staff, Equipment, Material, or Group).{@#@}— The “total units” value of the resource.{@Notes@}— Text of the resource’s note, if any.{@Efficiency@}— The resource’s efficiency value.{@Cost/Use@},{@Cost/Hour@}— Cost per use and cost per hour values as defined in the Resource Info section of the Resource inspector.{@Total Uses@},{@Total Hours@}— The total number of assignments, or total amount of effort assigned, for the resource.{@ResourceCalendarLink@}— A link to the resource’s assigned tasks as an iCalendar file of events, if it has any tasks assigned.{@ResourceToDoLink@}— A link to the resource’s assigned tasks as an iCalendar file of to-do items, if it has any tasks assigned.- Custom data keys — If you include a token that exactly matches the name of one of your custom data keys, it is converted to the value of that key for the given resource. For example, if you have a “Phone Number” key for your resources, you can use a
{@Phone Number@}token in your template.
Path Tokens
These provide the path to a particular page in the HTML export. You can use these to create links between pages.
{@TaskReportPath@}— The file path to this HTML export’s Task Report page.{@ResourceReportPath@}— The file path to this HTML export’s Resource Report page.{@ResourceTimelinePath@}— The file path to this HTML export’s Resource Timeline image.{@GanttChartPath@}— The file path to this HTML export’s Gantt Chart image.{@ProjectCalendarPath@}— The file path to this HTML export’s Project Milestones calendar.
Earned Value Analysis Tokens
These tokens correspond to the columns employed in the outline of Task View by the Earned Value Analysis feature.
{@ev_budgetedCostOfWorkScheduled@}— The budgeted cost of work scheduled; represents the Planned Value column in the Task outline.{@ev_budgetedCostOfWorkPerformed@}— The budgeted cost of work performed; represents the Earned Value column of the Task outline.{@ev_actualCostOfWorkPerformed@}— Actual cost of work performed; represents the Actual Cost column of the Task outline.{@ev_costVariance@}— The cost variance between earned value and actual cost; represents the column by the same name in the Task outline.{@ev_scheduleVariance@}— The distance (in currency) from the planned value; represents the column by the same name in the Task outline.{@ev_estimateAtCompletion@}— Estimate at completion; represents the column of the same name in the Task outline.{@ev_budgetedAtCompletion@}— Budgeted at completion; represents the column of the same name in the Task outline.{@ev_varianceAtCompletion@}— Variance at completion; represents the column of the same name in the Task outline.{@ev_costPerformanceIndex@}— The cost performance index; represents the column by the same name in the Task outline.{@ev_schedulePerformanceIndex@}— The schedule performance index; represents the column of the same name in the Task outline.{@ev_costVariancePercent@}— The cost variance percent; represents the Cost Variance % column in the Task outline.{@ev_scheduleVariancePercent@}— The schedule variance percent; represents the Schedule Variance % column in the Task outline.{@ev_toCompletePerformanceIndex@}— The “to complete performance” index; represents the column of the same name in the Task outline.
Monte Carlo Simulation Tokens
These tokens correspond to values used in computing Monte Carlo simulations to estimate milestone completion. They don’t run simulations themselves; rather, they use the most recently computed results for your project.
{@Milestones@}and{@/Milestones@}— Repeats a template for each milestone in the project.{@chainCost@}— The cost of the entire prerequisite chain up to this task or milestone.{@mc_minimumCost@}— The lowest chainCost for any Monte Carlo simulation run.{@mc_averageCost@}— The average chainCost for every Monte Carlo simulation run.{@mc_maximumCost@}— The highest chainCost for any Monte Carlo simulation run.{@mc_earliestCompletion@}— The earliest date completed for any Monte Carlo simulation run.{@mc_fiftyPercentCompletion@}— The date on which 50% or more of simulations completed.{@mc_latestCompletion@}— The latest date completed for any Monte Carlo simulation run.
Chapter 113
OmniPlan Preferences
OmniPlan Preferences contain a variety of useful configuration options for interacting with OmniPlan and customizing its display and behavior to suit your needs. Preferences are accessible in-app from the OmniPlan menu or with the keyboard shortcut (Command-,).
General Preferences
The first OmniPlan Preferences pane provides customization of the Tab and Return keys to suit your preferred method of keyboard navigation.
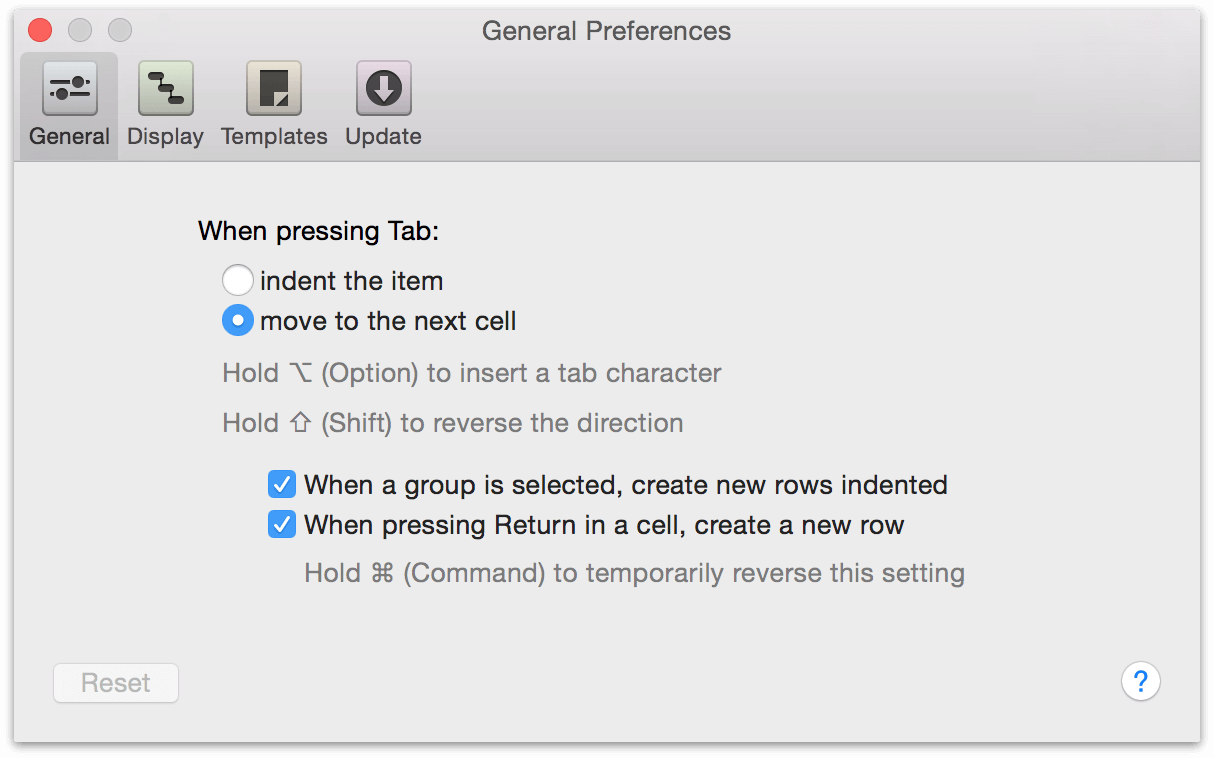
When pressing Tab — You can set the Tab key to do one of two things:
- Indent the currently selected item in the outline, thus making it a child of the item above it. Pressing Shift-Tab outdents the selected item.
- Move to the next cell in the outline. Pressing Shift-Tab moves to the previous cell.
Either way, the Indent and Outdent commands in the Structure menu (and their keyboard shortcuts, Command-[ or Command-] by default) will always work.
You can always press Option-Tab to type a tab character at the insertion point.
When pressing Return in a cell, create a new row — When you are done editing the contents of a cell in the outline, you might press Return to finish editing. If this preference is turned on, a new item is then created. Otherwise, the editing just ends and the current item becomes selected.
Whether this setting is on or off, pressing Return while not editing a cell always creates a new item.
You can hold Command while pressing Return to temporarily change the setting; for example you could press Command-Return to finish editing and create a new item, even if the setting was turned off.
Display Preferences
The Display preferences are the second pane of Preferences, and control the display of times and dates throughout OmniPlan.
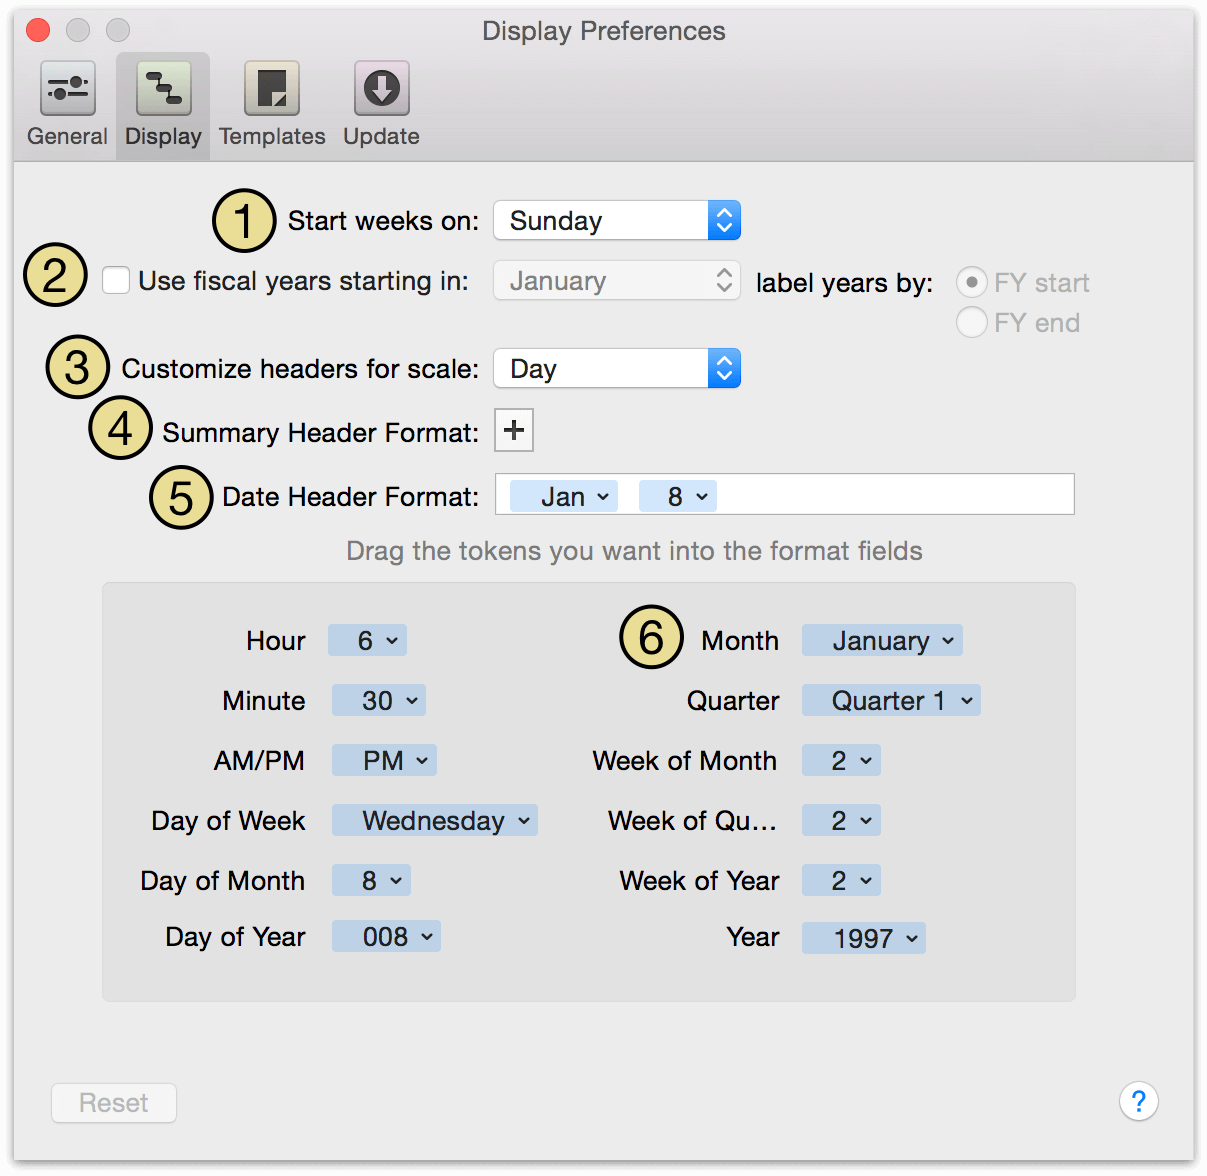
-
Choose which day OmniPlan should consider as the first day of the week.
-
Turn on Fiscal Years and specify when they start or end. Using Fiscal Years changes the way quarters (Quarter 1, Quarter 2, etc.) of your year are calculated and displayed in the date headers of the Gantt chart.
-
This pop-up menu determines which chart header scale you’ll be editing below. The different time scales appear in the headers of the Gantt chart, resource timeline, and work week chart, depending on the zoom scale.
-
Click the plus button to add a summary header to the current scale. This makes an extra layer of date headers above the normal one in the Gantt chart and the resource timeline. This extra layer gives you more room to show, for instance, the week above the day, or the month above the week. The summary header format can be customized in the same way as the regular date header format, by dragging tokens from the box below and by typing directly into the field. To get rid of the summary header, just click the minus button to the right of the field.
-
Here’s where you can assemble a date format. Drag tokens from the box below, and type spaces or characters wherever you want them to appear. Some tokens offer information about the date at the beginning or end of a week or quarter. This is so that you can, for example, create a week format which indicates the first and last days of the week. Here we have a format that displays the short name of the month, followed by the date.
-
Tokens can be dragged to the format field above to construct a date format. Click the triangle on the right side of a token to change the display of the token. For example, this token represents the month; you can choose to display the month as a full word (January), an abbreviation (Jan), a two-digit number (01), or a one-digit number (1).
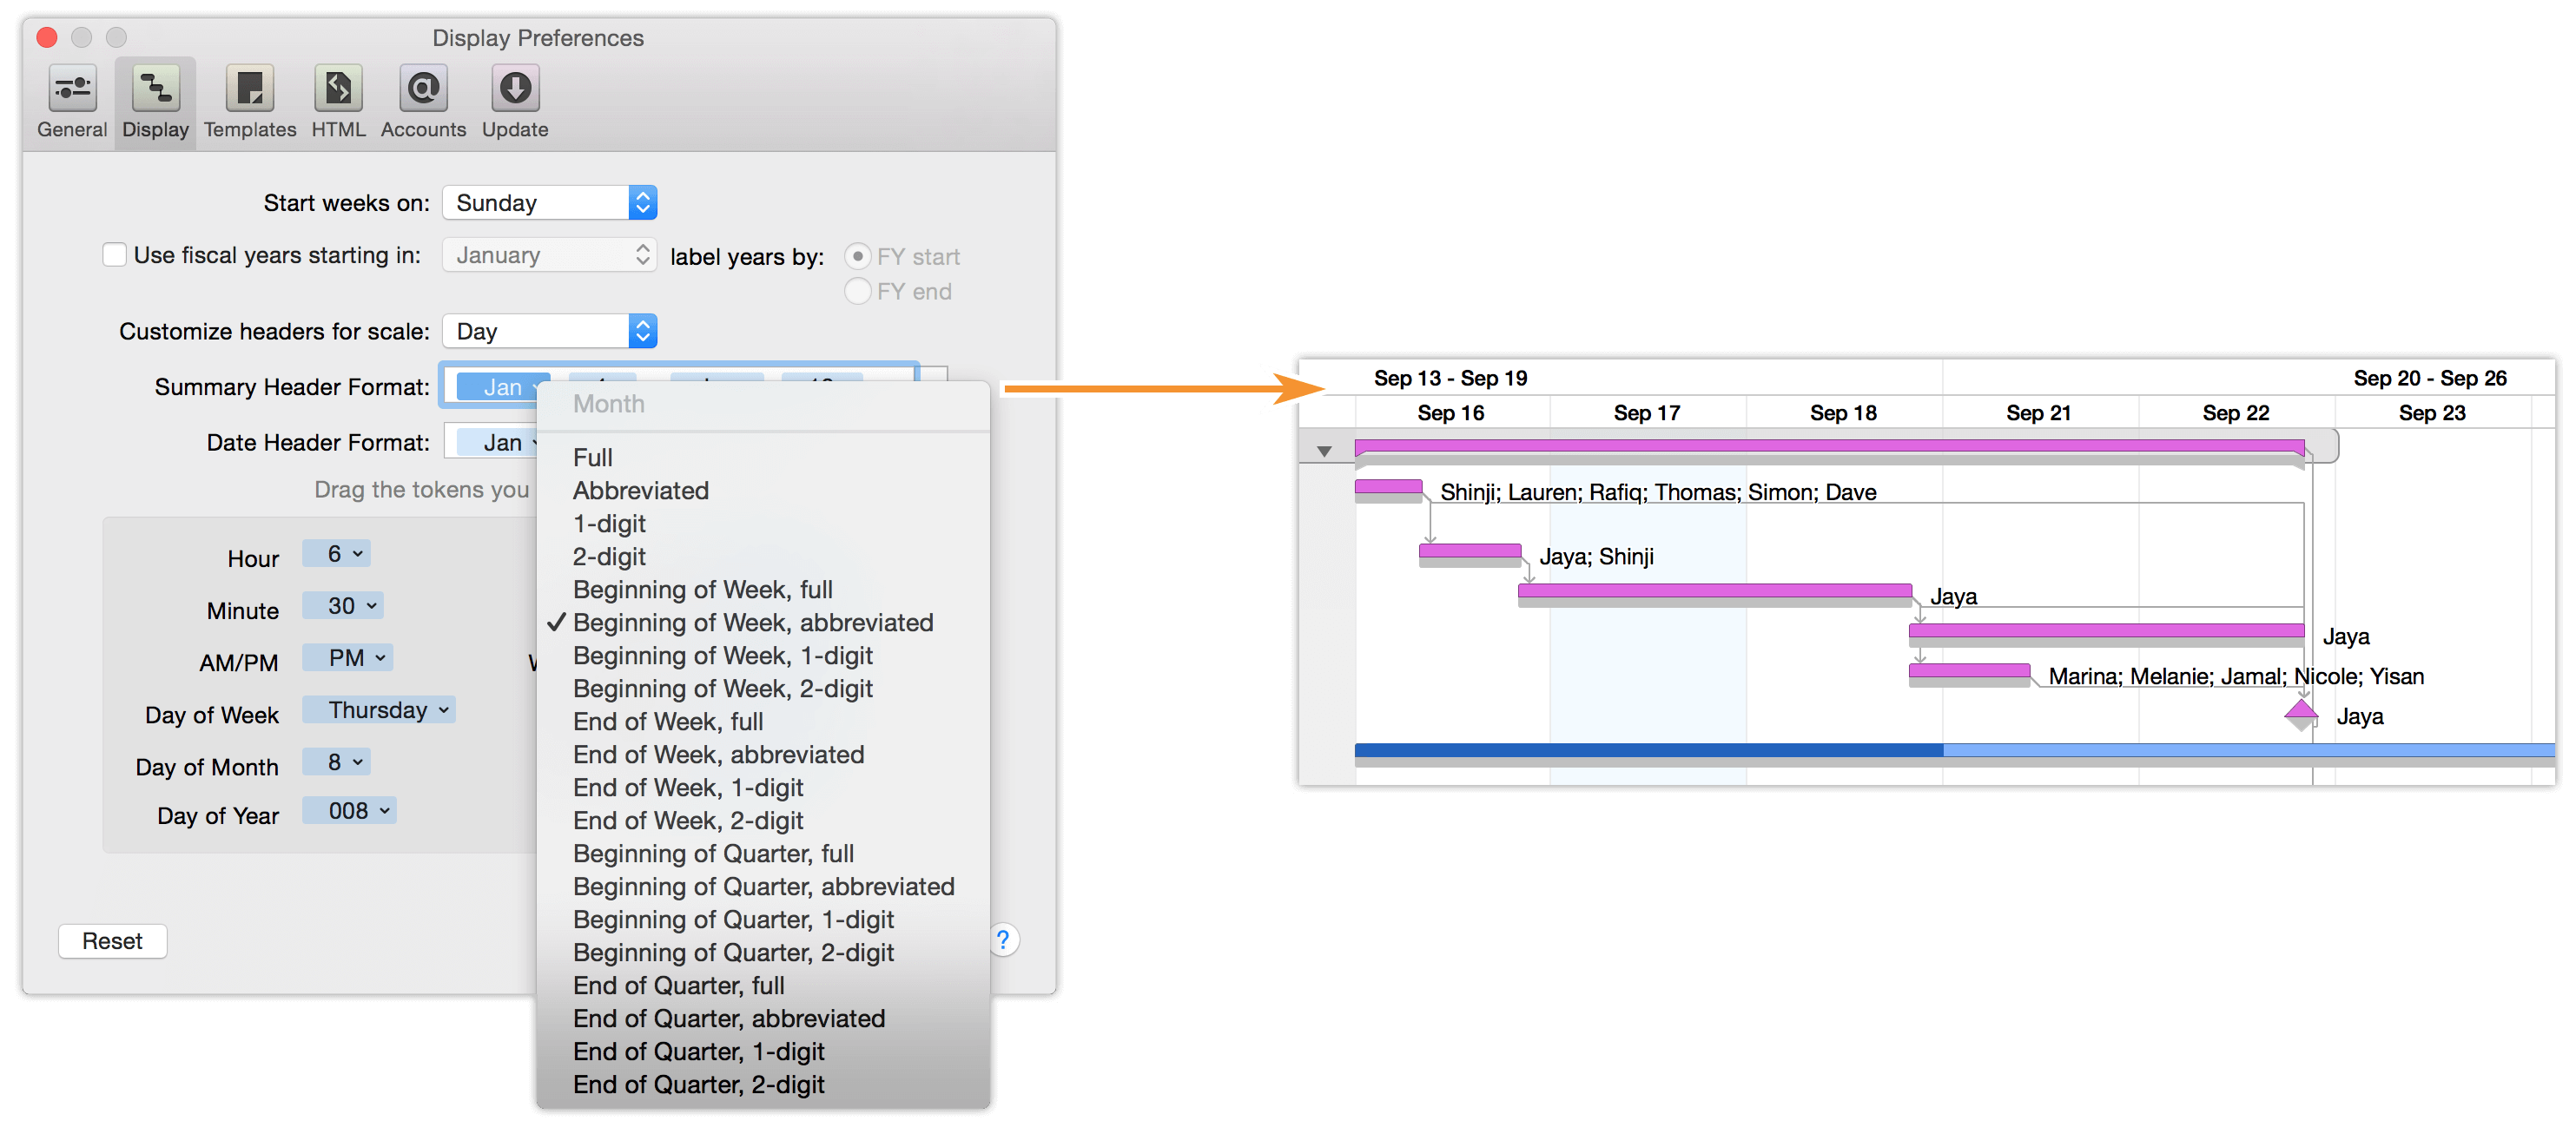
Templates Preferences
A template is a file set up just right to be a starting point for a new project. For example, there might be certain resources you use for every project, a common task structure, certain named styles you like to use, and a standard set of working hours for your company. You can configure all of these things once, then create new documents from that template.
The Templates pane of Preferences provides a list of included templates that you can use as the source for a new document. Two are included with the app by default (a completely empty plan and one set up with Automatic Leveling turned on), and you can create your own from a currently open plan by choosing File ▸ Save as Template.
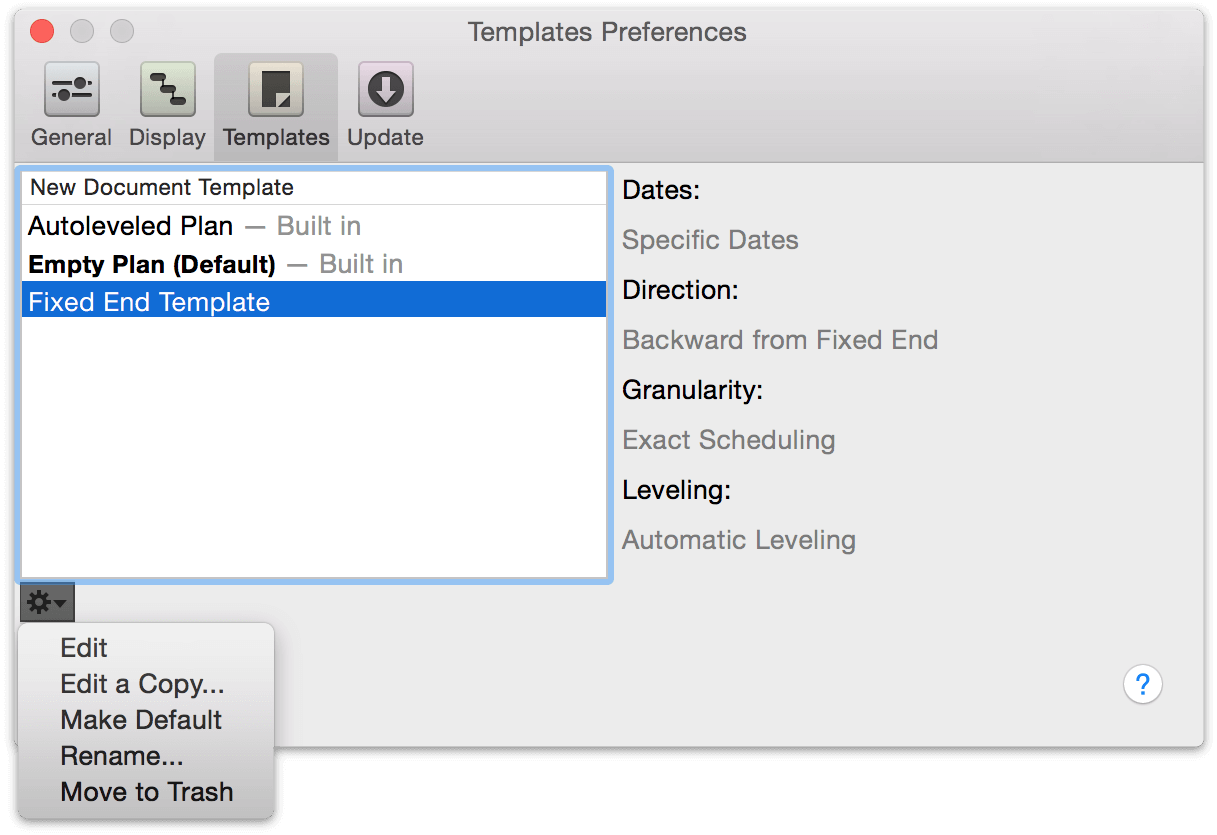
Edit the list of available templates using the gear menu beneath the document list. If there are settings you use frequently for new project files, you can choose a template to set as the default; otherwise, create new projects from templates by choosing File ▸ New From Template... from the File menu.
From the gear menu below the list, you can:
-
Edit: Change the selected template. You can also just double-click the template’s name in the list. When you save your changes, the template is updated.
-
Edit a Copy: Make a different version of the selected template. Select this command, type a title for the new template, then change the document and save it as usual.
-
Make Default: Use the selected template from now on when making new documents by choosing File ▸ New. The template’s entry in the list changes to bold type.
-
Rename: Change the title of the selected template.
-
Move to Trash: Get rid of the selected template by putting it in the trash. From there, you can still recover it if you need it. Otherwise, it will be deleted the next time you empty the trash.
If you’d like to reuse a specifically configured task multiple times within the same project, you can “template” tasks on the fly by selecting the task you’d like to duplicate and choosing Project ▸ Set As Default For New Tasks. Subsequently created new tasks will match the settings of the one you chose.
Creating a Template
Create a new document normally with File ▸ New.
Set up the document however you like. Everything about a document, including its contents, the state of the Project inspector, the view options, and so on, can be saved to a template.
Once the document is ready, choose File ▸ Save As Template.
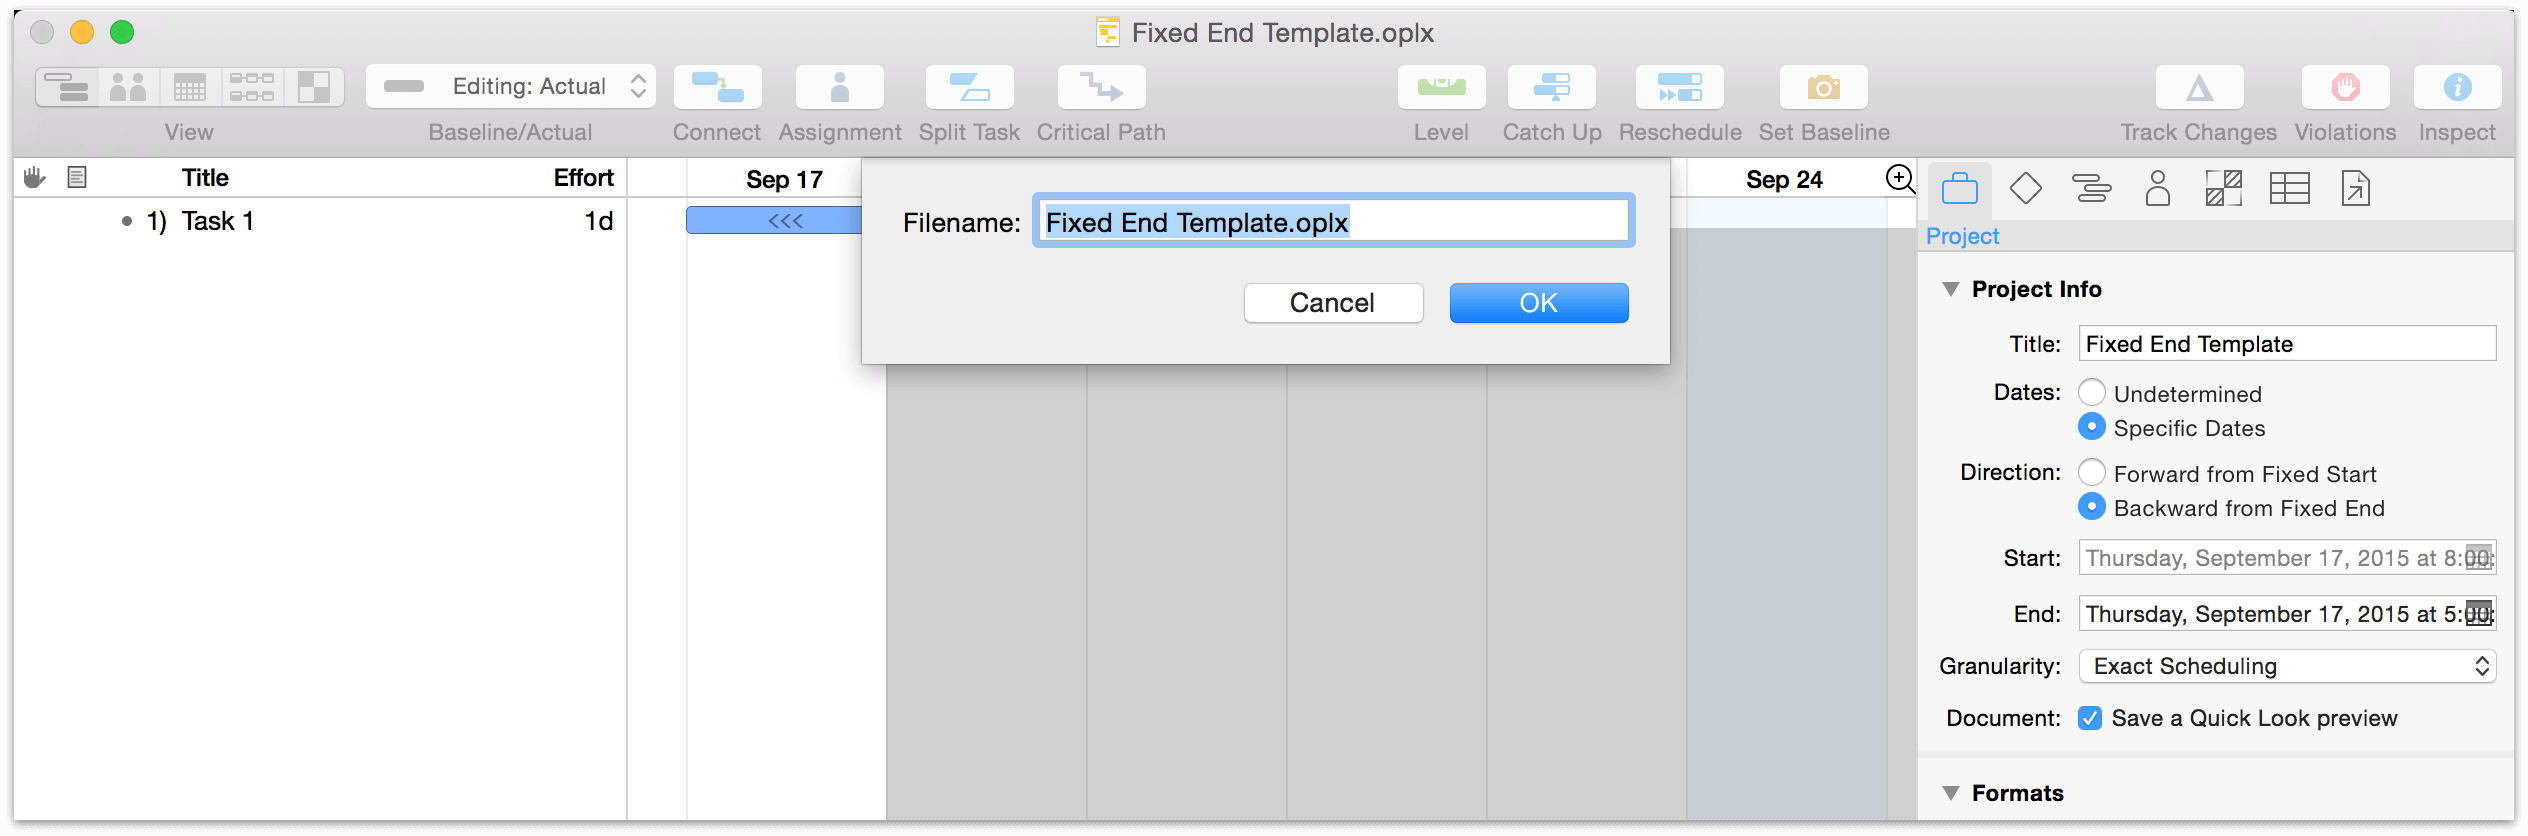
Enter a name for the template and confirm it.
When you create a document by choosing File ▸ New, your new document follows the default template. To use a different template, use File ▸ New From Template instead.
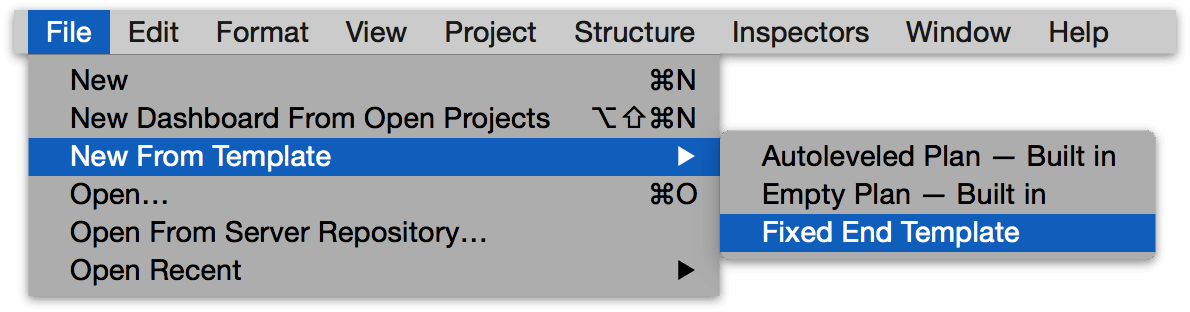
HTML Preferences (PRO)
With OmniPlan Pro, printing from the Report window and HTML export of OmniPlan files rely on a set of HTML and CSS files that together form a template describing how the destination document should look. The HTML Preferences lists the available export templates, and provides tools for creating new ones.
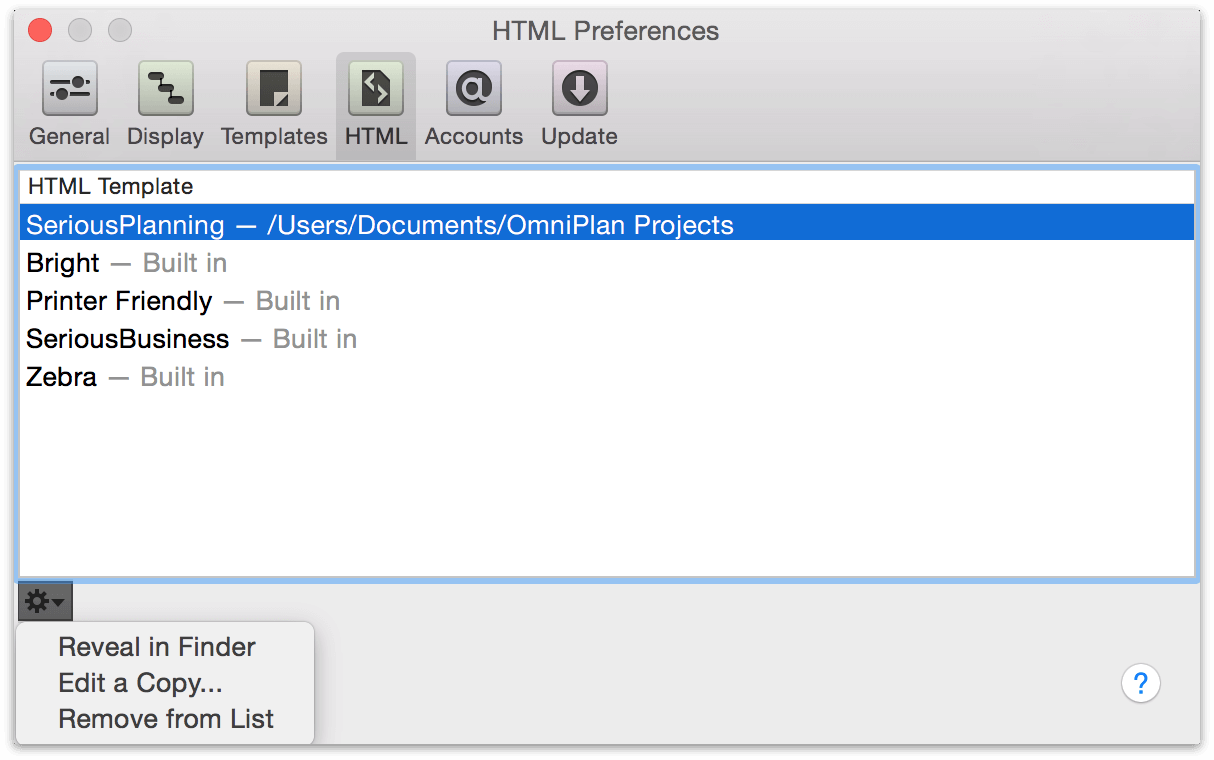
Several great templates are included with the app, but if you’d prefer to customize the appearance and presentation of your project when printing or exporting, you can create a new copy of an HTML template from the gear menu on this pane, save the copy in a folder you designate, and edit the HTML and CSS to suit your needs.
Template integration with OmniPlan’s custom data types is done via tokens. A guide to setting up your own custom reporting templates is available in the (13_reportprint.xhtml#customizingreportingtemplatespro)[Customizing Reporting Templates (PRO)] section of the Reporting and Printing chapter, along with a reference list of the tokens used to fetch specific data from OmniPlan.
Accounts Preferences (PRO)
When multiple users will be contributing to and editing an OmniPlan project, with OmniPlan Pro you can easily keep everyone on the same page by syncing the project to a server repository. You’ll set up your server account here, in the Accounts pane of Preferences.
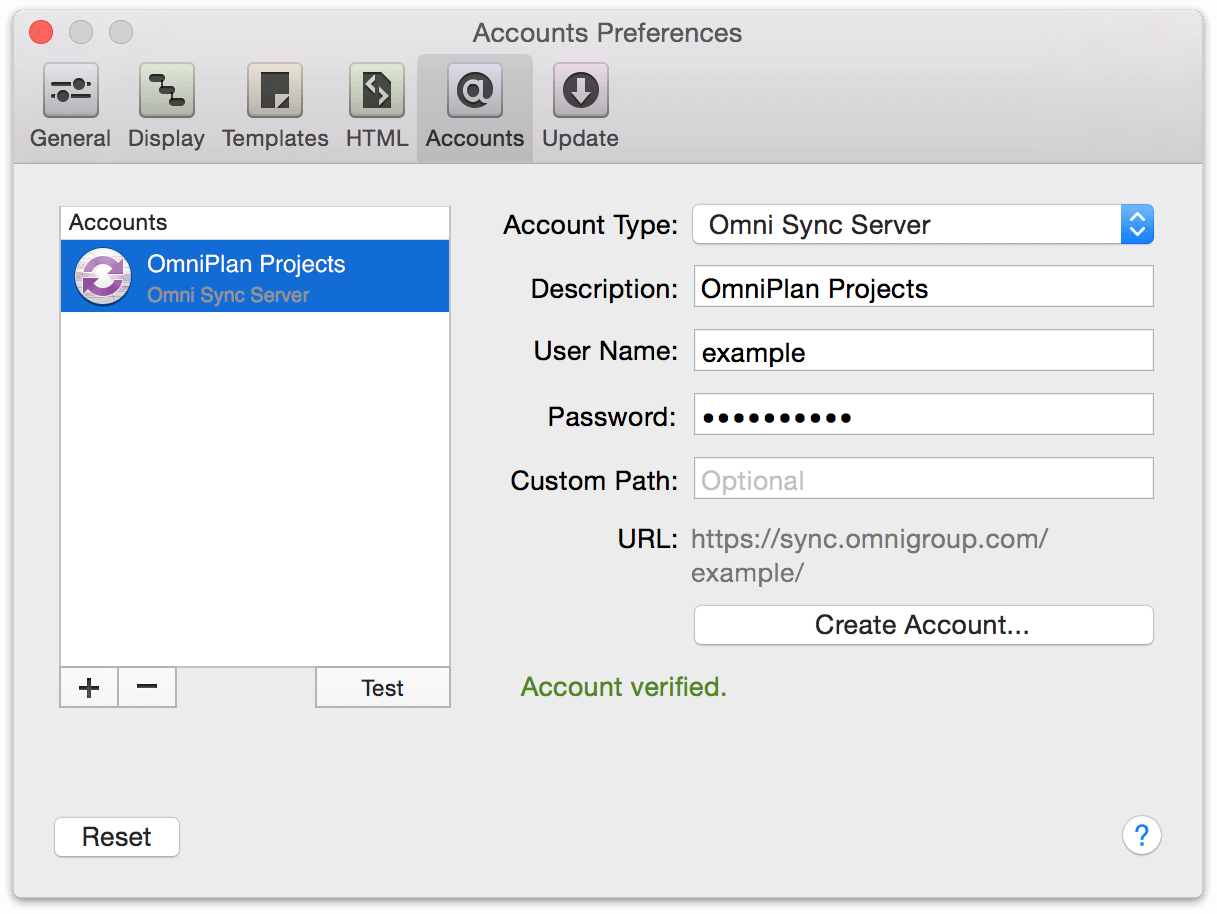
OmniPlan supports the open WebDAV standard, and also offers Omni Sync Server as a recommended option for publishing and subscribing to your shared projects. A quick start guide to getting synced can be found in Collaborating with Multiple Contributors.
Update Preferences
If you’ve purchased your copy of OmniPlan 3 (Pro or Standard) from The Omni Group’s website, OmniPlan can automatically use your internet connection to check for new and updated versions.
The Update Preferences panel doesn’t exist if you have purchased OmniPlan 3 from the Mac App Store. When there’s a new version of OmniPlan 3 available, the Mac App Store will alert you to download and install that on your Mac.
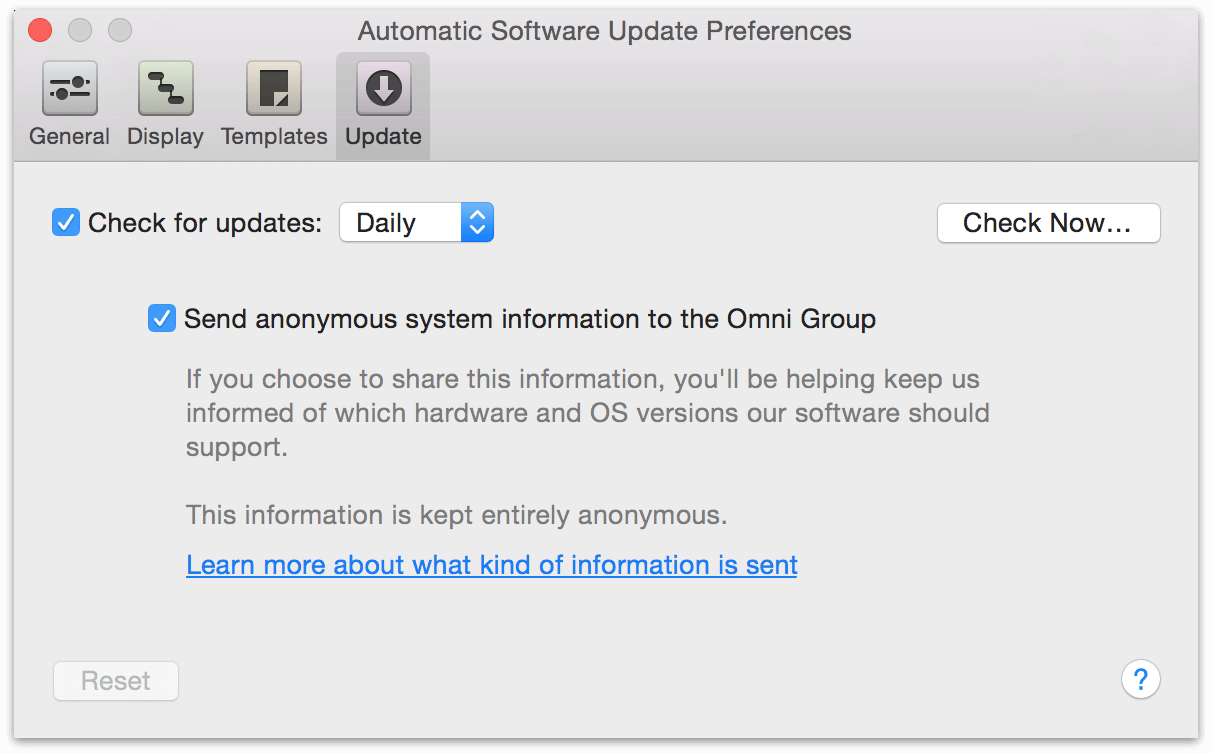
If the Check for Updates checkbox is selected, you will be notified when there is a new version of OmniPlan ready for you to enjoy. Click Check Now… to look for the newest version once right away.
You can select the Send anonymous system information to the Omni Group checkbox to volunteer some information about your computer’s configuration when you check for updates. For details about what kind of information we collect and how we use it, click the Learn More link on the preference pane.
Chapter 114
[op3mac_icon_proglyph01]:art/op3mac_icon_proglyph01.png class="inline"
Menus and Keyboard Shortcuts
This chapter explains the function of each of the items found in OmniPlan’s drop-down menus, and lists default keyboard shortcuts for them where they exist.
The OmniPlan Menu
The OmniPlan menu holds commands related specifically to the administration of the OmniPlan application itself. Check for updates, view and modify your preferences, and enter new license information here.
- About OmniPlan
- See details about your copy of OmniPlan, its licensing status, and contact information for The Omni Group. Check here to see which version of the app you are using.
- Buy OmniPlan (Trial Version Only)
- This menu item appears if you are using a trial version of OmniPlan downloaded from the Omni website, and directs you to the Omni store purchase page for the app.
- Check for Updates (Omni Store Only)
- See if there is a new version of OmniPlan available to download. You can also set up automatic checking in the Update preferences.
- Preferences (Command-,)
- Open the OmniPlan preferences window, where you can customize how the application works for you.
- Licenses (Omni Store Only)
- Open the Licenses window, where you can add OmniPlan licenses you’ve bought, or check your existing licenses.
- Free Trial Mode (Trial Version Only)
- If you’re running a trial version of OmniPlan, these commands switch between the Pro and Standard versions of the app so you can compare features.
- Try Pro Edition
- Try Standard Edition
- Learn About Pro (Standard Edition Only)
- Open a window with information on the features included with the OmniPlan Pro Upgrade.
- Server Repository ![This feature is present in OmniPlan Pro][op3mac_icon_proglyph01]
- Open the Server Repository window, with a list of connected Publication and Subscription accounts and the OmniPlan projects synced there.
- Services
- Access system-wide macOS services offered by other applications.
- Hide OmniPlan (Command-H)
- Temporarily hide all of OmniPlan’s windows.
- Hide Others (Option-Command-H)
- Temporarily hide windows of all other applications so you can concentrate on OmniPlan.
- Show All
- Show all windows of all applications.
- Quit OmniPlan (Command-Q)
- Stop using OmniPlan and put it away for now. Your files are automatically saved.
- Quit and Close All Windows (Option-Command-Q)
- Close OmniPlan and any open project windows. Your files are saved. The next time you open OmniPlan a new document will be created (no existing projects will be opened).
- In-App Purchase (Mac App Store Only)
- Open the in-app purchase window to choose the version of OmniPlan 3 you would like to buy: the free 14-day trial, the Standard Edition, or the Pro Edition.
The File Menu
The File menu contains commands related to OmniPlan on a project data level. Create new documents, and copy, save, duplicate, restore, or otherwise manage existing ones. This menu also provides commands for getting data out of OmniPlan: printing, exporting, and reporting, publishing, and more.
- New (Command-N)
- Create a new OmniPlan project file.
- New Dashboard
 (Shift-Command-N)
 - Create a new (empty) dashboard for comparing the status of multiple projects.
- New Dashboard From Open Projects
 (Option-Shift-Command-N)
 - Create a new dashboard pre-populated with all OmniPlan projects currently open.
- New From Template
- Create a new OmniPlan project from an existing project template.
- Open (Command-O)
- Browse for an existing OmniPlan project, dashboard, or (optionally) any file of a type that OmniPlan can open.
- Open from Server Repository

- Open the Server Repository window to choose and open an OmniPlan project from a shared server repository.
- Open Recent
- Open a recently accessed OmniPlan file.
- Close (Command-W)
- Close the frontmost OmniPlan window.
- Close All (Option-Command-W)
- Close all OmniPlan windows.
- Save (Command-S)
- Save any changes to the OmniPlan project or dashboard currently being edited.
- Duplicate (Shift-Command-S)
- Create an identical copy of the current file (the copy will not be saved until you choose a destination for it).
- Save As (Option-Shift-Command-S)
- Save a copy of the current file as a new file.
- Rename
- Change the title of the current file.
- Move To
- Change the location of the current file in your Mac’s directory structure.
- Save As Template
- Save the current OmniPlan project as a template that can be used as the basis for creating other new projects.
- Revert To
- Revert the current file to a previous version of the same file.
- Revert To Server Copy

- Revert the current OmniPlan project to the version stored on the server repository (if publishing and subscribing to one).
- Report (Option-Command-R)

- Open the Report window to choose a style and data set from which to generate a report of the current project.
- Export (Option-Command-E)
- Export your OmniPlan project in a variety of formats.
- Publish

- Publish the current OmniPlan project to a designated server repository (committing changes to the version of the project stored there).
- Page Setup (Shift-Command-P)
- Open the standard macOS Page Setup window, where you can change some settings for printing (or exporting to a PDF file). These settings are saved even if you quit OmniPlan.
- Print (Command-P)
- Open the standard macOS Print window, with a variety of options for printing (or creating a PDF file).
The Edit Menu
The Edit menu holds commands related to modifying the contents of tasks, resources, calendar blocks, inspector field values, and more. Cut, Copy, Paste, and Undo are all found here.
- Undo (Command-Z)
- Reverse the most recent change you made. You can keep stepping backwards like this if there are more changes you want to undo.
- Redo (Shift-Command-Z)
- Reenact the last change you undid. You can keep stepping forward through however many Undo commands you made.
- Cut (Command-X)
- Remove the selected text or items, putting them on the clipboard so you can paste them somewhere.
- Copy (Command-C)
- Put a copy of the selected text or items on the clipboard, so you can paste them somewhere.
- Copy As Link
- Put a link to the selected items on the clipboard; when you paste it, you get an address for each item.
- Paste (Command-V)
- Take whatever’s on the clipboard and insert it at the current selection. If the clipboard contains just text (not whole items), and you are editing the text of an item, the text is pasted at the insertion point. Otherwise, the contents of the clipboard are pasted as new items.
- Delete
- Remove the selected item(s) or text from your document.
- Select All (Command-A)
- Select everything in the outline, or if you are editing an item’s text, all text in the cell.
- Deselect All (Shift-Command-A)
- Clear the selection completely so that nothing is selected.
- Duplicate (Command-D)
- Make another item just like the selected one, immediately after it.
- Edit Note (Command-’)
- Move from the item text to the note area of an item, or move back from the note area to the item text.
- Attach File
- Choose a file to insert in the note area of the selected item.
- Find
-
This submenu contains the standard Find commands included in many macOS applications: Find (which opens a window where you can use regular expressions and search-and-replace), Find Next, Find Previous, Use Selection for Find (which enters the selected text as the text to search for), and Jump to Selection.
- Find (Command-F)
- Find Next (Command-G)
- Find Previous (Shift-Command-G)
- Use Selection for Find (Command-E)
- Spelling
-
This submenu contains the standard Spelling commands for the macOS spell checking system: Spelling (which opens the Spelling window), Check Spelling (which checks spelling in the document once), and Check Spelling While Typing (which turns the automatic spell checking on or off).
- Spelling (Command-:)
- Check Spelling (Command-;)
- Check Spelling As You Type
- Start Dictation (fn fn)
- With dictation enabled in ▸ System Preferences ▸ Dictation & Speech, select an editable text field and use this command to enter text via the spoken word.
- Emoji & Symbols (Control-Command-Space)
- Open the macOS Character Palette, where you can find characters not easily accessible from the keyboard, like ♆ and ☺.
The Format Menu
Styling of note text in OmniPlan is the domain of the Format menu, with options available for all common text styles you’re familiar with in macOS.
Formatting commands are only applicable in note fields.
- Show/Hide Fonts (Command-T)
- Show and hide the Fonts window.
- Bold (Command-B)
- Embolden the selected text.
- Italic (Command-I)
- Italicize the selected text.
- Underline (Command-U)
- Underline the selected text.
- Bigger (Command-+)
- Increase the size of the selected text.
- Smaller (Command-–)
- Decrease the size of the selected text.
- Show/Hide Colors (Shift-Command-C)
- Show and hide the Colors window.
- Copy Style (Option-Command-C)
- Copy the style of the selected text, so that you can apply it elsewhere with the Paste Style command. This uses a special style clipboard, so you don’t lose the data in the normal clipboard.
- Paste Style (Option-Command-V)
- Apply the style in the style clipboard (obtained using the Copy Style command) to the selected text.
The View Menu
The View menu contains options for configuring your project view on the fly. Show and hide various parts of the interface, and expand or collapse the details of items in the main outline here.
- Task View (Option-Command-1)
- Switch to Task View in the currently active project.
- Resource View (Option-Command-2)
- Switch to Resource View in the currently active project.
- Calendar View (Option-Command-3)
- Switch to Calendar View in the currently active project.
- Network View (Option-Command-4)
- Switch to Network View in the currently active project.
- Styles View (Option-Command-5)
- Switch to Styles View in the currently active project.
- Show/Hide Overview
- Show or hide the Overview bar in the currently active OmniPlan window.
- Outline
-
This submenu contains commands that customize the display of the outline in Task View.
-
Show/Hide Outline View — Show or hide the outline view along the left side of OmniPlan’s window.
-
Show/Hide Numbering — Show or hide row numbering in the outline.
-
Flat Numbering — Number each outline row with an integer (1, 2, 3, 4, etc.) regardless of parent or child status.
-
Hierarchical Numbering — Number rows according to their depth in the outline hierarchy (1, 1.1, 1.1.1, 1.1.2, etc.).
-
Always Show Full Text — Always show the full text of row titles.
-
Collapse When Not Editing — Truncate row title text to a single line when not editing the row.
-
Expand All (Control-Command-9) — Expand all rows in the outline to show any children they may have.
-
Collapse All (Control-Command-0) — Collapse all rows, hiding any children. Only top-level rows are visible.
-
Expand Rows (Command-9) — Expand the selected outline rows to reveal any children within them.
-
Collapse Rows (Command-0) — Collapse the selected rows, hiding all children.
-
- Baseline Comparison
-
With a baseline schedule set, this submenu controls how the baseline is displayed relative to the actual schedule.
-
Show Actual Schedule — Show only the actual schedule in the Gantt chart.
-
Show Baseline Schedule — Show only the baseline schedule in the Gantt chart.
-
Show Both Schedules — Show both the baseline and actual schedules as full-height bars in the Gantt chart. The baseline appears in grey, while tasks in the actual schedule retain their bar color; to the extent the baseline and actual schedules match, bars from the actual schedule overlap the baseline.
-
Show Split Schedules — Show both the baseline and actual schedules, split so each occupies half of the hight of each task row in the Gantt chart. The actual schedule occupies the top half of the row (using the original bar color) while the baseline fills the bottom half (in grey).
-
- Gantt, Timeline, or Calendar
-
This submenu contains controls for displaying various data in the Gantt chart in Task View, the Timeline in Resource View, or the Calendar in Calendar View.
-
Hide/Show Gantt, Timeline, or Calendar — Hide or show the Gantt, Timeline, or Calendar view, depending on how you are currently viewing the project.
-
Critical Path — Show or hide the critical path.
-
Resource Load — Show or hide resource loads for each resource in the timeline (Resource View only).
-
Dependency Lines — Show or hide dependency lines (Task View only).
-
Slack Lines — Show or hide slack lines (Task View only).
-
Group Shading — Turn group shading on or off (Task View only).
-
Constraints — Show or hide constraints.
-
Show Project Start — Apply shading to the chart area prior to the start of the project.
-
- Non-Working Time
-
This submenu contains options for display of non-working time in the Gantt chart (Task View) and Timeline (Resource View).
-
None — No non-working time is visually indicated.
-
Holidays — Holidays are denoted as non-working time.
-
Weekends — Weekends are denoted as non-working time.
-
All — All non-working time is denoted in the Gantt chart and Timeline.
-
- Show Scheduling Influences (Option-Command-?)
- Display a popover on the currently selected task that lists the factors influencing its schedule. (This command is only available when a single task is selected.)
- Scale To Fit Project (Option-Command-0)
- Scale the Gantt chart or Timeline to fit the entire project on a single screen.
- Scale To Fit Selection (Option-Shift-Command-0)
- Scale the Gantt chart or Timeline to maximize the space used on screen by the currently selected items.
- Zoom In (Command->)
- Scale the Gantt chart with progressively smaller time units, causing tasks to occupy more horizontal space on screen. This command only functions in Task View.
- Zoom Out (Command-<)
- Scale the Gantt chart with progressively larger time units, causing tasks to occupy less horizontal space on screen. This command only functions in Task View.
- Go to Today (Shift-Command-T)
- Navigate to the current date in the Gantt chart. This command only functions in Task View.
- Filter Tasks (Option-Command-F)
- Open the task filter dialog to create, edit, apply, or remove a filter that modifies which tasks are visible. When applied, a filter affects task visibility across all views.
- Update Current Filter
- Re-apply the current filter to the project to account for any changes made. (Newly added or edited tasks do not have the filter applied to them until the filter is refreshed.)
- Remove Filter
- Remove a currently applied filter, restoring visibility of all tasks.
- Restore Saved Filter
- Choose from the submenu here to apply a previously created and saved filter to the project.
- Focus (Shift-Command-F)
- Hide all tasks from view other than the ones currently selected (this menu item is only available when a group is selected).
- Show/Hide Toolbar
- Show or hide the toolbar.
- Customize Toolbar
- Choose which controls appear in the main window’s toolbar.
- Customize Touch Bar
- Choose which controls appear in the Touch Bar (on devices that support it).
- View Options (Command-J)
- Open View Options for the current view.
- Enter/Exit Full Screen (Control-Command-F)
- View OmniPlan at the glorious full dimensions of your screen, or return it to a modest window.
The Project Menu
The Project menu contains controls for managing a project once it is up and running.
- Set Baseline
- Create a baseline schedule from the current actual schedule of the project.
- Delete Baseline
- Delete a currently active baseline.
- Track Changes/Stop Tracking Changes (Option-Command-T)

- Turn change tracking on (or off) to monitor changes made to the project. This includes changes made locally as well as remotely by other users publishing changes to a shared server repository.
- Automatically Level Resources
- Enable (or disable) automatic resource leveling for the project. When enabled, the project is leveled every time a change is made.
- Level Resources (Shift-Command-L)
- Manually level the project to maximize scheduling and resource allocation.
- Clear Leveling
- Remove delays previously added by resource leveling, restoring tasks to their default scheduling parameters.
- Catch Up to Date (Option-Command-U)
- Mark all task work as complete up to the current date.
- Reschedule Incomplete Tasks (Shift-Command-R)
- Reschedule all tasks with incomplete work as of a specified date.
- Set Current Editing Date
- Designate a date (other than the current date) to serve as a benchmark for editing.
- Set as Default for New Tasks/Groups/Milestones
- Set the currently selected task, group, or milestone as the default configuration for newly created tasks, groups, or milestones.
- Configure Publishing & Subscriptions

- Set up publishing and subscription options for the current project.
- Publish (Control-Command-P)

- Publish local changes to the project to a shared server repository.
- Update (Control-Command-U)

- Update the project with remote changes from a shared server repository.
The Structure Menu
The Structure menu is for commands that manipulate items in your project based on their hierarchical position. This is primarily useful when working with nested tasks and groups.
- Add
-
This submenu contains commands for adding various types of tasks (in Task View) and resources (in Resource View) to the project. These commands are context dependent based on the currently selected task or resource.
-
Task/Resource (Return) — Add a new top level task to the task outline, or resource to the resource outline.
-
Dependent Task — Add a task connected to the currently selected task with a Finish → Start dependency.
-
Child Task/Resource (Command-}) — Add a task or resource nested inside the current task or resource. The currently selected task or resource becomes a task or resource group.
-
Aunt Task/Resource (Command-{) — Add a task or resource at a level of hierarchy above the currently selected task or resource.
-
Group — Add an empty group task or resource to the project.
-
Dependent Group — Add an empty group task connected to the currently selected task with a Finish → Start dependency.
-
Milestone (Shift-Command-M) — Add a milestone to the project.
-
Dependent Milestone — Add a milestone connected to the currently selected task with a Finish → Start dependency.
-
Equipment Resource — Add an equipment resource to the resource list.
-
Material Resource — Add a material resource to the resource list.
-
- Move
-
These commands rearrange the currently selected item in the outline hierarchy without affecting deselected items. Move Up and Move Down change an item’s location in relation to its siblings. Move Right and Move Left increase or decrease an item’s indentation level. When items move, their descendants move with them.
- Move Down (Control-Command-Down Arrow)
- Move Right (Control-Command-Right Arrow)
- Move Up (Control-Command-Up Arrow)
- Move Left (Control-Command-Left Arrow)
- Indent (Command-])
- Move the selected item to the right, turning it into a child of the item before it in the outline.
- Outdent (Command-[)
- Move the selected item to the left, making it a sibling of what was its parent. This doesn’t change the location of the item’s former siblings; only the selected item’s position in the hierarchy is affected.
- Group (Option-Command-L)
- With one or more tasks selected, create a new group task and add any selected tasks to the group.
- Ungroup
- If any selected tasks are part of a group, remove them from the group. They become top level tasks (and may leave empty group tasks behind).
- Split Task (Option-Command-S)
- Split a currently selected task into multiple pieces with a gap between them.
- Connect Tasks
-
This submenu contains commands for creating dependency relationships between selected tasks.
- Start → Start
- Start → Finish
- Finish → Start (Control-Command-=)
- Finish → Finish
- Disconnect Tasks (Control-Command--)
- Remove any dependency relationships between the selected tasks.
- Assign Resource
- Assign a resource from the attached submenu to the selected task or tasks.
- Clear Assignments (Option-Command-Delete)
- Remove resource assignments from the selected task or tasks.
- Sort All Tasks/Resources or Sort Selected Tasks/Resources
-
This submenu contains commands for sorting a selection of tasks (in Task View) or resources (in Resource View) by various parameters.
- Title, A-Z
- Title, Z-A
- Effort, Lowest to Highest
- Effort, Highest to Lowest
The Inspectors Menu
This menu contains commands for navigating between OmniPlan’s various inspectors.
- Show/Hide Inspector (Shift-Command-I)
- Show or hide the inspector pane on the right side of the active project window.
- Project
- Open the Project inspector.
- Milestones
- Open the Milestones inspector.
- Task
- Open the Task inspector.
- Resource
- Open the Resource inspector.
- Styles
- Open the Styles inspector.
- Custom Data
- Open the Custom Data inspector.
- Attachments
- Open the Attachments inspector.
The Window Menu
This menu contains controls for opening, switching between, and otherwise manipulating the project window.
- Minimize Window (Command-M)
- Shrink the frontmost window down into the Dock.
- Minimize All (Option-Command-M)
- Shrink all open OmniPlan windows down into the Dock.
- Zoom/Zoom All
- Switch the frontmost window between the biggest size possible and the last size you set. Holding Option changes this to Zoom All, which expands or reverts all open windows to their maximum or previous sizes.
- New Window on “Document”
- Opens a new window on the currently active project file.
- Violations (Shift-Command-V)
- Open the Violations window for the current project.
- Bring All to Front
- Bring all OmniPlan windows to the foreground of your screen. Holding Option changes this to Arrange in Front, which additionally lays out your OmniPlan windows in a geometric arrangement that maximizes their visibility.
At the bottom of the Window menu is a list of all of your OmniPlan windows; choose one to bring it to the front.
The Help Menu
Access a variety of support resources using the Help menu in OmniPlan, including this documentation, release notes, and contact with our friendly Support Humans.
- Search
- Filter commands across all of OmniPlan’s menus to find and select a specific command.
- OmniPlan Help
- View the help documentation available in the in-app help viewer.
- Keyboard Shortcuts
- Open a document containing a list of useful OmniPlan keyboard shortcuts.
- Release Notes
- Check out what’s new since the last version of OmniPlan.
- Open Scripts Folder

- Open the designated Finder folder for stashing AppleScript scripts that you want to access from the toolbar.
- Contact Omni
- Compose an email to the OmniPlan support team. We’d be happy to give advice, answer questions, or just listen to your feedback.
If you’d like to set up a keyboard shortcut for a menu item that doesn’t have one, open System Preferences ▸ Keyboard and choose the Shortcuts tab. Pick App Shortcuts from the list on the left, then press the plus button beneath.
Choose OmniPlan.app from the Application drop down list that appears, then enter the exact text of the menu command you’d like a shortcut for in the Menu Title field. Put your cursor in the Keyboard Shortcut field, then press the key combination you want for the shortcut. Finally, click Add to save your new custom shortcut.
Return to OmniPlan and give it a try!
Chapter 115
Glossary
The following is a list of terms specific to OmniPlan or project management that you’ll encounter throughout this manual, defined and listed in alphabetical order for easy reference.
- Actual schedule
- The actual schedule, in contrast to the baseline schedule, is the way a project turns out in real life. Before the baseline is set for a project, the baseline and actual schedules are the same. After the baseline is set, further editing changes the actual schedule only.
- Attachment
- An attachment is a link to a file somewhere on your computer from inside your OmniPlan project. You can attach files to the project, to a task, or to a resource.
- Assignment
- Assigning a resource to a task means that the resource is expected to be actively busy with that task throughout its duration. Assignment amounts are expressed as the percentage of the resource’s time being spent on the task.
- Baseline schedule
- The baseline schedule, in contrast to the actual schedule, is the way a project is originally planned. Before the baseline is set for a project, the baseline and actual schedules are the same. After the baseline is set, further editing changes the actual schedule only. You can compare the baseline schedule and the actual schedule using the split or both view modes of the Gantt chart.
- Calendar View
- The mode of the main window in which you can set up working hours and work schedule exceptions for individual resources or for the project as a whole. It contains a replica of the resource outline on the left, and a week view, with green time blocks, on the right.
- Child
- A member of a group is considered the group’s child; this is common terminology for outlining software.
- Cost
- A task or a resource can have a monetary cost. The total cost of a task is the sum of the task cost and the costs of the resources assigned to it. A resource can have a per-use cost and a per-hour cost.
- Critical path
- The critical path is the series of dependent tasks which, if any of their durations change, will cause the whole project’s duration to change. You can check the critical path from the View menu or the Critical Path toolbar button. Critical paths can be charted to individual milestones as well as to the entire project duration; view a milestone’s critical path by toggling its checkbox in the Milestones inspector.
- Custom data
- Data you can attach to any project, task, or resource, for your own purposes.
- Dependency
- The relationship by which one task must start or finish before another task can start or finish. For example, the task Buy paint must finish before the task Paint fence can begin.
- Duration
- Duration, in contrast to effort, is how long a task takes to complete in actual working time (that is, not including off-time). For example, a task which takes 4 hours of effort, and is assigned to 2 resources, has a duration of 2 hours. When you assign resources to a task, the duration or effort may change.
- Efficiency
- The measure of how much work a resource can get done in a certain amount of time. Efficiency can affect duration and effort: 100% efficiency means the resource can contribute 1 hour of effort for every hour of work; 50% efficiency means it can contribute 1 hour of effort for every 2 hours of work; and so on.
- Effort
- Effort, in contrast, to duration, is how much work time a task takes to complete, considering all of the resources assigned to it. For example, a task which has a duration of 4 hours, and has 2 resources assigned to it, has an effort of 8 hours. When you assign resources to a task, the duration or effort may change.
- Equipment
- Equipment is a type of resource. It represents some kind of reusable asset, such as some special computer hardware. It can also be useful to consider things like meeting rooms to be equipment, if you need to balance their use between different tasks.
- For equipment resources, Units means how many of the resource are available. The number of available units can affect resource leveling.
- Equipment can have Efficiency, Cost per Use, and Cost per Hour values.
- Gantt Chart
- A Gantt chart is a chronological representation of the project, shown in OmniPlan on the right side of the Task View. Each task is represented by a bar, corresponding to a row in the task outline, and may be connected to other tasks by lines representing dependencies; the horizontal size and position of the bar indicate the expected duration and schedule for the task.
- Group
- Items in the task outline or the resource outline can be grouped together. The members, or children, of the group appear indented from the group itself in the outline. In the Gantt chart, a task group appears as a bracket enclosing its members.
- Hammock
- A task of flexible effort whose duration changes based on constraints imposed by tasks scheduled before and after it.
- Item
- A single row in either the task outline or the resource outline. General outlining commands like Indent and Outdent, Expand and Collapse, work on items in either outline.
- Lead Time
- Lead time is a duration you can put on a dependency to mean that some amount of time is needed between the two moments involved. For example, a Start→Start dependency with a lead time of 1 day means that after the first task starts, the second task can start one day later.
- Lead time can be negative; for instance a Finish→Start dependency with a –2 hour lead time will allow the second task to start once the first task is 2 hours from completion.
- You can set up lead time by typing a duration (such as +3w or –2d4h) either at the end of a dependency code in the Dependents or Prerequisites column of the task outline, or in the Task Dependencies inspector.
- Lead time can also be a percentage of the predecessor task’s duration; for example you could enter 100% for a lead time just as long as the task it comes after.
- Level
- Leveling the project, or leveling resources, means automatically rearranging the project to make sure the resources are being used as efficiently as possible. This means not allowing a resource to be assigned at more than 100% of its available units at any time, and finding the best order for resources to work on tasks in order to complete them more quickly.
- Newly created projects are set to automatically level resources as they are allocated to tasks. You can disable automatic leveling in the Project menu.
- When not leveling automatically, you should level your project after making changes like updating task completion or changing resource assignments.
- Material
- Material is a type of resource, representing consumable supplies.
- For material resources, Units means how many of the resource are being used throughout the project. This value updates as the resource is assigned to more tasks.
- Material resources can have Cost per Use and Cost per Hour values.
- Milestone
- A milestone is like a task, except that it has no duration and requires no effort. Its purpose is to mark an important point in the project timeline. Based on dependencies and work schedules, a milestone may shift in time; you can keep track of your project’s milestones in Task View and the Milestones inspector.
- Monte Carlo Estimation
- The Monte Carlo simulation method uses random sampling based on a spread of values to estimate probable outcomes — in the case of OmniPlan Pro, the likelihood that your project or milestone will reach completion on time. When a simulation is run, hundreds of randomized possible outcomes are considered, and the average result is reported as a percentile of confidence that the milestone will be reached on a given day.
- Because the estimate data used is randomized across a range of possible values, running multiple Monte Carlo simulations on the same data set will generate slightly different results each time. However, the number of iterations in a single simulation is high enough to eliminate grossly inaccurate outliers.
- Network Diagram
- A visualization tool that describes a project as a web of task nodes connected by dependencies. Unlike a Gantt chart, a network diagram deemphasizes project chronology in favor of a clear, evident depiction of the relationships between tasks.
- Parent
- A group is considered the parent of all its members; this is common terminology for outlining software.
- Publishing
- When a project is publishing information about itself, it is telling other projects in a shared server repository what resources assigned to it are up to. If a resource is shared between projects (as indicated by an identifying email address), the load on that resource indicated by all publishing projects is taken into account when leveling across projects subscribing to the repository.
- Resource
- Resources are the people and things needed to get a project done. Resources are listed in the resource outline, and can be assigned to tasks. The three types of resources are Staff, Material, and Equipment.
- Resource load, Resource allocation
- A resource’s load is the amount of effort it is assigned to do at various times throughout the project. If a resource is assigned at more than 100% of its availability all at once, it is said to be overloaded or overutilized. Resource leveling tries to alleviate overload of resources. You can see each resource’s load by turning on the resource allocation graphs modeswitcher in the resource timeline.
- Resource timeline
- On the right side of the resource view is a timeline of the tasks assigned to each resource. It provides a more vertically-compressed, resource-oriented look at the project.
- Resource view
- The mode of the main window in which you create, edit, and examine resources. It contains the resource outline on the left and the resource timeline on the right.
- Slack
- Also known as float, in project management terminology slack refers to the amount of time a given task can be deferred until its duration to completion conflicts with the beginning of a subsequent dependent task (thereby causing a delay). Free slack refers to slack specific to a task and its successor, while total slack refers to a sum of all free slack in the project up to completion. Both values can be displayed as columns in Task View.
- Staff
- Staff is a type of resource, representing people who work on the project.
- Staff units are measured as percentages. A person who is fully available to the project has a units value of 100%; someone who is spending part of their working hours on other projects would have lower available units. Note that this is not the same as having fewer working hours (which can be set in the calendar view), or being less efficient (which can be set in the Resource Info section of the Resource inspector).
- Staff can have Address, Efficiency, Cost per Use, and Cost per Hour values.
- Subscribing
- When a project is subscribing to a shared server repository, it is on the lookout for resource load data being published by other projects. When leveling loads, a subscriber will adjust resources based on usage information received from the published projects.
- T day
- The first day of a project that has an undetermined start date. Until the start date is set, all dates are represented by an amount of time after T day, such as T+2w 1d
- Task
- Some item of work that needs to be done for the project to progress. A task is represented by a row in the task outline, and by a corresponding task bar in the Gantt chart.
- Task View
- The mode of the main window in which you create, edit, and examine tasks. It contains the task outline on the left and the Gantt chart on the right.
- Template
- A template is a file you can use as a starting point for new documents. There are also HTML templates, which are used for creating a web report of a project.
- Units
- Units measure amounts of resources in various contexts. For a staff resource, the units value is a percentage representing how much of the person’s time is available to be assigned to tasks. For equipment and material resources, the units value is a number representing a physical quantity.
- Variance
- Variance is the amount of time by which the actual date differs from the baseline date.
- Violation
- A violation is some sort of problem in the project that prevents it from working out properly. Such problems are things like tasks that start before the project start date, tasks that don’t have enough time to complete before their dependent tasks need to start, or dependencies that cause a task to be prerequisite to itself.
Chapter 116
Managing Your Omni Licenses
Thanks for your purchase — or prospective purchase — of OmniPlan! If you’re in the market to buy the app after trying it out, or just need to enter a new license code, this chapter covers the quick and painless process of Omni licensing.
You can disregard this chapter if you’ve purchased your copy of OmniPlan (Standard or Pro) from the Mac App Store, where licensing is done automatically at the time of purchase. This chapter applies only to licenses purchased from the Omni Store, and the Licenses menu item only appears for those purchases.
To check the status of your Mac App Store purchase, choose OmniPlan ▸ In-App Purchase instead.
From the menu bar, choose OmniPlan ▸ Licenses to see the Licenses dialog. From here you can review and edit your OmniPlan licenses, which verify that you’ve actually paid for the software. (Thanks!)
To purchase a license:
- Click Buy Licenses and you will find yourself magically transported to the Omni Store, where you can purchase a license for the Mac versions of our software. (Naturally, this only works if you have an Internet connection.)
To add a new license:
- From the menu bar, choose OmniPlan ▸ Licenses to see the Licenses dialog.
- Click Add License.
- If you have a license key in an email message, copy and paste both the Owner name and the License Key into the appropriate fields. If you can’t copy and paste the information, you’ll have to type it in; make sure you enter everything exactly as it appears in your license message, including the dashes. Also, double-check that the license you’re entering really is a license for OmniPlan 3; licenses for other Omni products or earlier versions of OmniPlan won’t work.
-
The Type drop-down menu is grayed out by default, which limits the license type to Personal for the current user account on your Mac. OmniPlan has two different types of licenses:
- Personal: This license is for your personal use, and will only be available on this computer when you are logged in as the user who installed the license. You can install this license on more than one computer, but only for your personal use. You should not use the software on two different computers at the same time with this kind of license. If a personal license is available, the application will always use it.
- Computer: You can use this license on this computer, and so can any other user of this computer. However, you should not install this license on more computers than it has license seats for.
If there is more than one user account on your Mac, and you’d like everyone on your Mac to discover the awesomeness that is OmniPlan, you’ll need to jump through a couple of hoops (thanks to Apple’s mandated app sandboxing for macOS 10.7 and above). To set up a Computer license, follow these steps:
- Quit OmniPlan 3.
- Open a new Finder window.
- Switch the Finder’s view settings to Column, by choosing View ▸ as Columns (or use Command–3. This will make it easier for you to traverse the folder hierarchy on your Mac.
- Choose Go ▸ Computer.
-
Choose your Mac’s hard drive (if you haven’t renamed it, it should be named Macintosh HD), and then traverse through the following folders:
- Library
- Application Support
-
In the Application Support folder, create a new folder (choose File ▸ New Folder, or use Shift-Command-N) and name it Omni Group. You will need to enter your admin password to create a new folder at this level.
- In the Omni Group folder, create a new folder and name it Software Licenses.
- Open OmniPlan 3 again, and then choose OmniPlan ▸ Licenses.
- Click Add License.
When you click Add License, you’ll notice that the Type drop-down menu is no longer grayed out, and the Computer option is available for selection. Now just enter the Owner and License Key information you received from us, click Save, and you should be set.
To remove a license:
- Select the license you want to remove
- Click Delete License.
To move a license from one Mac to another:
- First, find the license file on the old computer. OmniPlan license files are located in the folder Library/Application Support/Omni Group/Software Licenses, where Library is either at the top level of your system disk (for computer licenses), or in your Home folder (for personal licenses). The file you are looking for has a name such as omniplan–123456.omnilicense. Move this file to the new computer.
- On the new computer, choose OmniPlan ▸ Licenses from the menu bar and then click Add License.
- On the sheet that appears, click Import License File.
- Locate and select the license file that you want to import.
- Click Open. If the license file is compatible—meaning, it is for the same version of OmniPlan—the license will be added to OmniPlan on your other system.
Again, the thing to remember here is that license keys are version-specific; any license key you have for an earlier version of OmniPlan is not compatible with OmniPlan 3 (and vice versa).
Chapter 117
Getting Help
When you’re in need of help—whether you’re puzzled by the Gantt chart, having trouble syncing, or experiencing another issue with OmniPlan—it’s good to know that the Support Humans at The Omni Group are available to lend you a hand.
The OmniPlan Website
The OmniPlan website is a great place to find the latest information about OmniPlan, complete with an ever-growing support section. Here you’ll find our ever-expanding and searchable body of OmniPlan support articles, which are a particularly great resource for when you’re stuck or puzzled.
The Official Forums
The Omni Group maintains online forums for all of our products, and you’re invited! Come share your questions and ideas with other users and Omni staff.
Email Support
If you’re stuck, if you have a good idea for a future version of OmniPlan, or if you just want to let us know how we’re doing, go ahead and send us an email. Choose Contact Omni from the Help menu to conjure up a message addressed to us. We take support seriously, so you can expect a prompt response actually typed by human hands.
Release Notes
For detailed information about what has changed in each minor version of OmniPlan, check out the release notes in the Help menu.