When OmniFocus for the Web behaves unexpectedly, our Support Humans may ask you to turn on debug logging and send along the browser console log. The log can tell us what actions were being performed by the app which will help us track down the issue.
Retrieving the information from the console log is slightly different for each browser.
Continue to instructions for:
Chrome
-
First, turn on the debug logging. Access the Debug Settings in OmniFocus for the Web and check the box for Console Logging (Debug settings for the test site require a different URL)
-
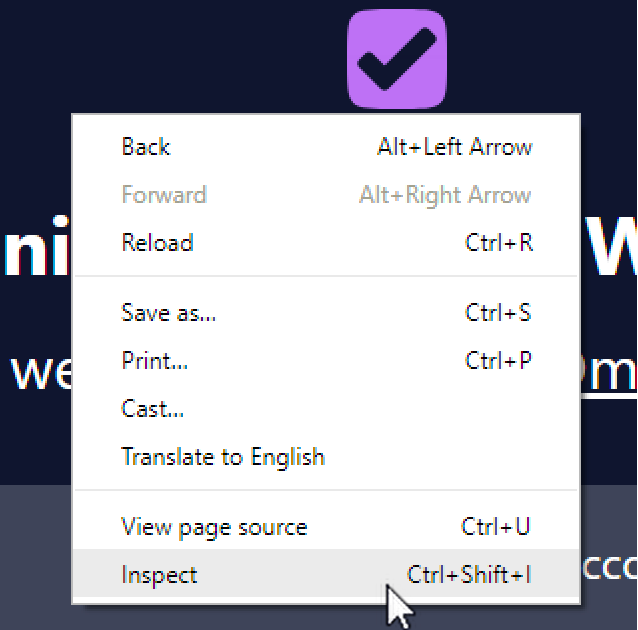
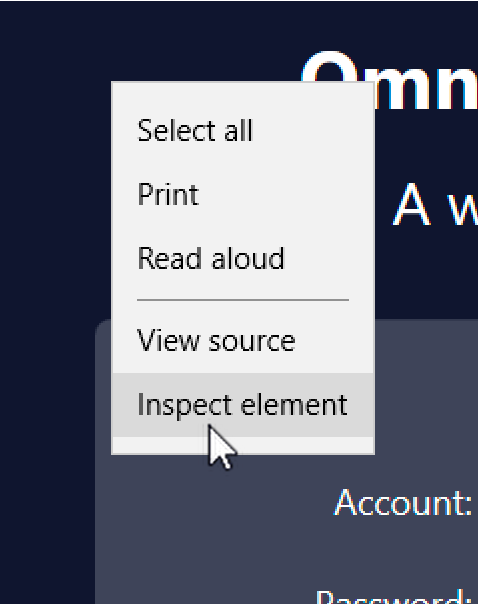
Right after the issue occurs, right-click on any screen of the OmniFocus for the Web app and select Inspect to open the dev tools
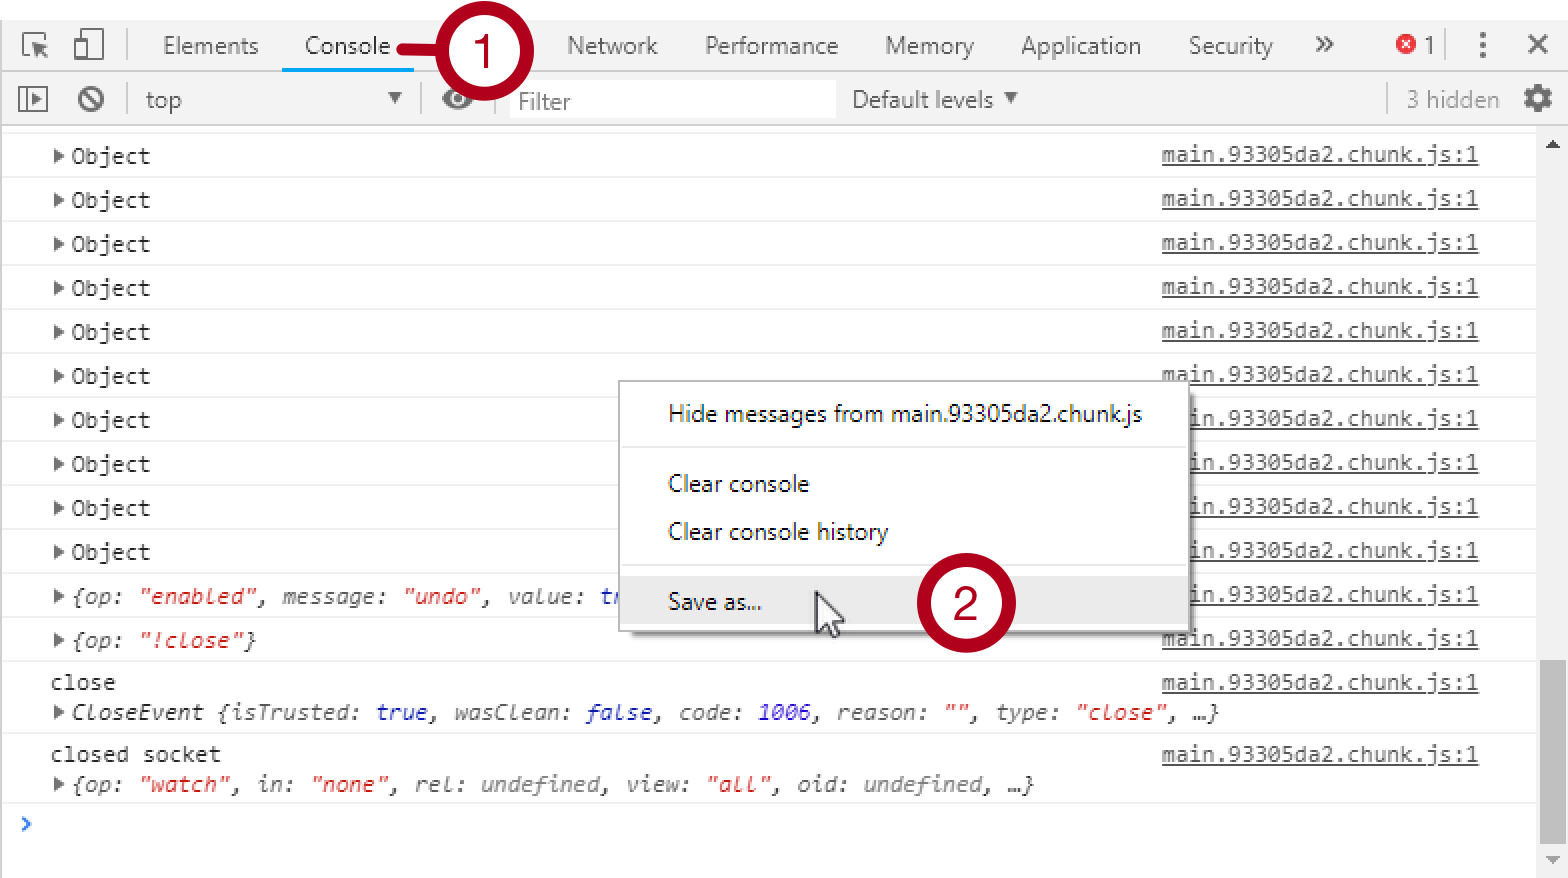
- Click on the Console tab (1)
- Right-click in the Console content area and select Save as… (2)
- Save the file somewhere convenient and attach that to your email
- Once finished you will want to turn off the console logging for optimal performance.
Firefox
- First, turn on the debug logging. Access the Debug Settings in OmniFocus for the Web and check the box for Console Logging (Debug settings for the test site require a different URL)
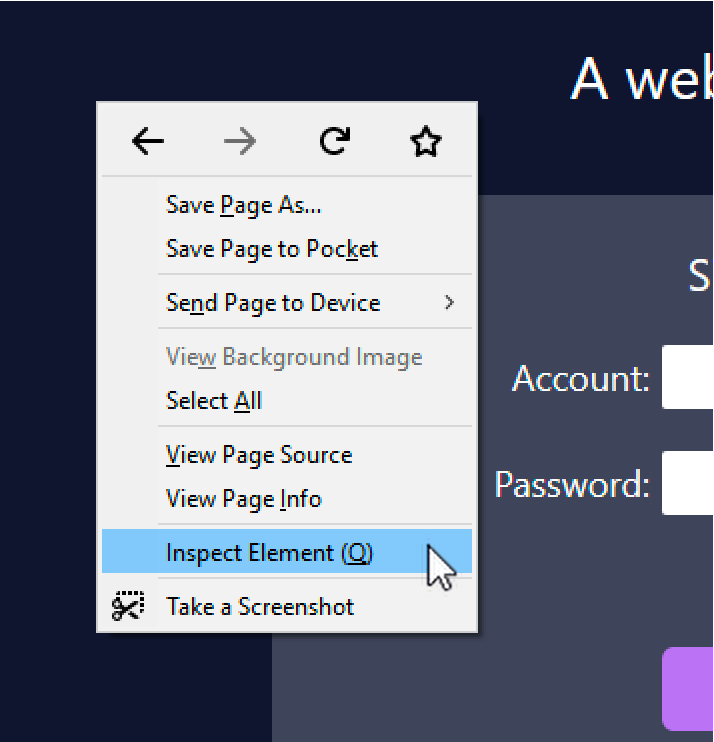
- Right after the issue occurs, right-click on any screen of the OmniFocus for the Web app and select Inspect Element to open the dev tools
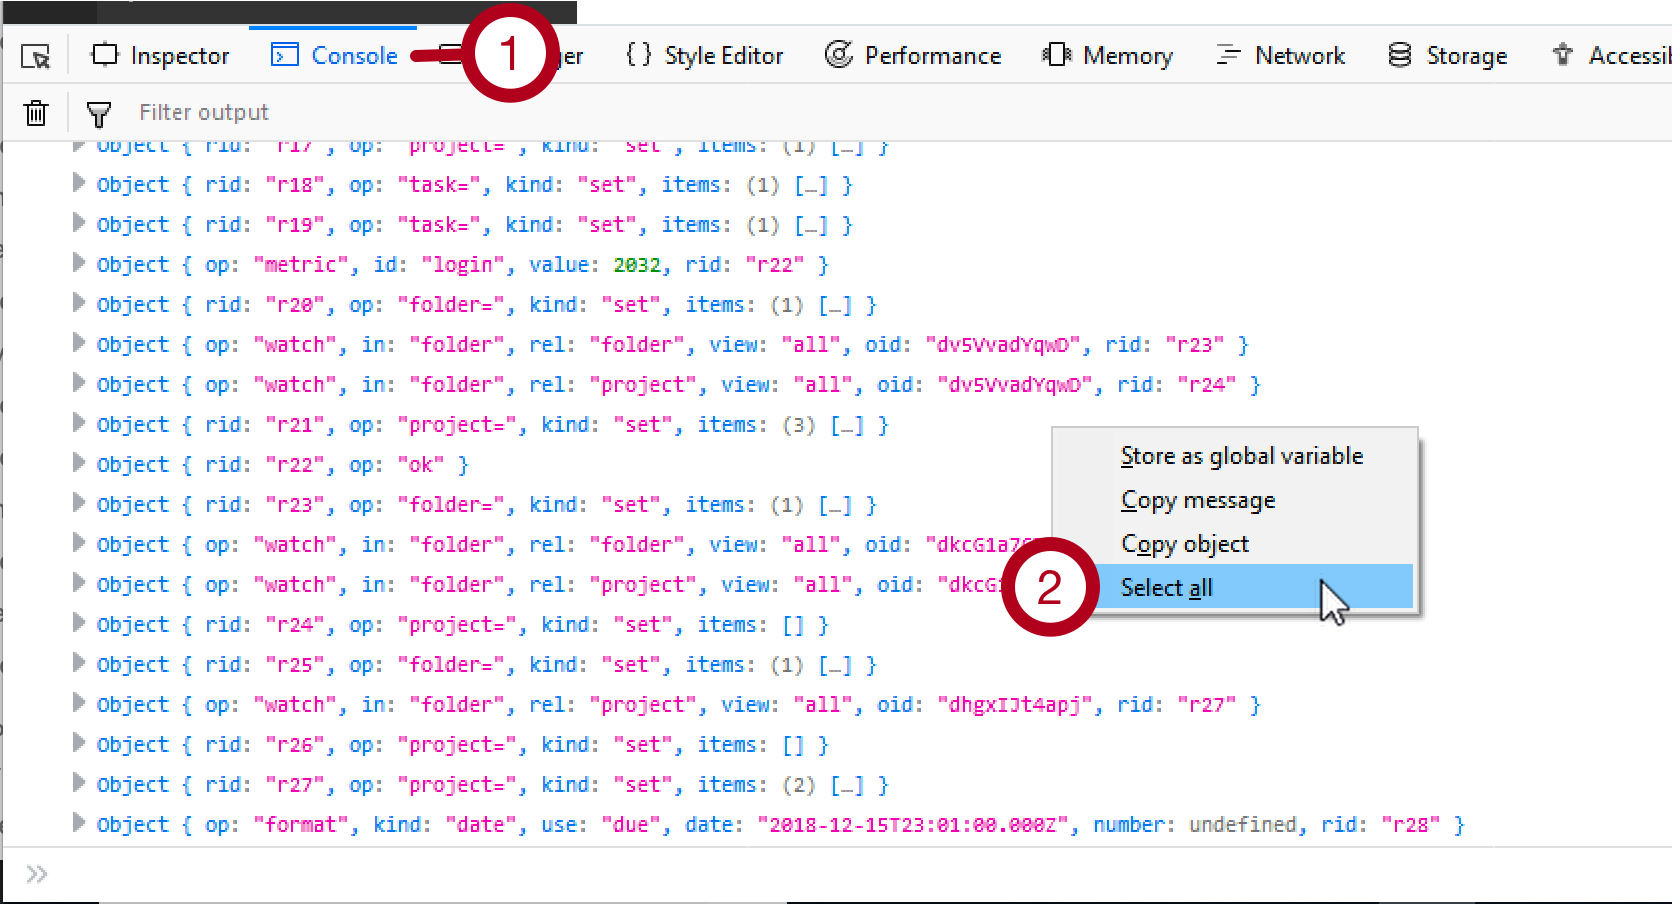
- Click on the Console tab (1)
- Right-click in the Console area and click Select all (2)
- Use control-C to copy all of it and paste that into the email
- Once finished you will want to turn off the console logging for optimal performance.
Edge
- First, turn on the debug logging. Access the Debug Settings in OmniFocus for the Web and check the box for Console Logging (Debug settings for the test site require a different URL)
- Right after the issue occurs, right-click on any screen of the OmniFocus for the Web app and select Inspect Element to open the dev tools
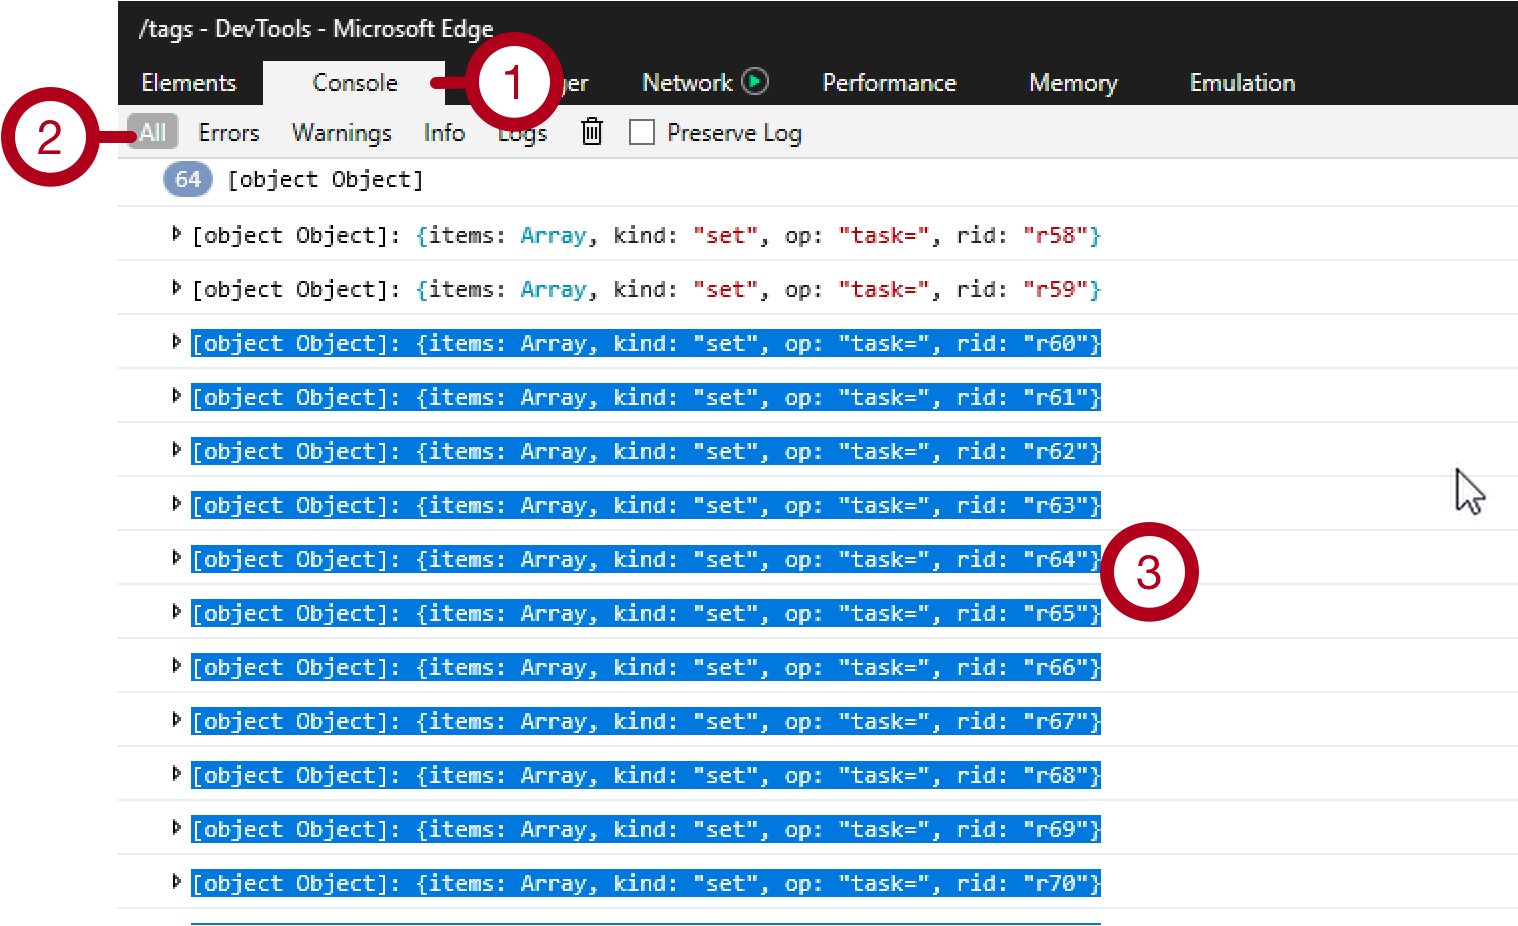
- Click on the Console tab (1)
- Change the filter to All if not already selected (2)
- Drag select some the contents of the Console to start a selection (3)
- Use control-A to select the whole log
- Use control-C to copy all of it and paste that into the email
- Once finished you will want to turn off the console logging for optimal performance.
Safari
- First, turn on the debug logging. Access the Debug Settings in OmniFocus for the Web and check the box for Console Logging (Debug settings for the test site require a different URL)
- Right after the issue occurs, right-click on any screen of the OmniFocus for the Web app and select Inspect Element to open the dev tools

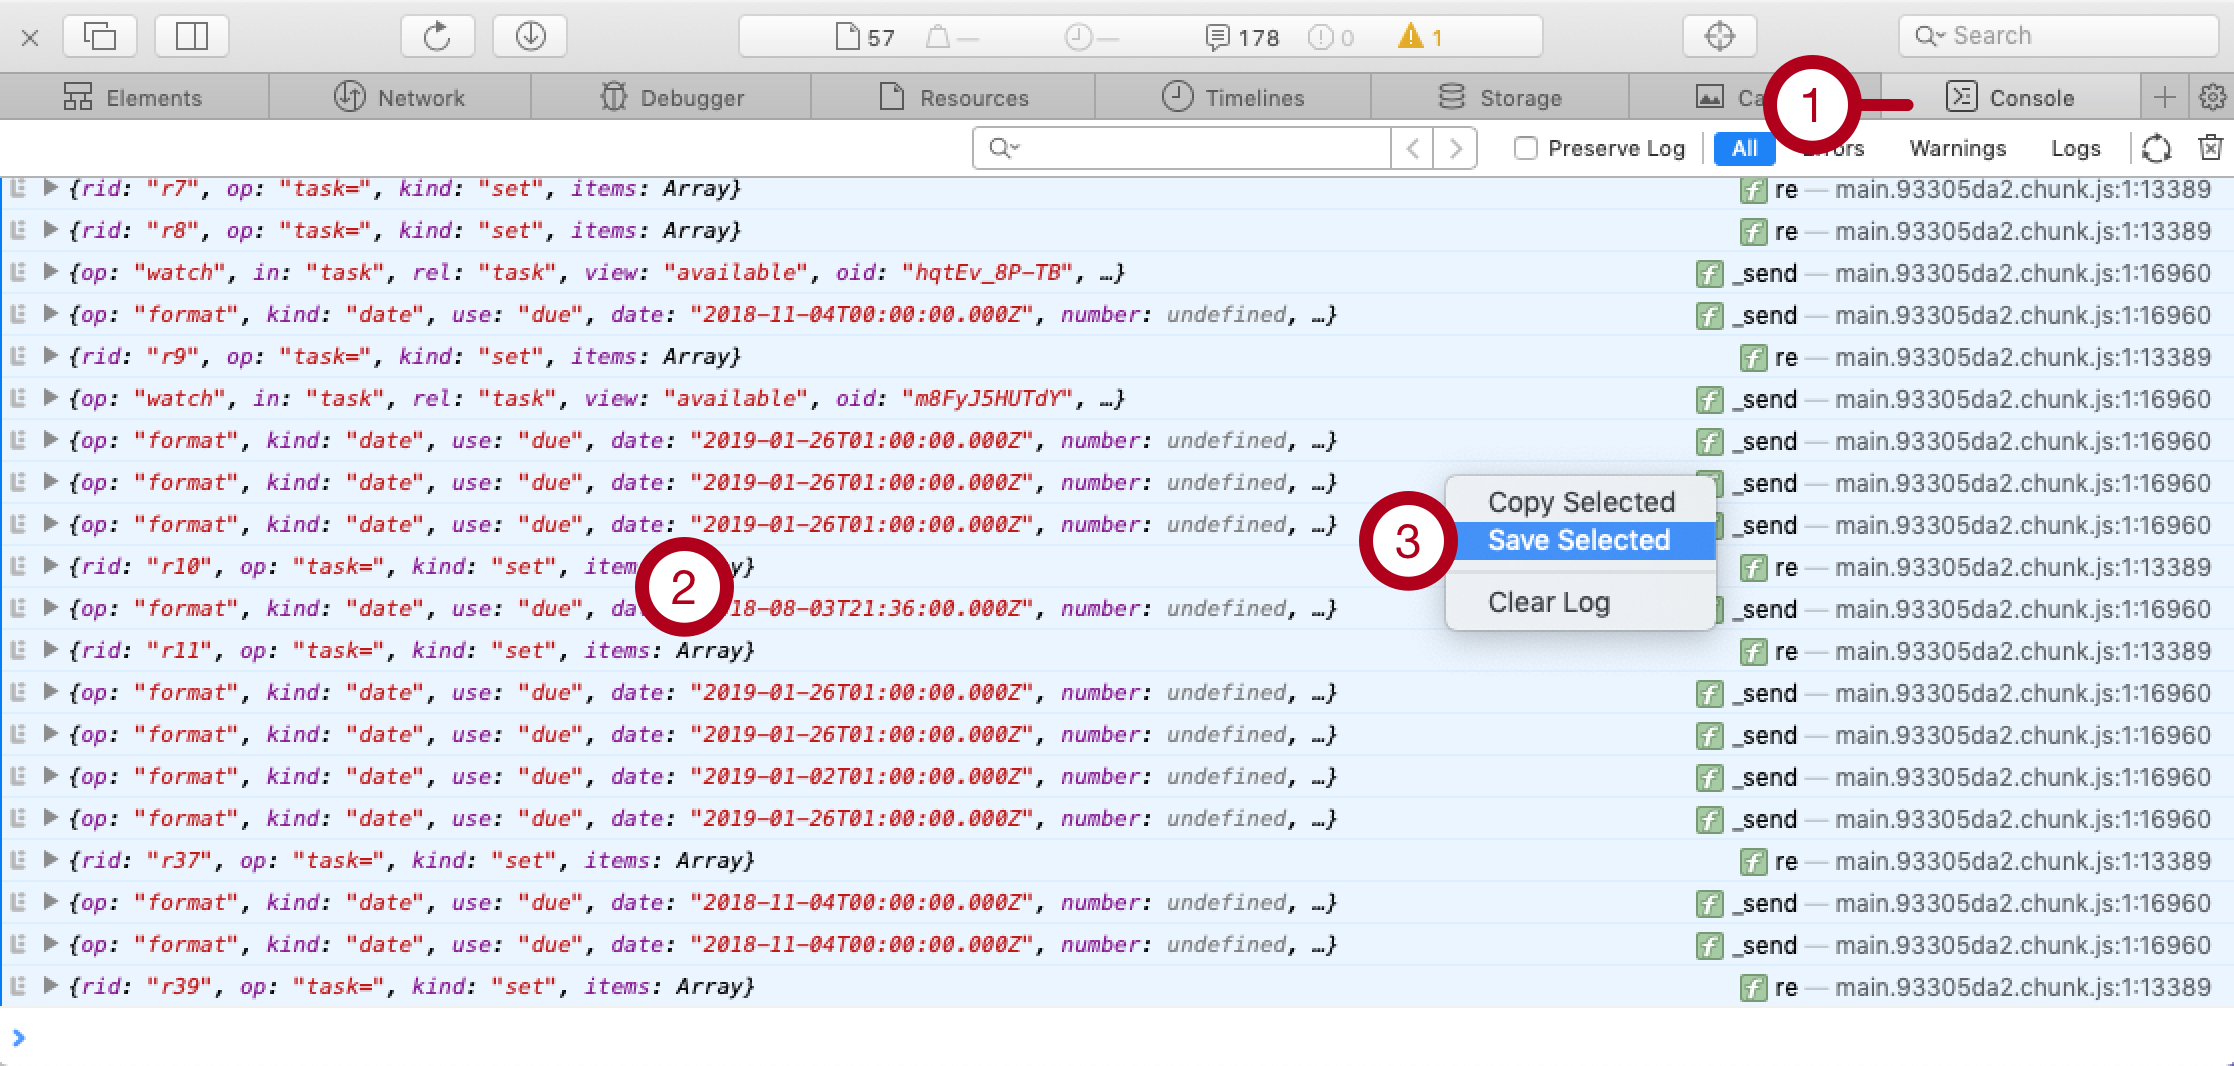
- Click on the Console tab (1)
- Select one of the entries in the Console then use Cmd-A to select all the messages (2)
- Right-click in the Console area and select Save Selected
- Save the file somewhere convenient and attach that to your email
- Once finished you will want to turn off the console logging for optimal performance. (Debug settings for the test site require a different URL)