Getting to Know OmniPlan
When you first launch OmniPlan you’re presented with a fresh new OmniPlan document, ready for cultivating to match the precise needs of the project at hand. What follows is an introduction to the various pieces of the app that you’ll be interacting with to craft a project to your specifications. To jump right in and get to work, see the next chapter, Working in OmniPlan: A Tutorial.
The Toolbar
Like most applications, the toolbar has buttons for commands you use frequently. We’ve included a default set of controls that many OmniPlan users find convenient, but you can use View ▸ Customize Toolbar to add and remove whichever ones you like.

The Overview
The toolbar has an optional companion in the Overview, a horizontal bar with a condensed view of the Gantt chart that appears when you choose View ▸ Show Overview. The overview is a great way to get a quick survey of your entire project no matter which view you’re in.

In Task and Resource Views, the Overview also offers an alternate control for browsing through your project — just click and drag the selection box to scroll through the main view’s Gantt chart or resource timeline.
Task View
Click the first button in the view control to see the Task View.
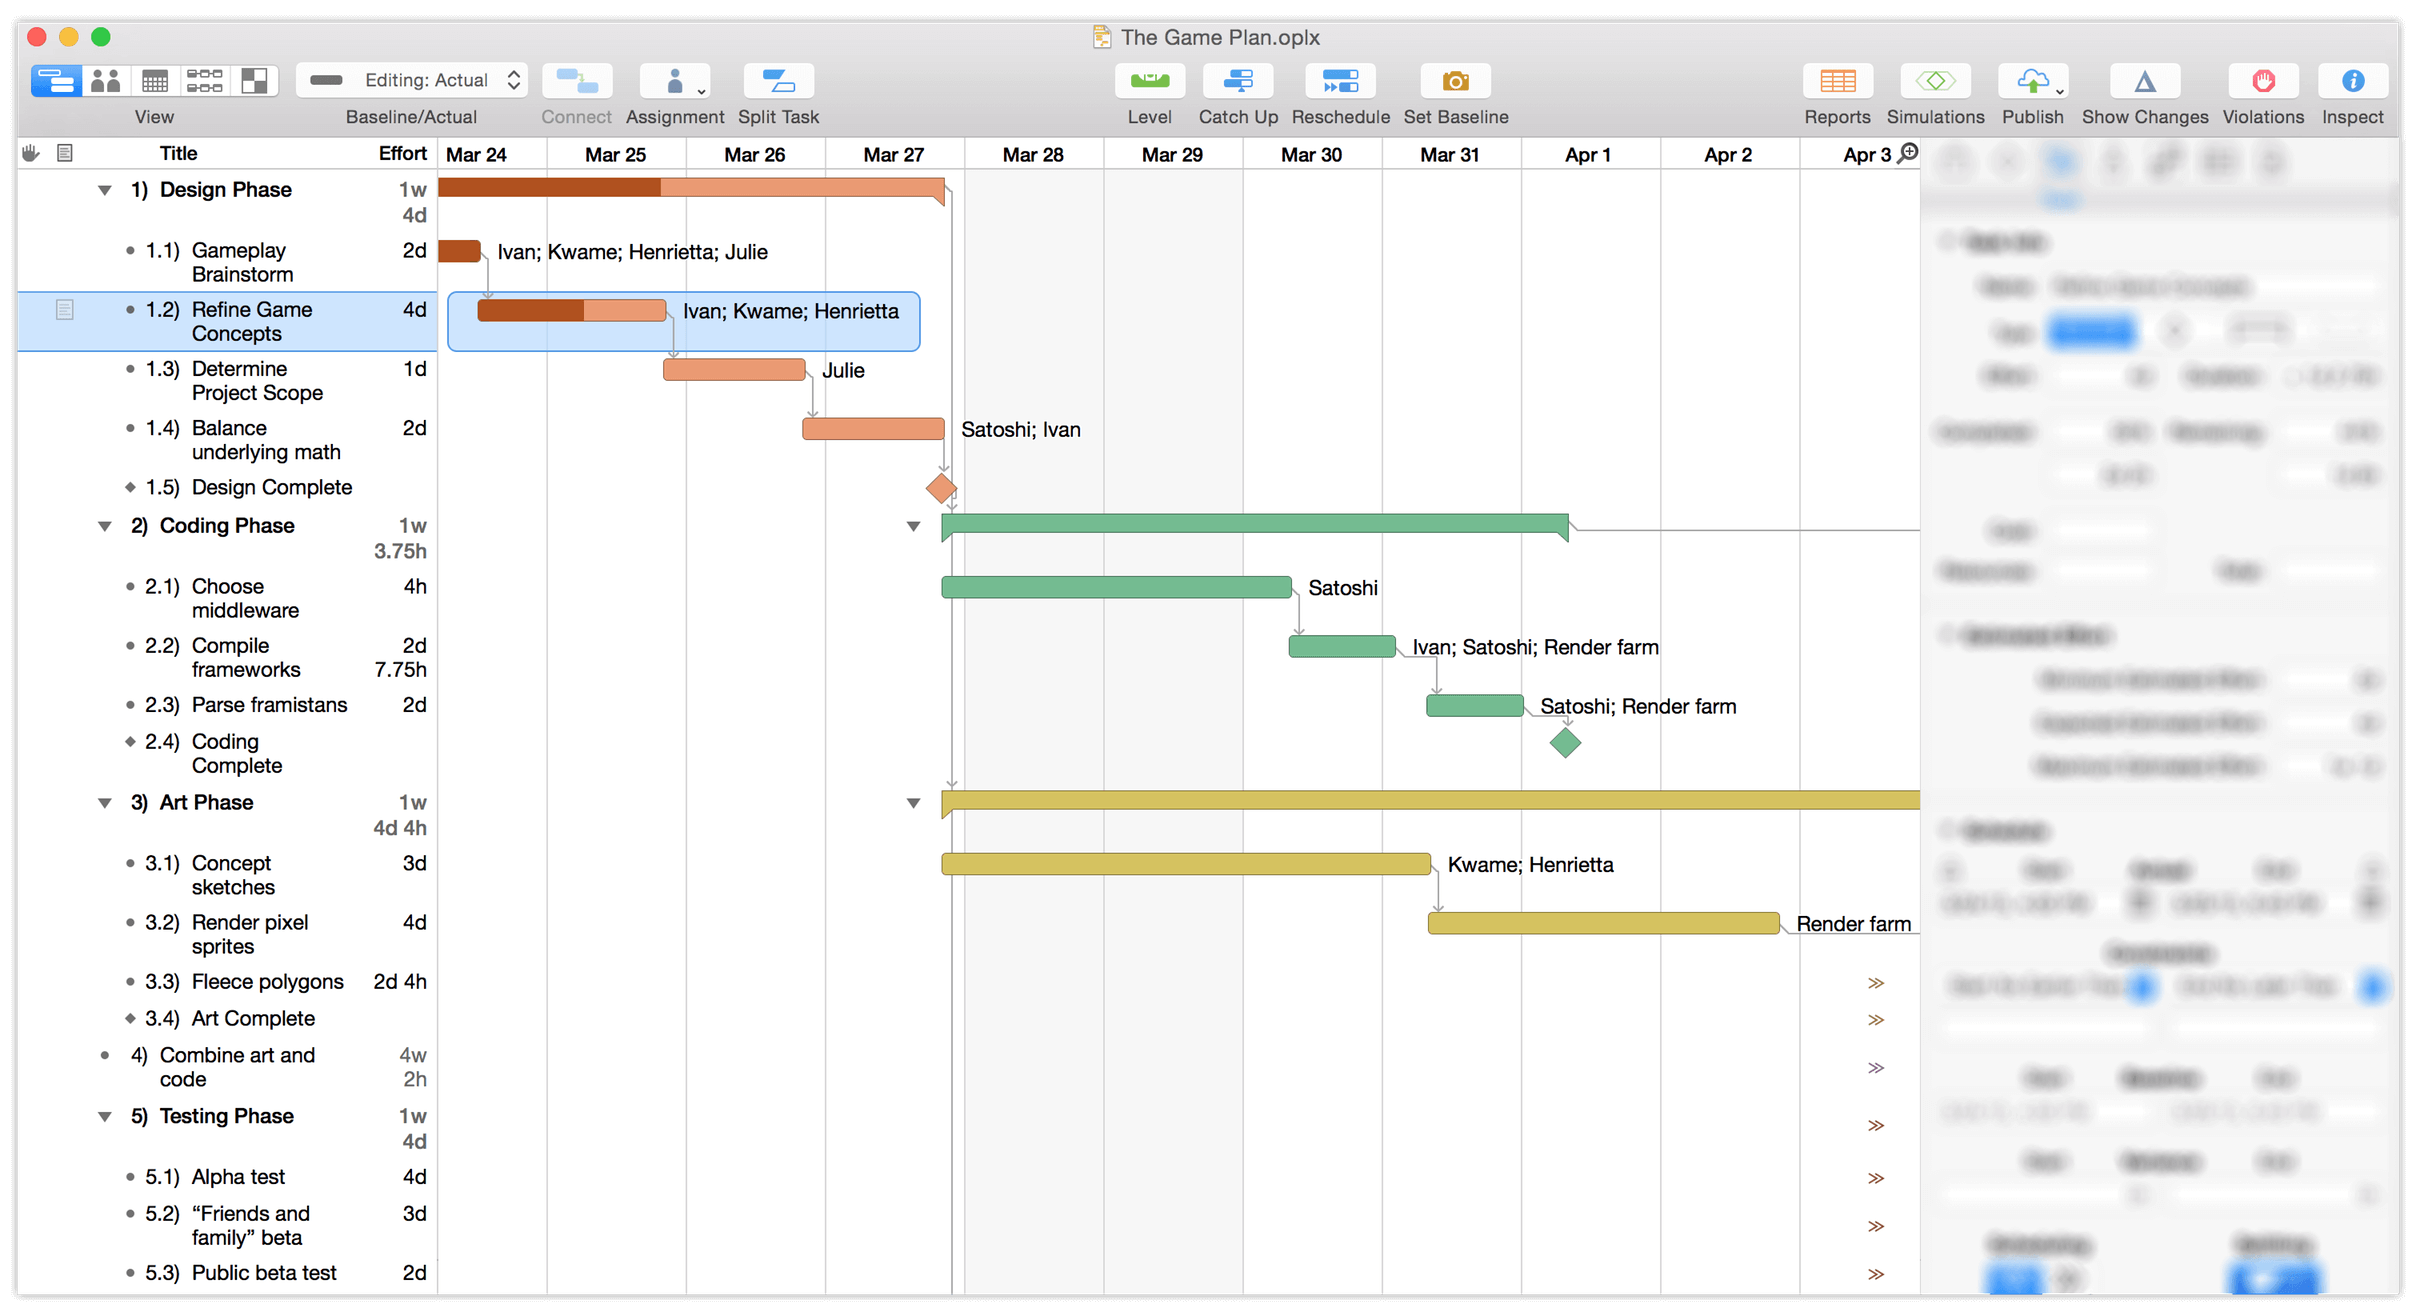
Task View consists of two parts: the task outline on the left, and the Gantt chart on the right. You’ll use the task outline to quickly create, edit, and group related tasks, while the Gantt chart is a powerful visual representation of tasks’ durations and relationships.
Resource View
Click the second button in the view control to see the Resource View.
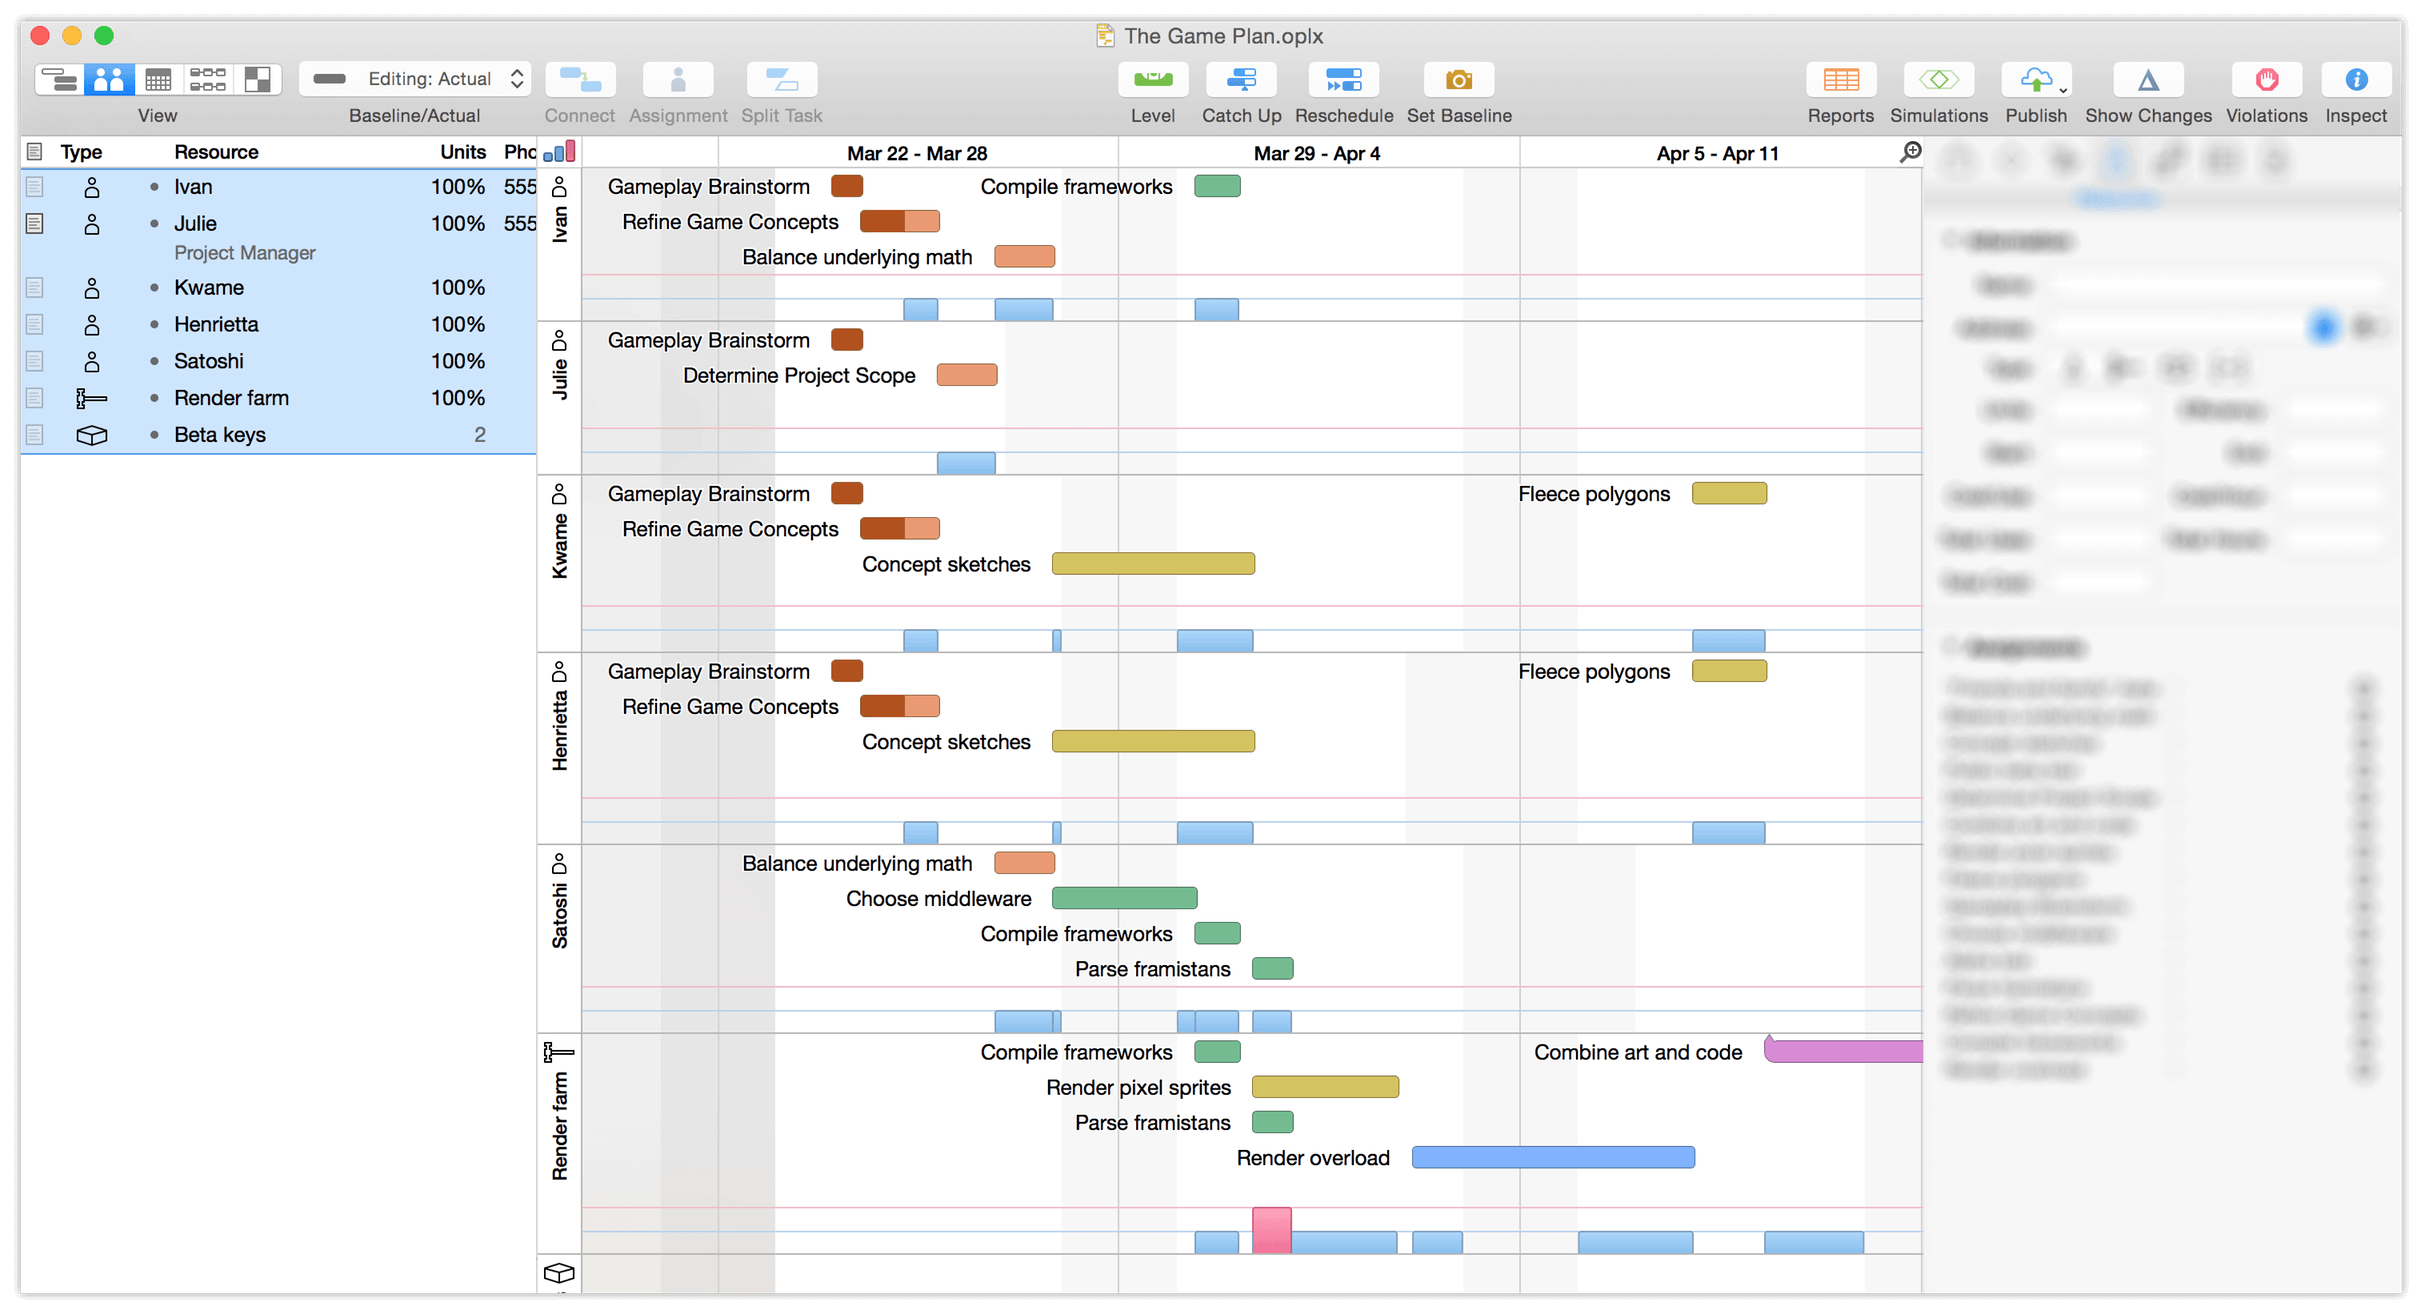
Use Resource View to add and manage staff, equipment, and materials. As with Task View, Resource View is split into two parts: an outline for adding, grouping, and managing resources, and a timeline that shows shows the same tasks as Task View — divided here by resource assignment instead of chronology or dependency structure, with drag-and-drop control to quickly assign resources to tasks (and vice versa).
Calendar View
Click the third button in the view control to see the Calendar View.
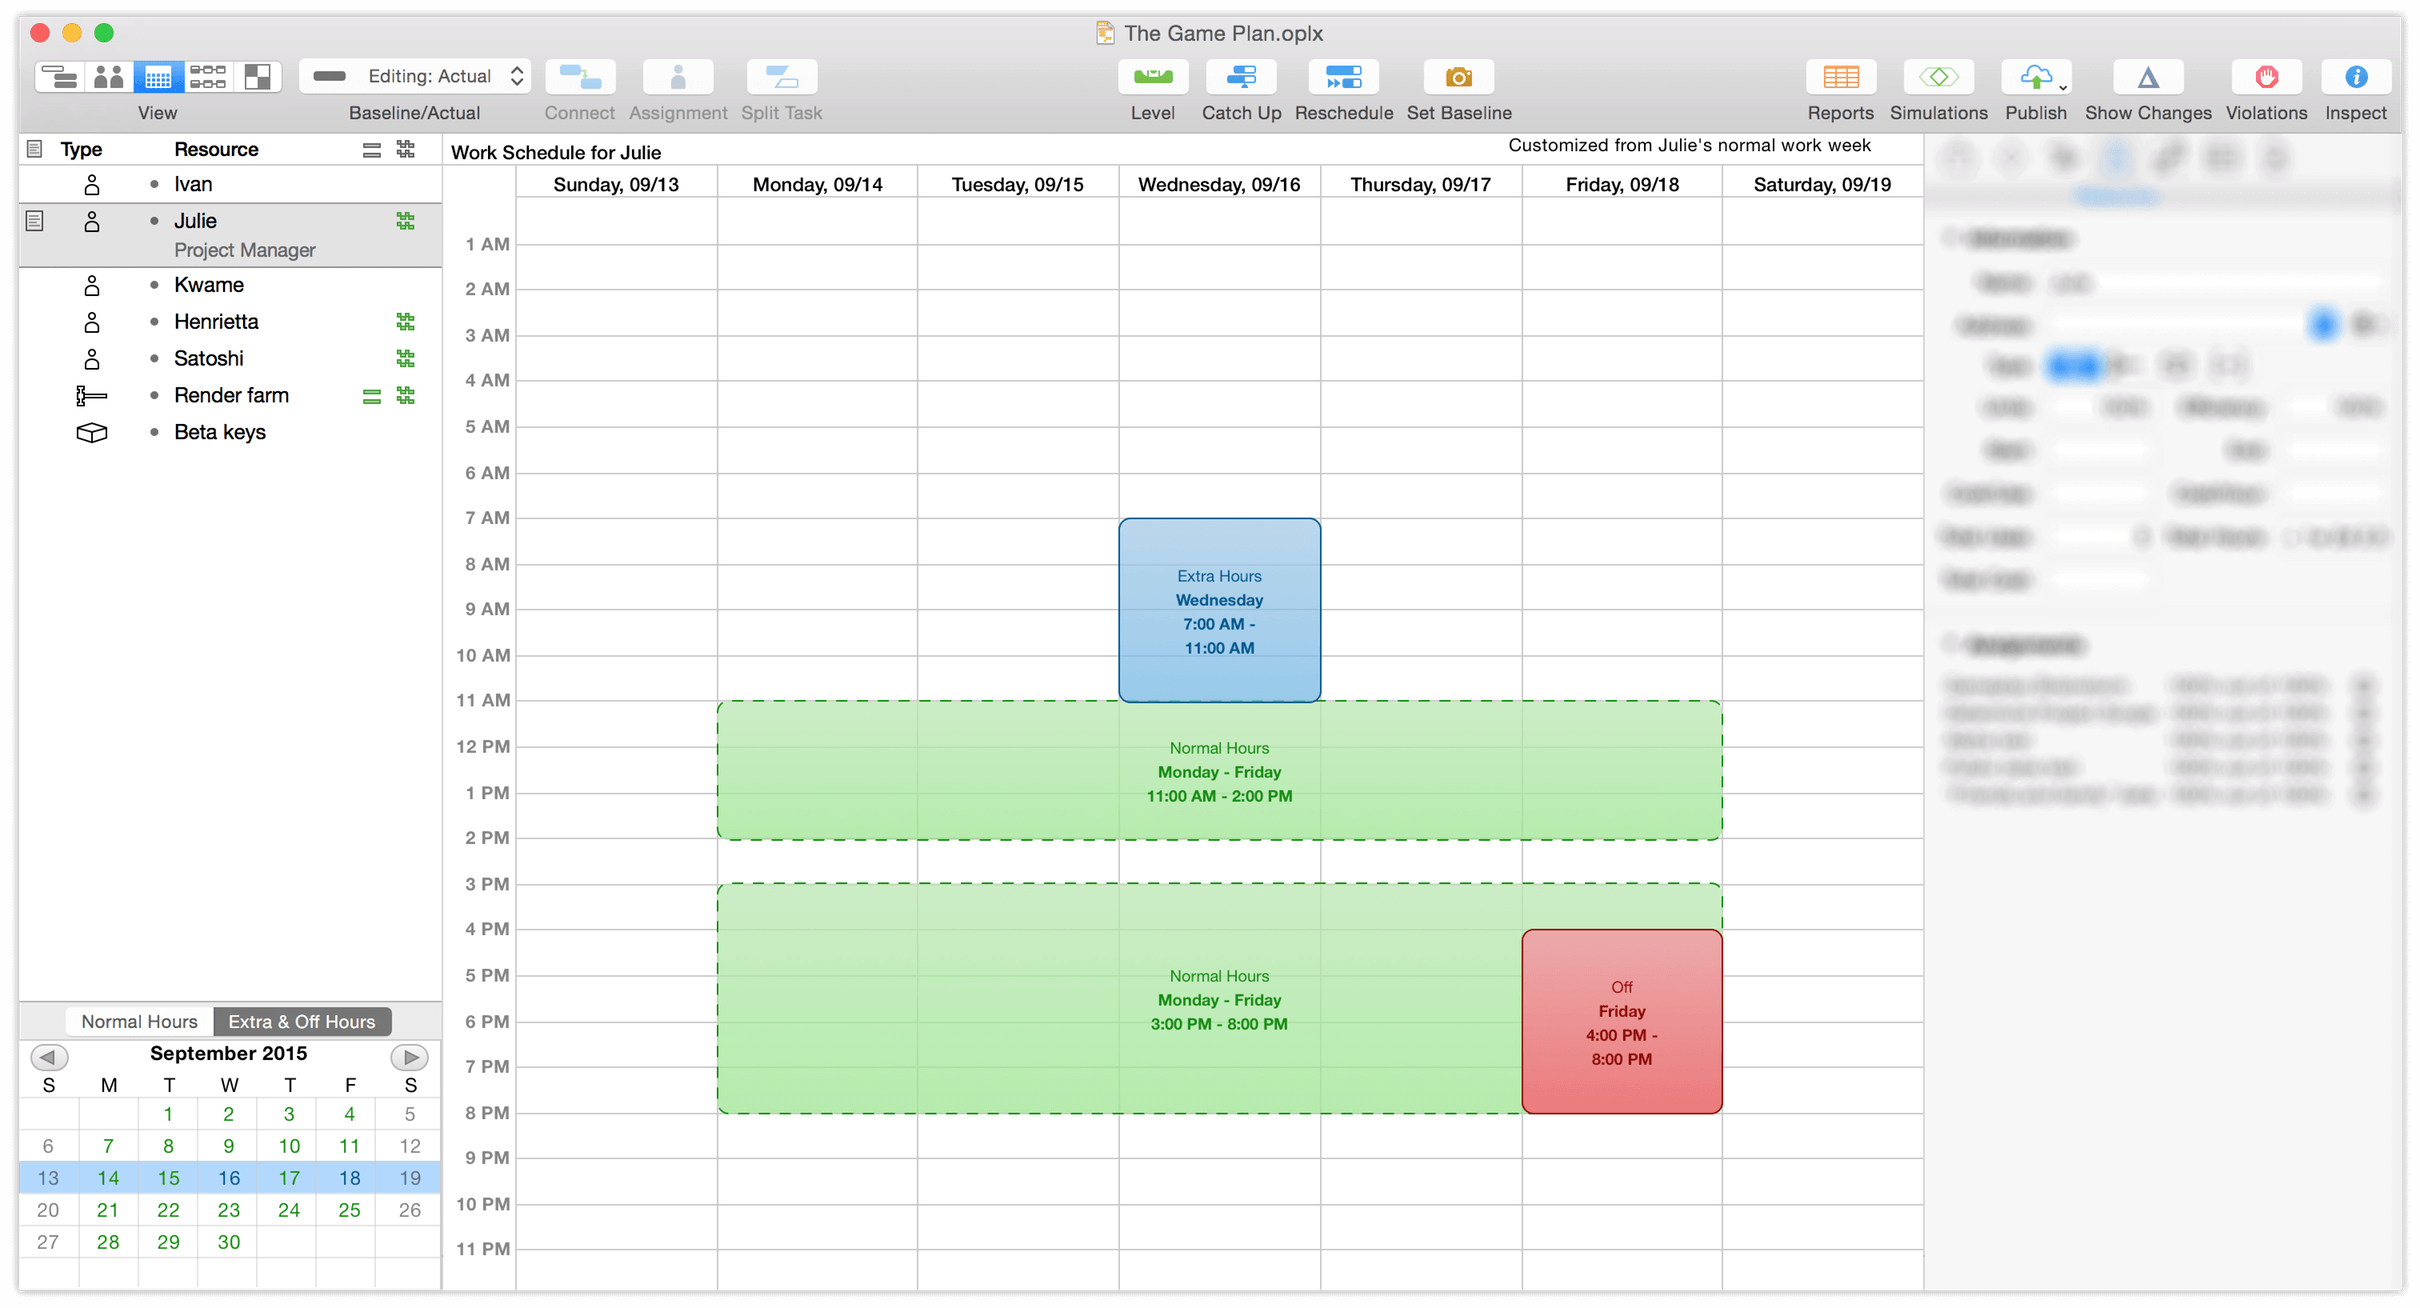
Calendar View also has two main areas: a list of project resources similar to the outline in Resource View, and a calendar for editing working hours. Calendar View is further broken down into two modes: editing for Normal Hours, and Extra & Off Hours.
In Normal Hours mode you’ll edit the working calendar for the whole project (when no resources are selected), as well as the regular working hours for individual staff members (by selecting them in the outline). Normal working hours are represented by green blocks in the calendar. Use the Extra & Off Hours mode to add isolated changes to the schedule that deviate from the norm, represented by blue (for extra time) and red (for time off) respectively.
Network View
Click the fourth button in the view control to see the Network View.
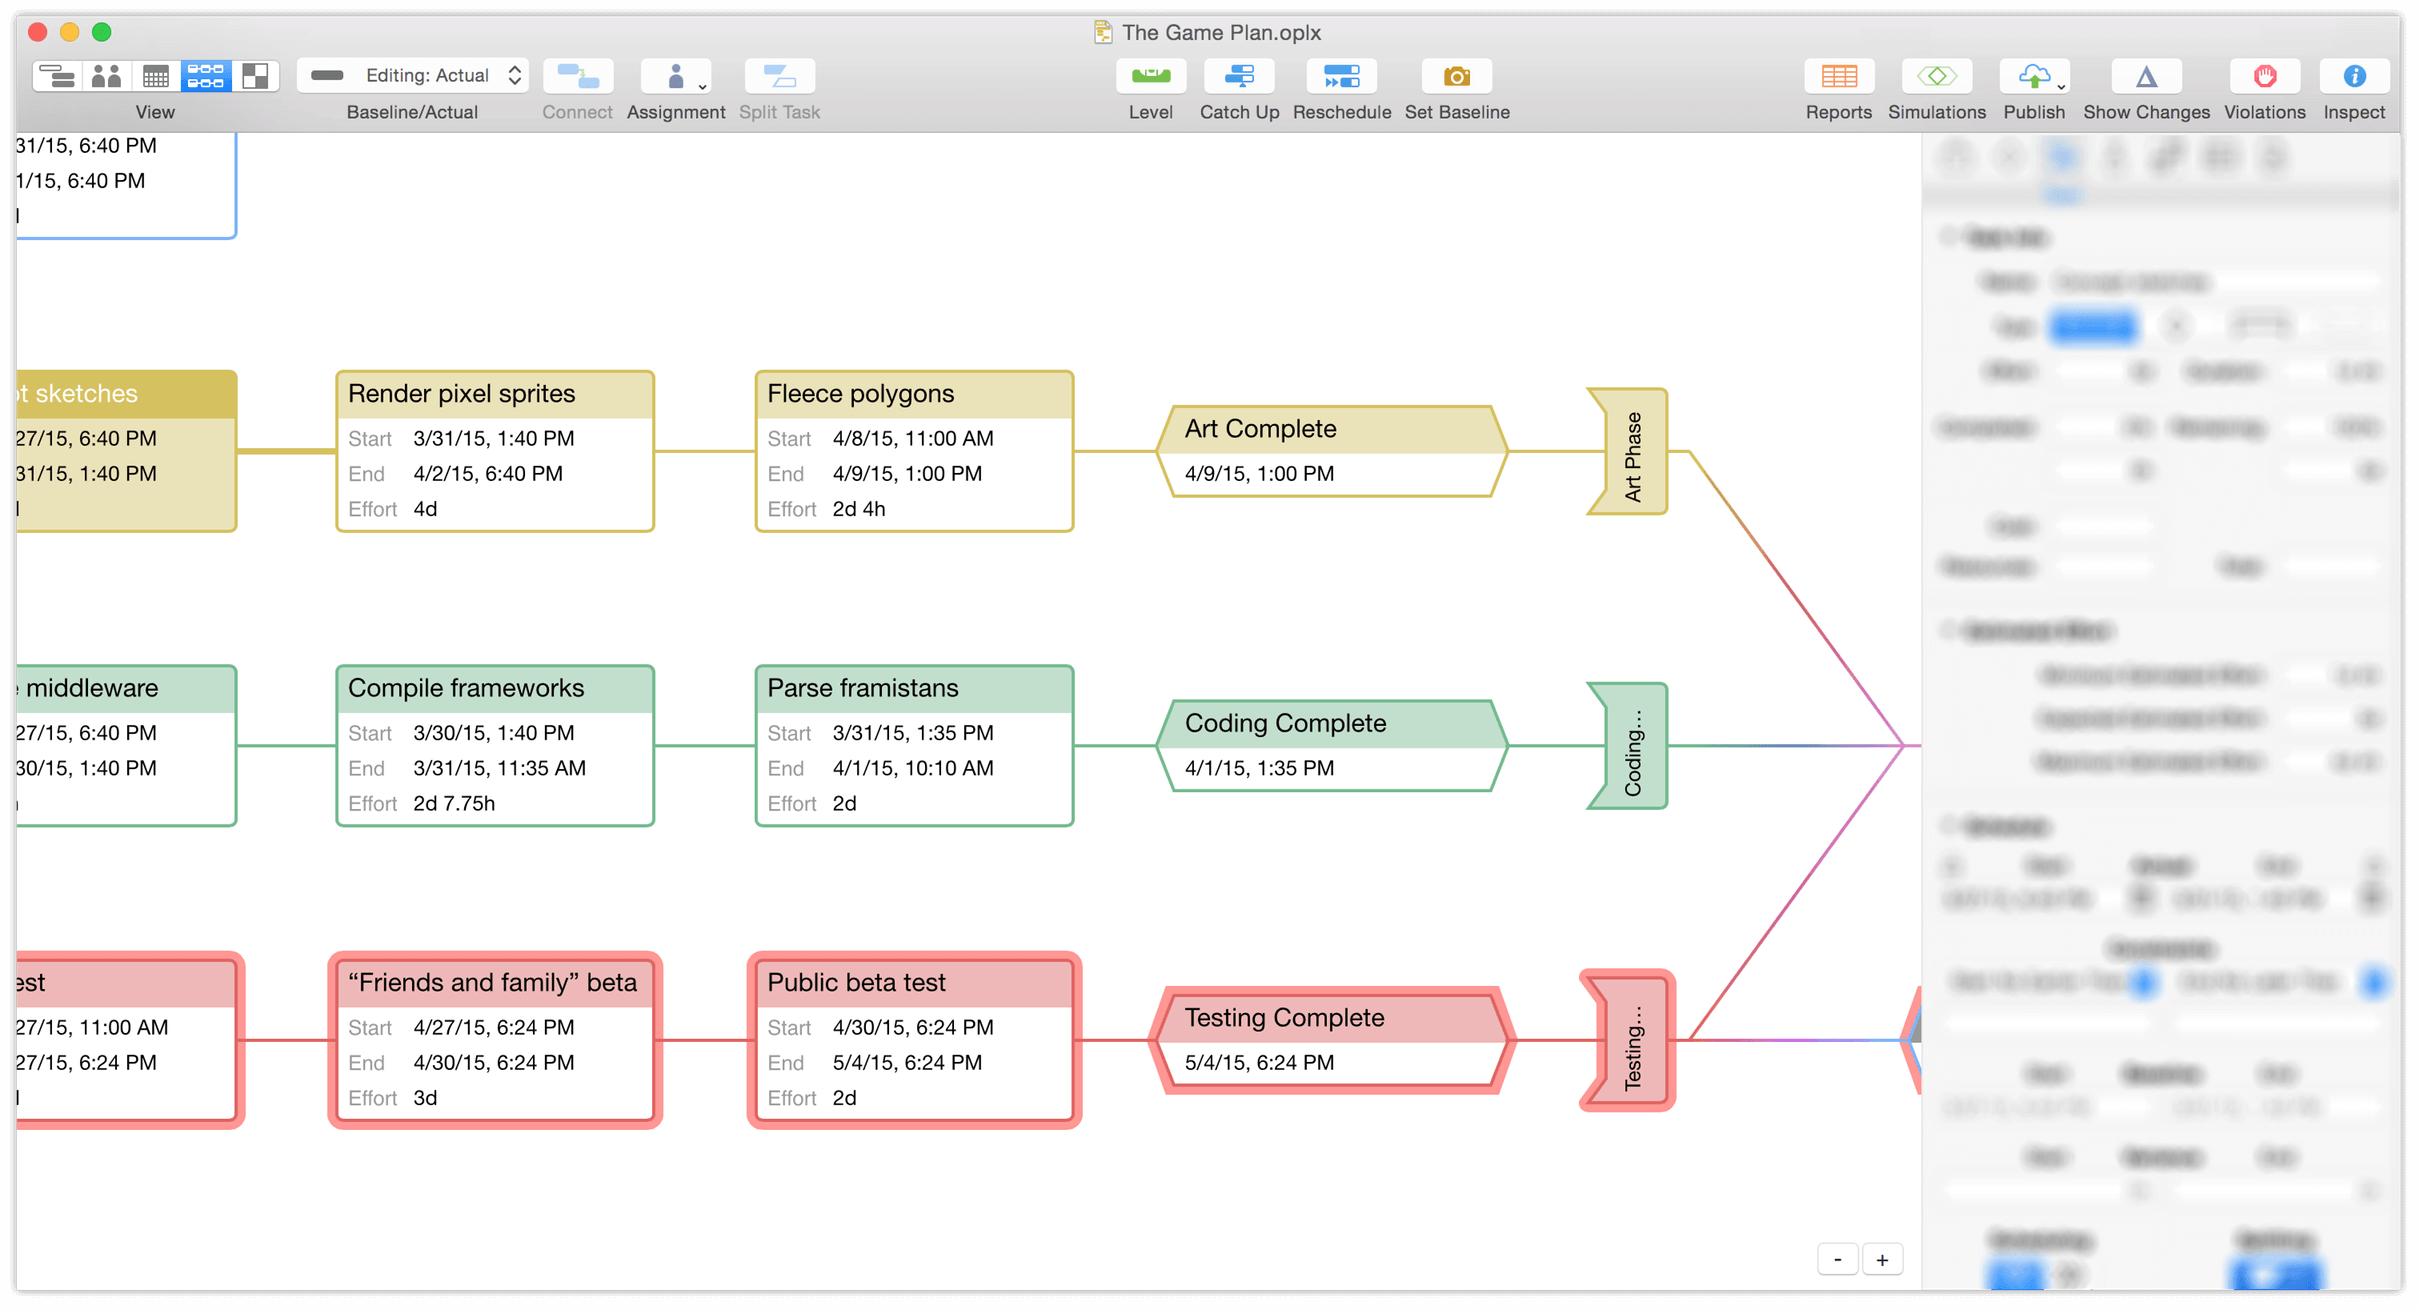
New in OmniPlan 3, Network View provides a canvas that displays your project as a diagram of nodes (tasks) with lines (dependencies) connecting them. Evocative of charts generated with the PERT technique, Network View not only offers a new perspective on your current projects but also allows rapid development of new ones. Press Enter with a task selected and a new one is created that’s dependent on the first; drag a line between existing tasks and watch them rearrange to obey the new relationship you’ve created.
Styles View
Click the fifth button in the view control to see the Styles View.
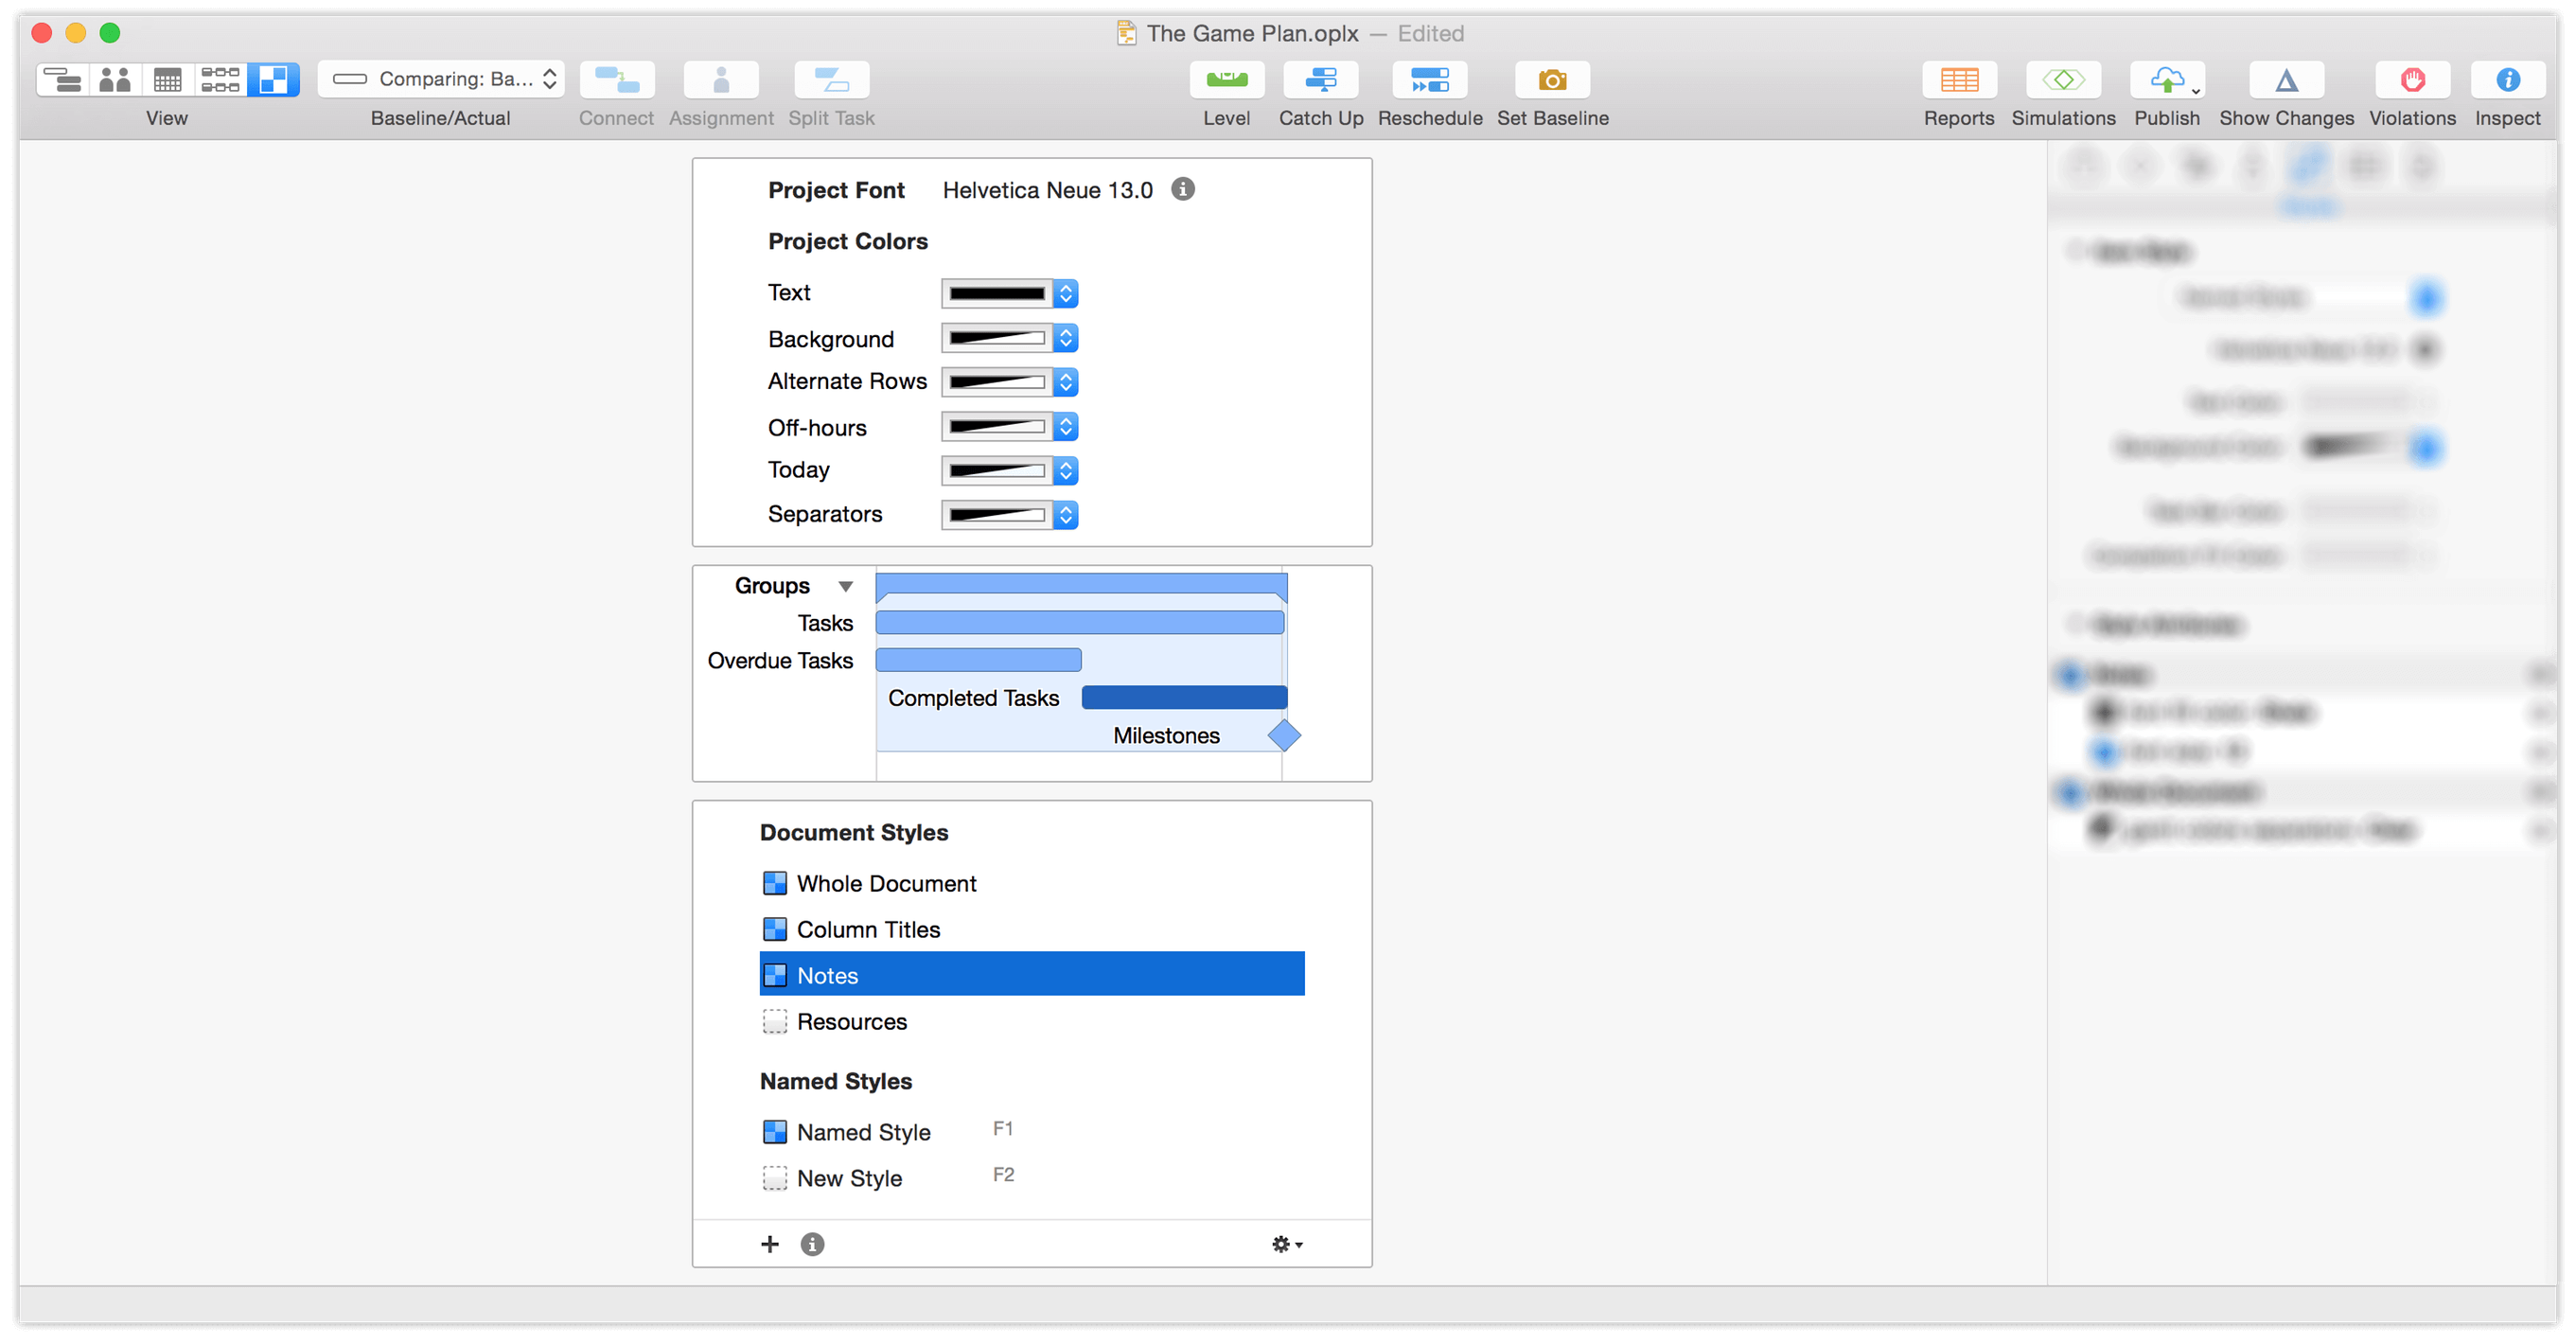
Styles View is new in OmniPlan 3, but will look familiar to users of earlier versions — this is the new home of style controls that govern your entire project. Changing the default options here will update the look of elements throughout your document, from the font and colors to the appearance of bars in the Gantt chart. You’ll create and manage custom Named Styles for ad-hoc styling of individual items here, too.
Inspectors
Check the right side of the OmniPlan window for the Inspectors sidebar. If it’s hidden, choose Inspectors ▸ Show/Hide Inspectors (Shift-Command-I) or click and drag in from the right side of the window to reveal it.
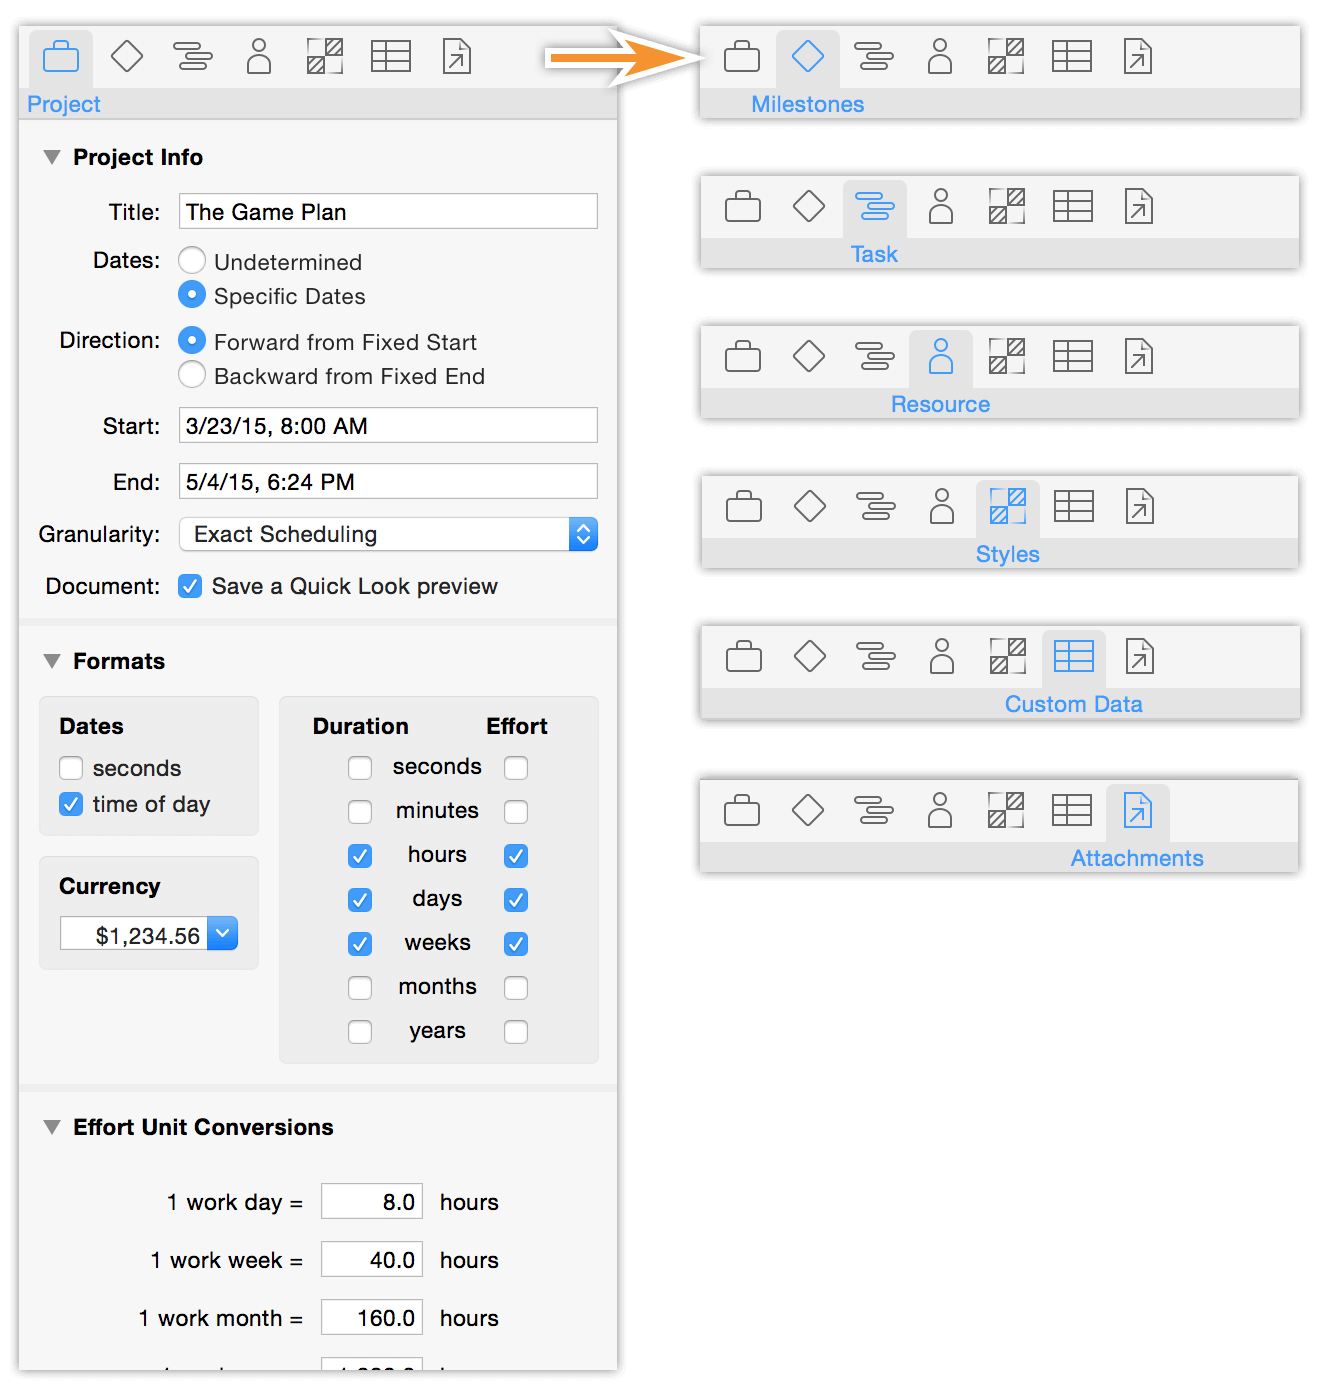
The inspectors are panes with information and controls related to what’s selected in the main window. Whether a given inspector will be relevant to your current selection depends on what it is; at any time you can browse all seven of the inspector groups (Project Info, Milestones, Tasks, Resources, Styles, Custom Data, and Attachments) to see what can be modified.
The Touch Bar
If your Mac supports it, OmniPlan uses the Touch Bar to bring the most useful tools and controls to your fingertips.
In the Task and Resource Views when no task is selected, the Touch Bar displays an overview of the Gantt chart or resource timeline (the same offered with View ▸ Show Overview), along with controls to Level, Catch Up, or Reschedule tasks based on the current project status.

With a task selected, the Touch Bar adapts to offer contextual control for reviewing and assigning resources to the task.

The task’s duration is denoted by the white tick marks centered beneath the resource. A green bar between the tick marks indicates that the resource is assigned to the selected task, while a blue bar indicates that the resource is assigned to another task at that time. A blue bar to the right or left of the tick marks indicates that the resource is assigned to an adjacent task, and a red bar indicates that the resource is overloaded.
While in this view, tap the resource in the Touch Bar to assign it to (or unassign it from) the selected task.
Similarly to the Toolbar, a wide range of OmniPlan-specific buttons can be displayed in the Touch Bar. Configure them to suit your needs by choosing View ▸ Customize Touch Bar.
The Report Window (PRO)
While not a persistent part of the main OmniPlan window, the Reports interface in OmniPlan Pro is important enough to mention here. Choose File ▸ Report (Option-Command-R) to bring it up.
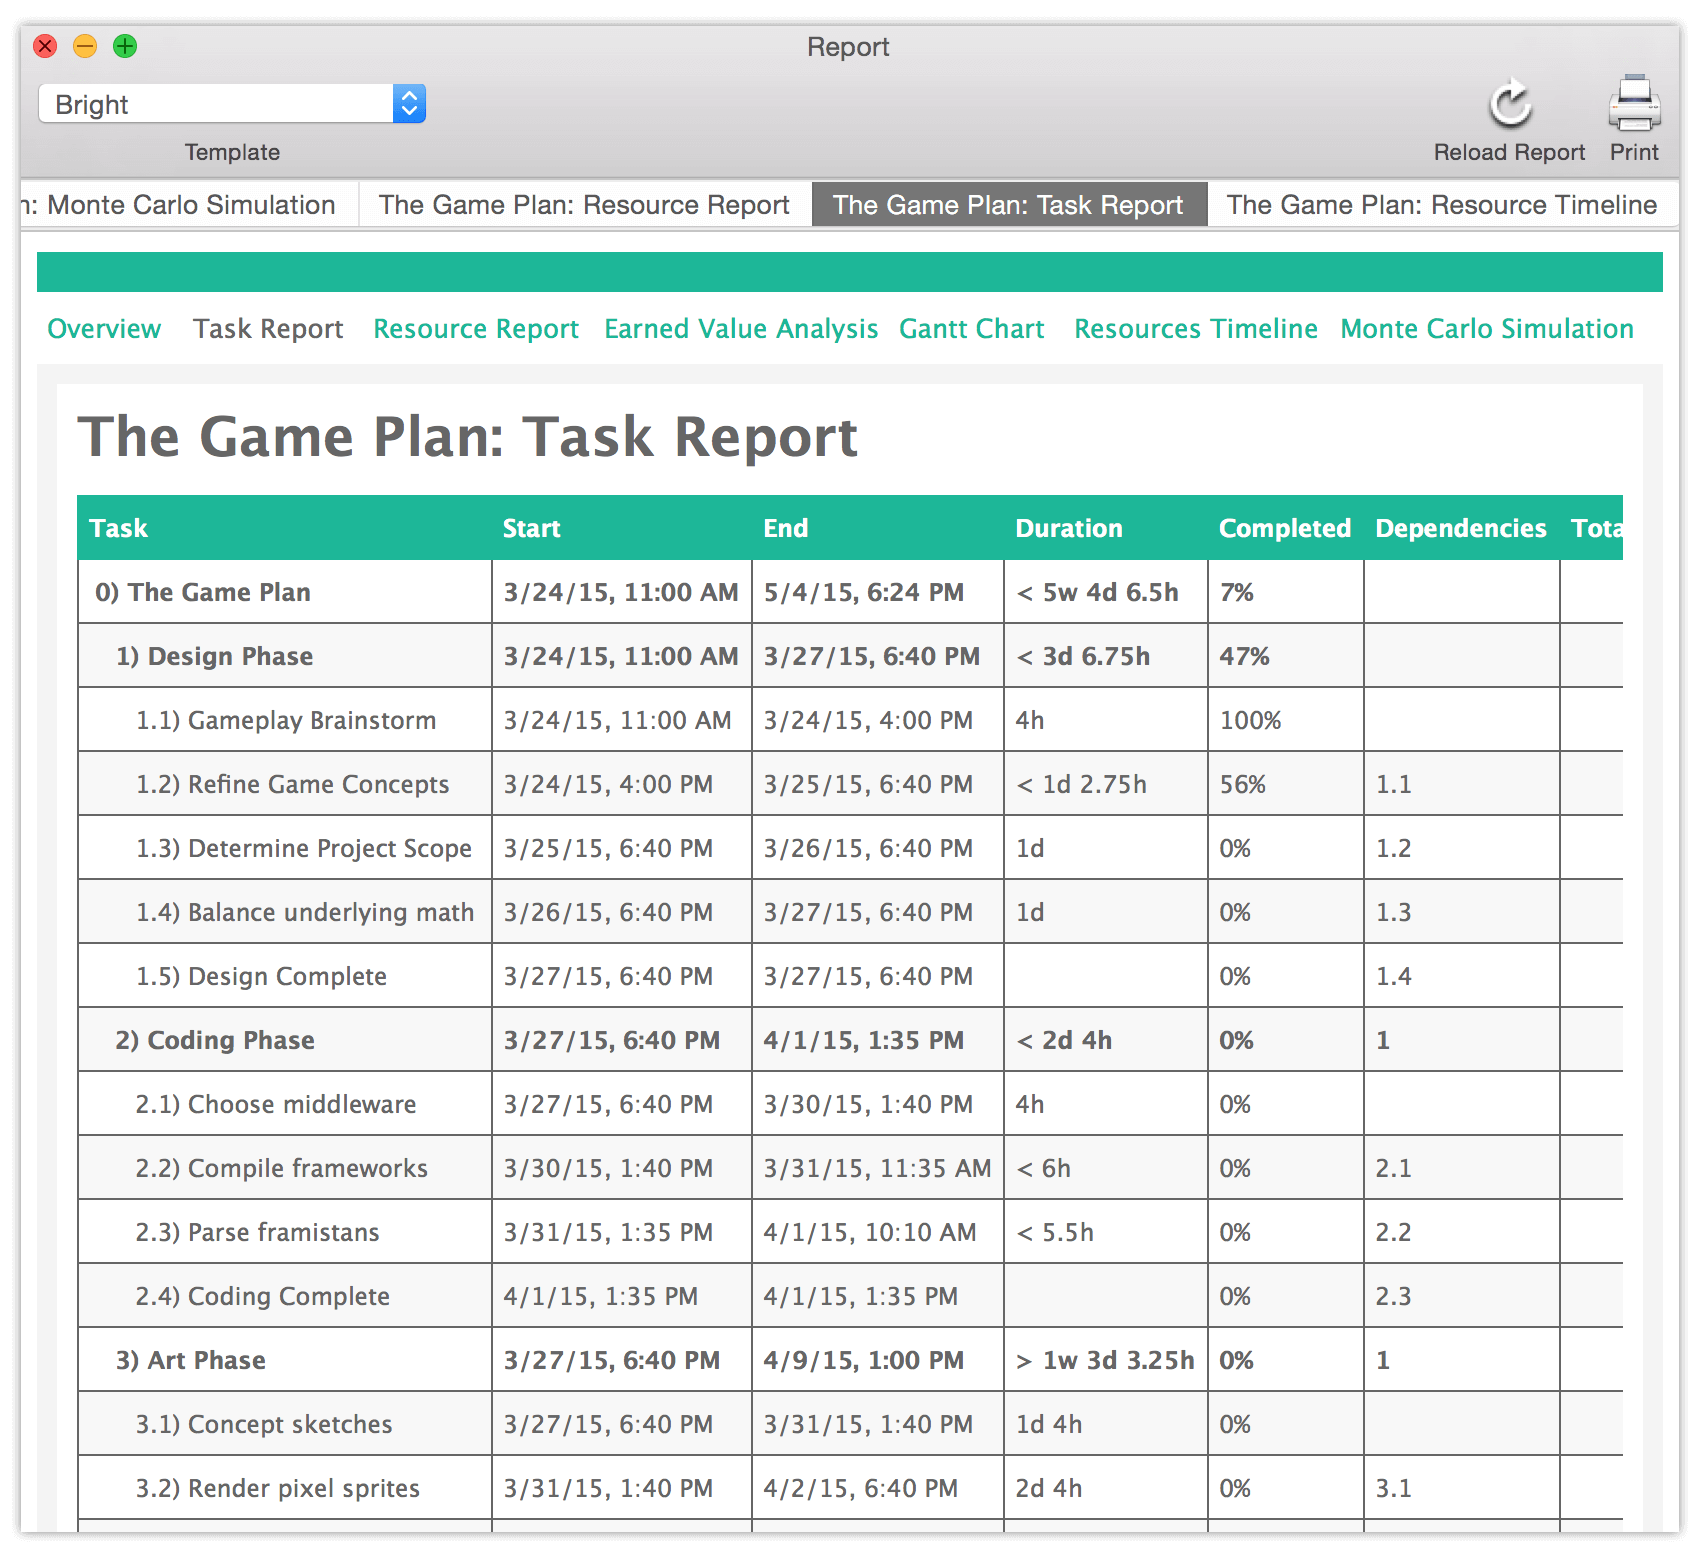
Once you have a project up and running, this is where you’ll go to visualize and summarize its progress. The tabs across the top of the window provide an array of options for presenting data on your project’s status, from an overview of the entire project to focused reports on tasks and resources, and with OmniPlan Pro, EVA budget estimations and simulated projections for milestone completion.
Even better, you can print the chosen report with a great looking preset or custom-styled HTML template straight from this window.
Dashboards (PRO)
Multi-Project Dashboards are a feature that comes with the Pro upgrade to OmniPlan 3, and provide a new way to view an array of projects simultaneously. To create a new one, choose File ▸ New Dashboard (Shift-Command-N) and then drag OmniPlan project files onto it.
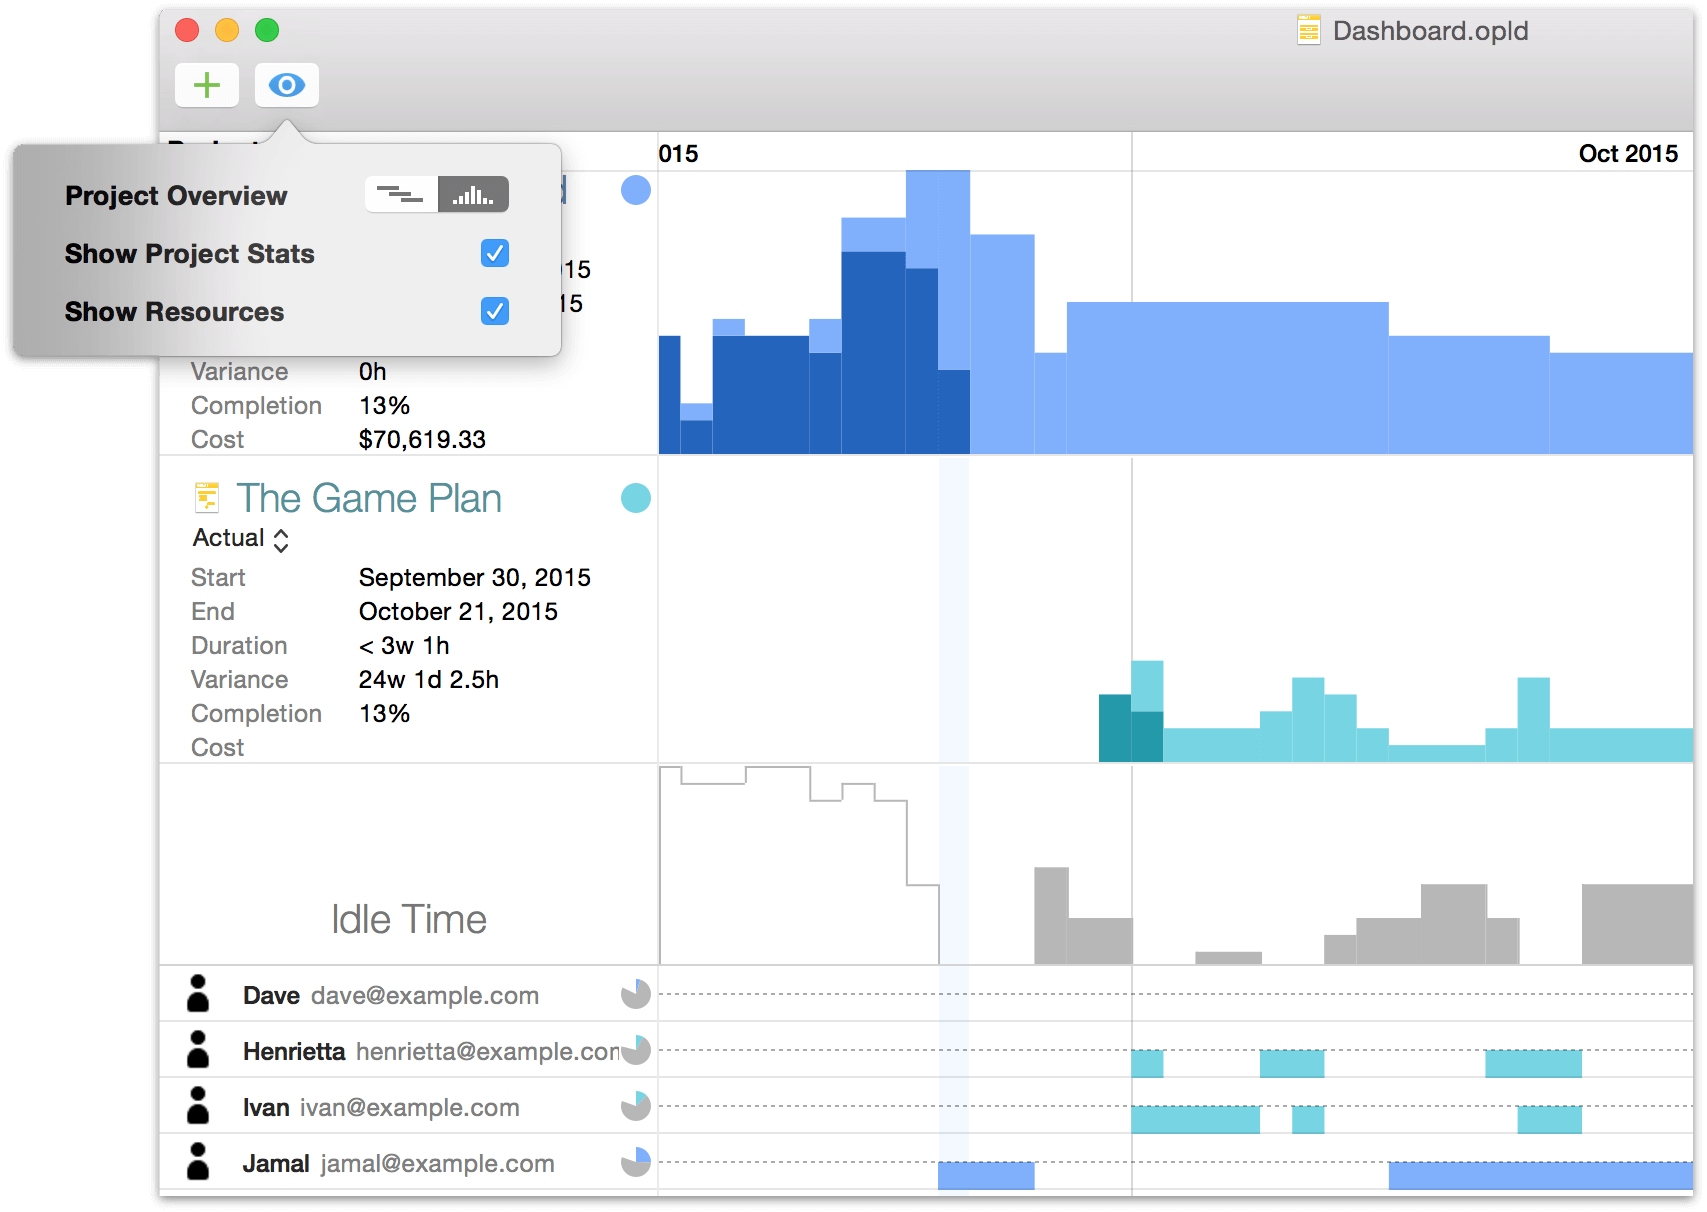
You can save that dashboard for future reference in its own .opld file format, and create as many other unique combinations of projects as you want with additional dashboard files. Any updates you make to a project that is shared in a dashboard are immediately reflected there, but projects themselves can’t be directly edited from the dashboard interface.