Gantt View
Enter Gantt View by clicking the second button in the view switcher in the toolbar, or choosing View > Gantt View (Option-Command-2).


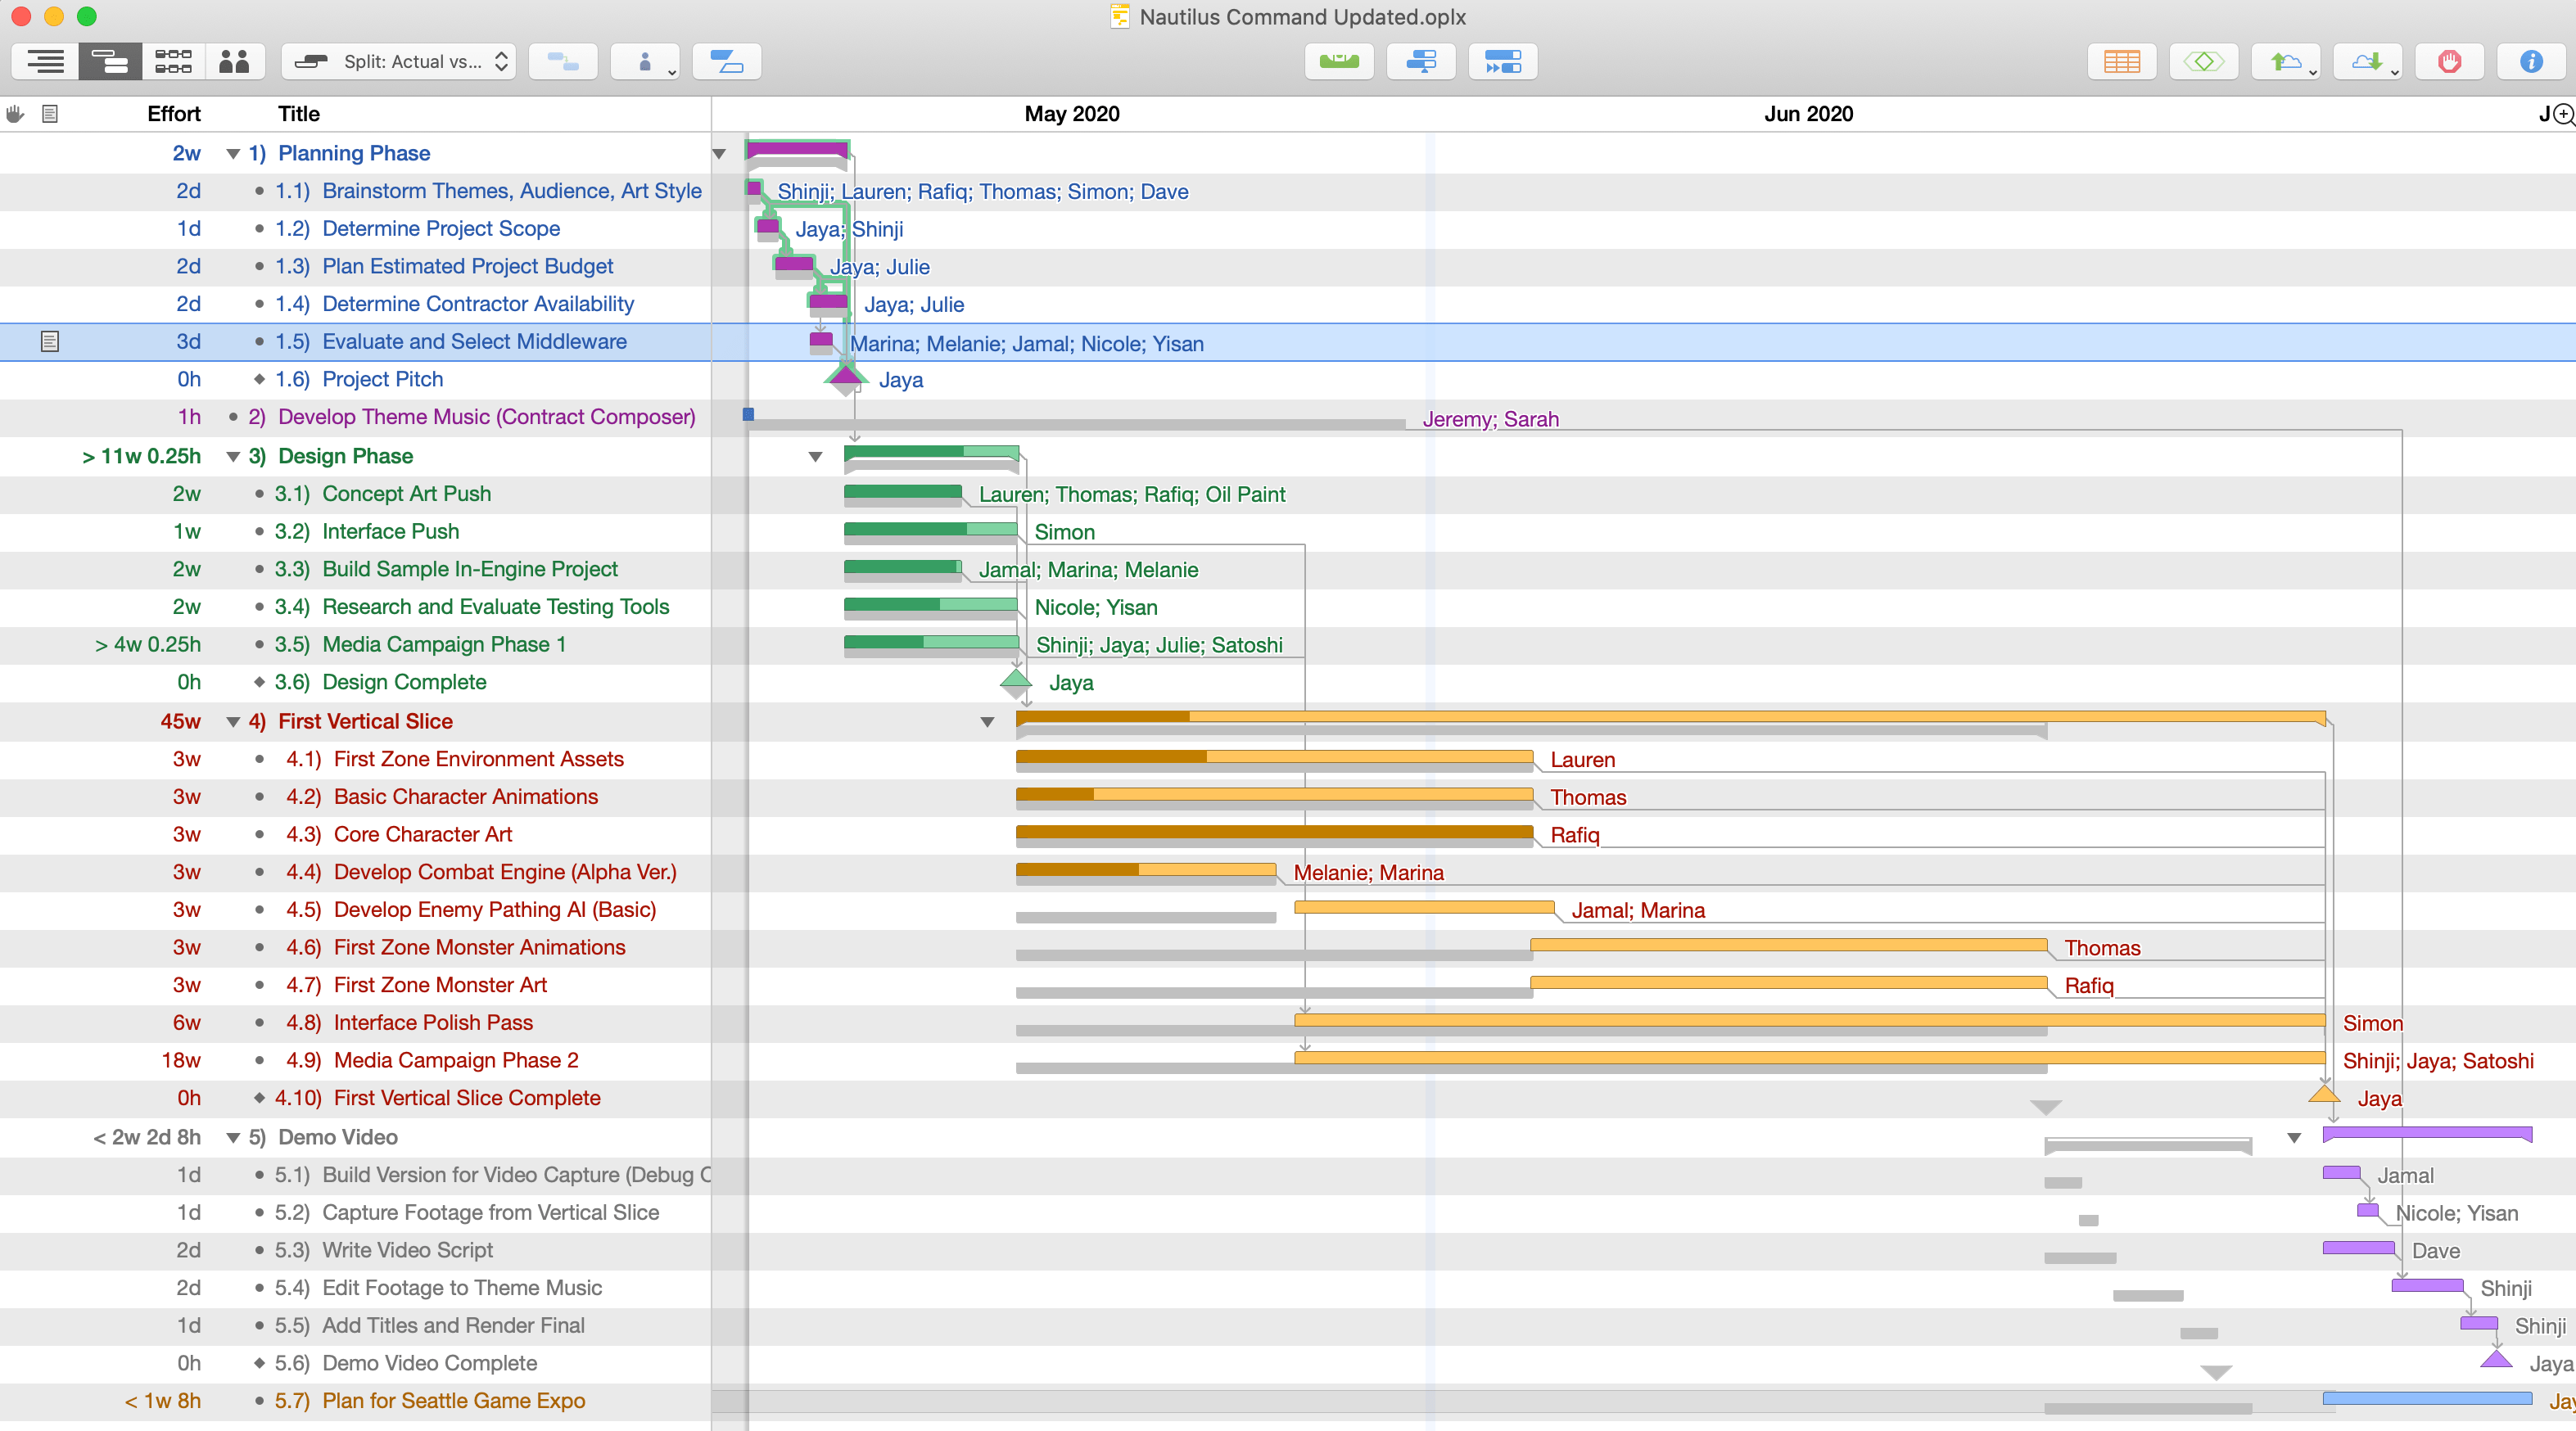
Gantt View consists of two parts: a task outline on the left, and the Gantt chart on the right. The outline provides a space to quickly create, edit, and group related tasks, while the Gantt chart is a visual representation of the project, with built-in tools for editing tasks and the relationships between them.
The Gantt View Outline
The outline on the left side of the Gantt View works the same as that in Project Outline View; both outlines display the list of tasks that the project contains, both add tasks in the same way, and both can be customized with your choice of columns independently from one another.
Gantt View Outline Columns
The columns available for display in the Gantt View’s task outline are the same as those available in Project Outline View. See Project Outline Columns for a complete list.
Building Project Structure
Organizing tasks with the tools provided in the Gantt chart, the Task inspector, and menu commands is a fast and effective way of adding shape to your project. By selecting tasks—represented by bars in the chart—and moving them around, or choosing from an array of transformative commands related to task and project structure, you can accurately model the work at hand.
Grouping Tasks
When initially creating a project, tasks can be organized in a flat list with each task a peer of every other. However, it can be useful to group tasks into hierarchical arrangements to better represent their relationships.
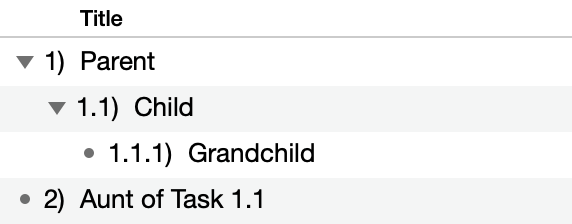
Tasks are represented in the Title column by a number that precedes each task. When View > Task Outline > Hierarchical Numbering is selected, tasks at the top of the hierarchy are represented by integers, while tasks at lower levels have points appended to them for each level of hierarchy below the top. The first child of Task 1 will be Task 1.1, the first child of Task 1.1 will be Task 1.1.1, and so on.
To represent task numbering as a flat list of integers without taking hierarchy into account, choose View > Task Outline > Flat Numbering instead.
When a task gains its first child task it is converted to a group task, and takes properties unique to to the Group task type.
There are a few ways to approach grouping, depending on whether you are starting with an existing set of items you want to add to a group, converting an existing item to a group, or creating a brand new group task.
-
To convert a task to a group with new child tasks inside it:
- Select the item you want to grant sub-tasks.
- Choose Structure > Add > Add Child Task (Command-}).
- The selected item becomes a group with one child task.
- Add more tasks to the group by pressing Return.
-
To bring tasks into a group within a peer task above them in the outline:
- Select the items to be grouped.
- Choose Structure > Indent (Command-]) or Tab, depending on your preference.
- The items become children of the item above them in the outline.
-
To bring tasks into a newly created group:
- Select the items to be grouped.
- Choose Structure > Group (Command-Option-L).
- The selected items become children of a newly created group.
-
To create a new group with nothing inside it:
- Choose Structure > Add > Group.
- A new, empty group item is created.
- To add items inside the group, open it by clicking the disclosure triangle next to the group name (or its bar in the Gantt chart), and with the group selected, create new tasks as normal.
Characteristics of Group Tasks
A group task determines most of its characteristics from the tasks it contains, rather than having characteristics of its own. A group’s characteristics can be viewed (and in some cases defined) in the Task inspector.
- Name—A group task has its own name.
- Type—A group task can contain tasks, milestones, and other groups, but its own type is always group. (An empty group has no effort or duration and can serve as a placeholder.)
- Effort—The effort of a group is the sum of the effort of all tasks it contains.
- Duration—The duration of a group is the amount of time between the beginning of its first task and the end of its last task, not the sum of the durations of all its tasks. If a group contains three one-hour tasks all happening at the same time, the group has a duration of one hour, not three hours.
- Scheduling—A group can have start and end constraints, which can then affect the dates of tasks inside it. Group tasks cannot have manually scheduled start or end dates themselves.
- Dependencies—A group can have dependencies just like a regular task.
- Resource Assignments—If you assign a resource to a group task, the resource gets assigned to all tasks in the group. The group itself can’t have any resources assigned.
Connecting Tasks with Dependencies
When a task must be completed before another can begin, a dependency exists between them. Charting dependencies in your project is a key part of understanding the critical path of tasks that leads through to its successful completion, on time and within budget.
Using the Gantt chart in Gantt View, you can represent the relationships between tasks with dependency lines. A dependency line is drawn from the beginning or end of one task (or group, or milestone) to the beginning or end of another.
When you create a dependency, the dependent task automatically reschedules itself to respect the dependency. With further changes to the schedule and leveling, the tasks continue trying to follow the dependencies. If a dependency becomes impossible or you manually cause a task stop obeying its dependencies, a violation occurs, which can be resolved with the Violations window.
There are a few ways to connect tasks:
- Select two or more tasks in the outline view or the Gantt chart, then click the Connection toolbar button to create a Finish to Start dependency between each subsequent task.
- Select two or more tasks in the task outline or the Gantt chart, then click the triangle in the corner of the Connection button—or click and hold the Connection button—to summon a menu of dependency types; choose the type you want.
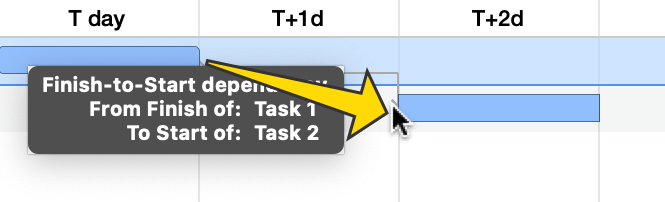
- Put the mouse pointer over a task bar in the Gantt chart, then drag one of the arrows that appears at the beginning or end of the bar. It becomes a dependency line, which you can then drop onto the start or end of another task, group, or milestone. Whether you drag from the start or the end of the prerequisite task, and whether you drop onto the start or end of the dependent task, determines the type of dependency.
- In the Dependents or Prerequisites columns of a task, type a dependency or prerequisite code. These codes combine the IDs of the tasks involved and the type of dependency like so:
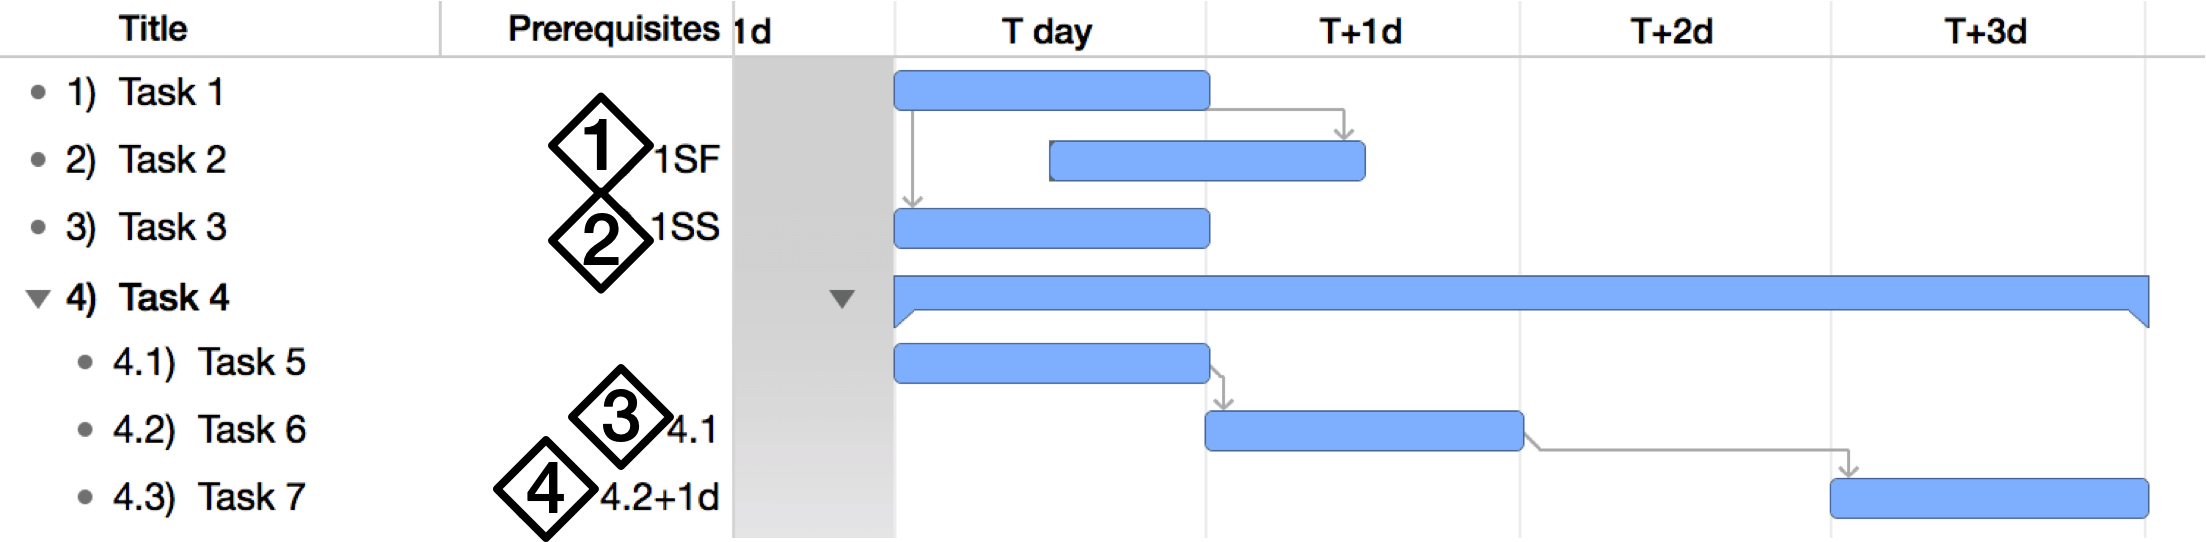
- A Start to Finish dependency from task ID 1
- A Start to Start dependency from task ID 1
- A Finish to Start dependency from task ID 4.1. (FS is the most common type of dependency, so a task ID by itself without any letters is assumed to be FS.)
- A Finish to Start dependency from task ID 4.2, with a lead time of 1 day.
Recurring Tasks
A recurring task is a task designated to repeat multiple times. This can be useful for planning weekly meetings, restocking inventory, or accounting for quarterly milestones of a project’s progress.
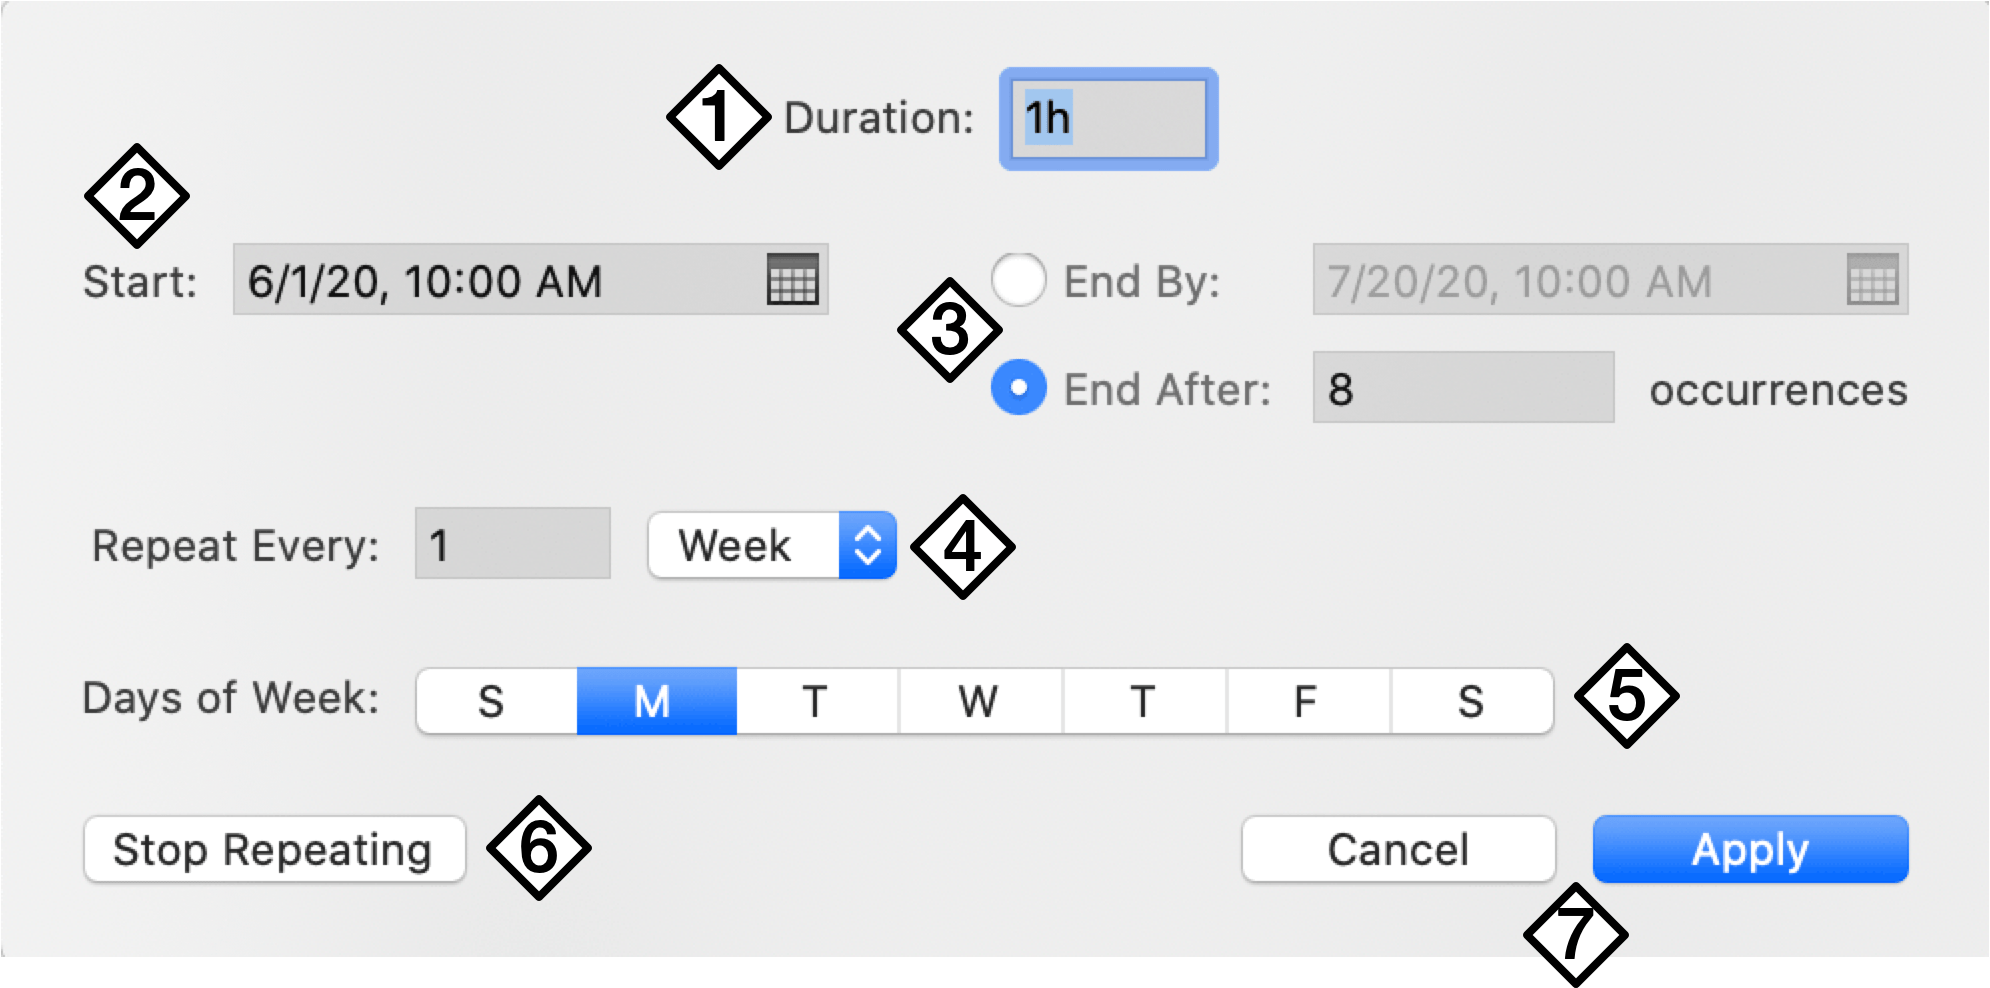
To set a task or milestone as recurring, select it and open the Task inspector. In the Task Info section, open the Type pop-up menu and and choose Make This Task Recur. The task recurrence dialog appears for setting up the properties of the recurring task.
-
Duration—Set a duration for the recurring task.
-
Start—Set a start time for the task. If the first occurrence of the repeat interval would be later than the start time, the start time changes to the first occurrence automatically.
-
End—Choose whether to End By a specific time—scheduling enough occurrences to fill the interval between start and end—or to End After a set number of occurrences.
-
Repeat Interval—Use the popup menu to pick an interval in days, weeks, months, or years, and set a value for how many of the interval elapse between repeats.
-
Interval Details—Use these controls to refine the parameters of the chosen repeat interval. This section changes depending on whether day, week, month, or year is chosen.
-
Stop Repeating—Click to change the task from a recurring task to a regular task or milestone, canceling future occurrences. Only appears when editing an existing recurring task’s recurrence rules.
-
Cancel, Apply—Click to cancel any changes, or to apply them to the task.
After setting up a recurring task, you can subsequently use the Task Info inspector’s Type menu to Edit Recurrence Rules, which opens the dialog to change the recurrence properties of the task, and Stop Recurring, to cancel future planned occurrences of the task.
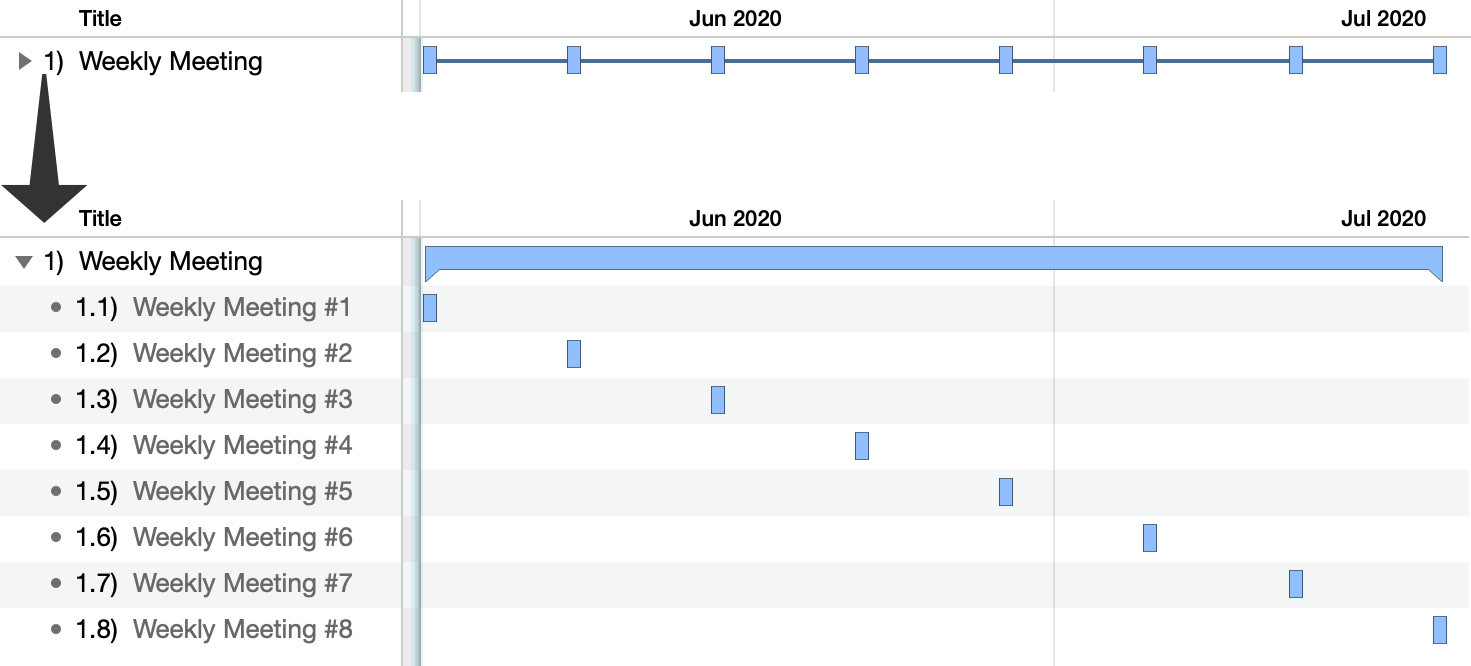
A recurring task is represented in the task outline and Gantt chart as a group task that contains each instance of the task that is scheduled to occur; this group is shown as rolled up when closed by default.
Splitting Tasks
Whether because a key collaborator is on vacation or another part of the project has taken priority, suspending work on a particular task can be very helpful. When you want a resource or team member to devote time to something other than the task they’re currently assigned to, splitting the task into parts around the “time out” period is an ideal solution.
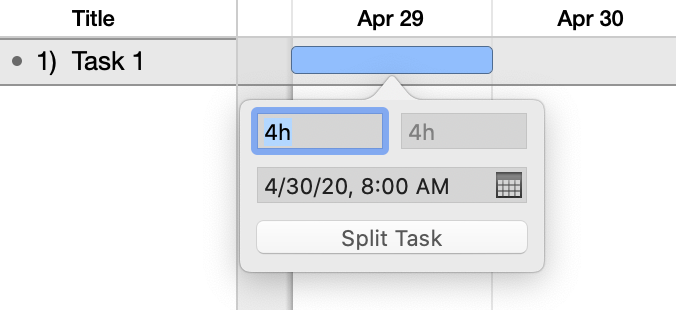
To split a task:
- Select the task in the outline.
- Choose Structure > Split Task (Option-Command-S).
- In the popover, adjust the duration of both sides of the split, choose the date and time you want the task to resume after the break, and click the Split Task button; the task is split for later completion.
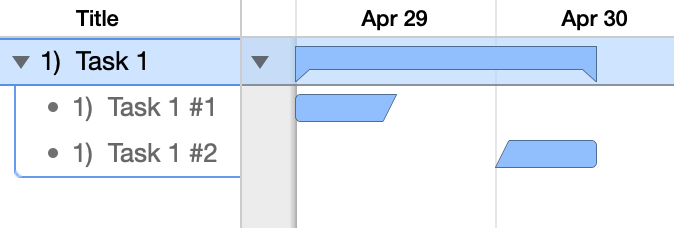
To rejoin a split task, click on one of its parts and drag it to the other. The two segments will merge back into a single task on the Gantt chart.
After splitting a task it’s always a good idea to level to be sure the split is the most efficient way to manage the task at hand given the project’s available resources and time constraints.
A split task may mysteriously re-merge after leveling. If this is not what you want, make sure that Allow Splitting is checked in the leveling dialog.
Creating Hammock Tasks
A hammock task is one in which the duration is dependent on both when the previous task ends, and the next task starts. This type of task is useful when facing a hard deadline and deciding what can be compressed if the project is running behind schedule, or if external factors influence when parts of the project must happen.
For example, if you were to prepare a written document, the time allotted for editing would vary depending on the completion of the document and its due date.
Using that scenario, let’s create an example hammock task. Our starting point is a set of two tasks and a milestone connected by Finish to Start dependencies: Write Newsletter, Edit Newsletter, and Publish Newsletter.
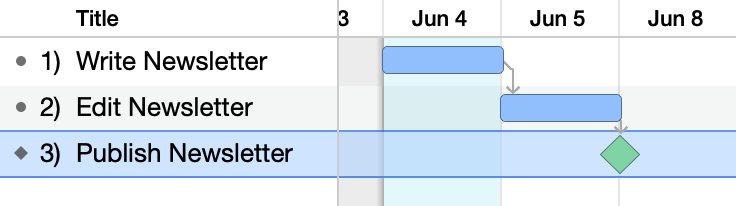
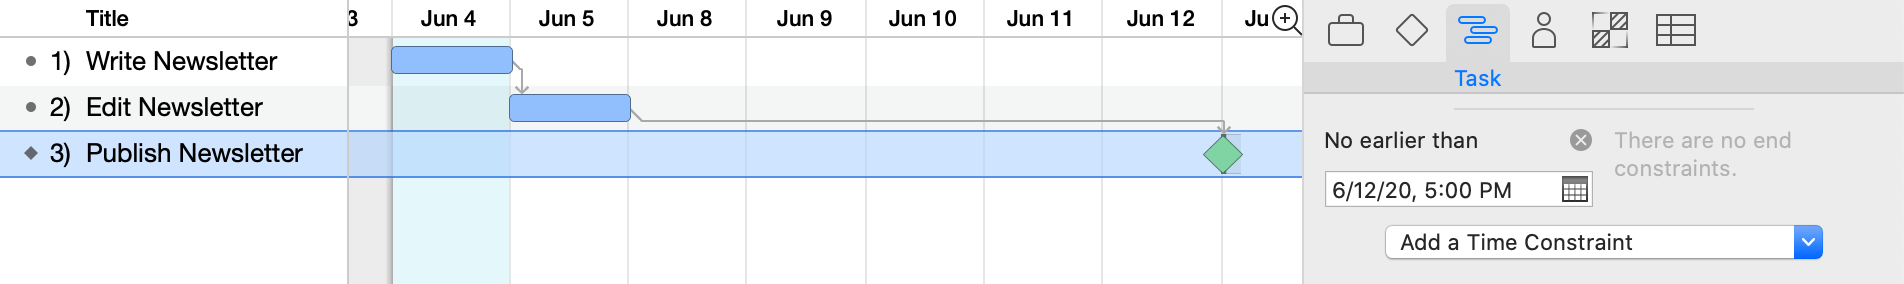
We want to publish the newsletter on June 12th, so we set the Start No Earlier Than date of the milestone to reflect that.
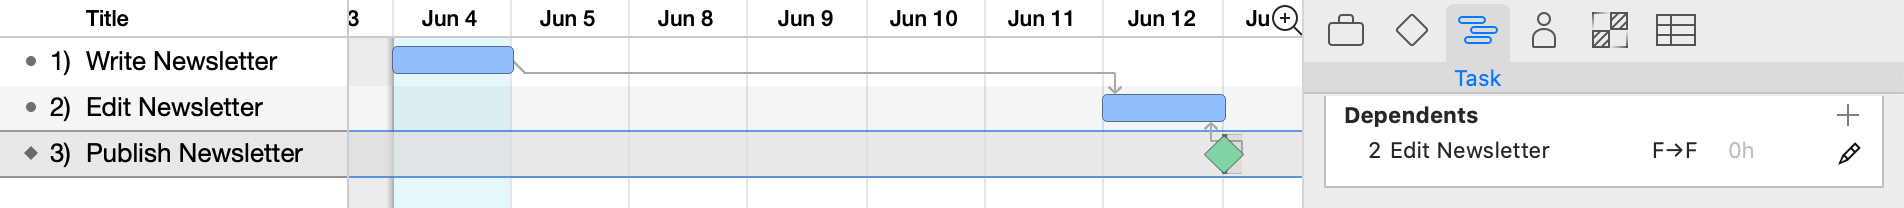
Next, we add a dependency to indicate that editing finishes when publishing starts. Because Publish Newsletter is a milestone rather than a task its start and end dates are equivalent, so this dependency is Finish to Finish (if publishing were a task, this would be a Start to Finish dependency instead).
Because this dependency is directional, for OmniPlan to understand the relationship you’ll want to select the milestone and drag a dependency arrow to the Edit task rather than choosing the dependency type from the Dependencies section of the Task inspector.
After creating this dependency, we delete the unneeded Finish > Start dependency from Edit to Publish to avoid creating a dependency loop.
With our dependencies set up properly, the final step in setting up our hammock task is to select it and choose Hammock as the task type from the Task inspector.
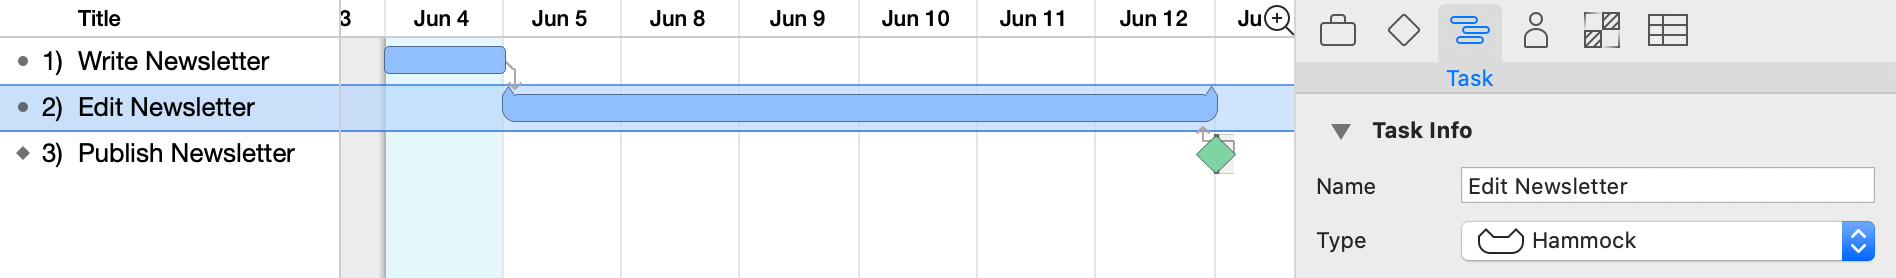
Now, if writing the newsletter takes longer than planned, the duration of the editing task will diminish to respect the needs of the tasks on either side.
Editing in the Gantt Chart
Manipulating items in the Gantt chart directly can be a useful way of maintaining a plan at any given point in its progress. The following sections describe tools for editing changes to the project as work progresses.
Drawing Dependency Lines
To draw dependency lines between one task and another:
- Select a task bar in the Gantt chart to see its dependency arrows.
- Drag a dependency arrow from the beginning or end of one task.
- Drop the arrow onto the beginning or end of another task to create a dependency.
Deleting Dependency Lines
To delete a dependency line between two tasks:
- Select the dependency line by clicking on it.
- Press Delete.
This removes the dependency relationship that the line represents, and the now-unrelated tasks move accordingly.
Drawing Constraints on Tasks
To draw constraints on tasks:
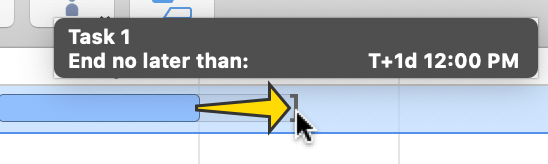
- Hold Shift and drag from the beginning or end of a task to create a start or end constraint.
- Hold Shift and double-click an existing constraint to remove it.
Manually Scheduling Tasks
To manually schedule tasks:
-
Select a task and drag it horizontally from its default position in the timeline.
-
The task is scheduled in its new position, with its scheduling type set to Manual.
Changing Task Duration
To change the duration of a task in the Gantt chart:
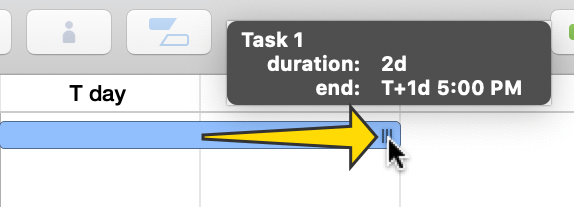
- Click the traction pad at the right end of a task bar.
- Drag the end of the bar left or right to change the task’s duration. You can hold Shift while dragging to snap to round values.
Adjusting Task Completion
To adjust how much of a task has been completed:
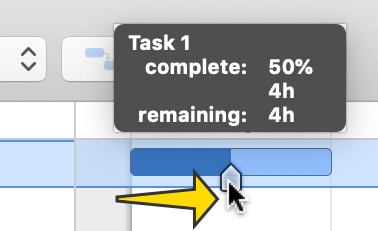
- Click the white, house-shaped handle on a task bar.
- Drag the handle to update the completion.
Updating Task Completion
If everything is going according to plan, click the Catch Up button in the toolbar.
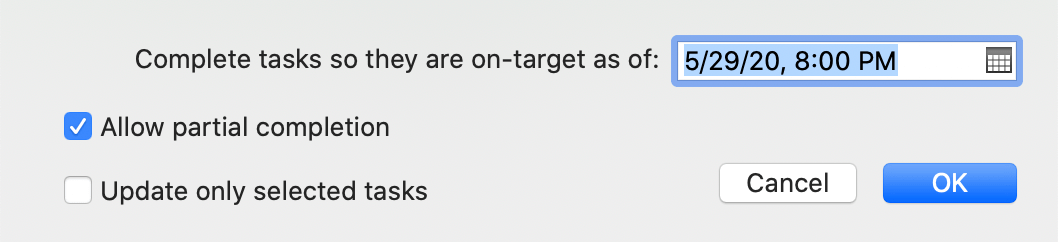
Choose a date and time (today by default), whether to allow tasks to be marked partially complete, and whether to update all tasks or only the selected ones.
When you click OK, the tasks’ completion percentages are updated to the specified date and time.
To mark a task 100% complete, you can use Shift-Option-=. Conversely, Shift-Option-– can be used to mark a task as 0% complete.
Rescheduling Incomplete Tasks
When a task is not as complete as it was scheduled to be, you can use the Reschedule toolbar button to quickly determine the best place for it in the current situation.
Clicking the Reschedule button brings up the following dialog.
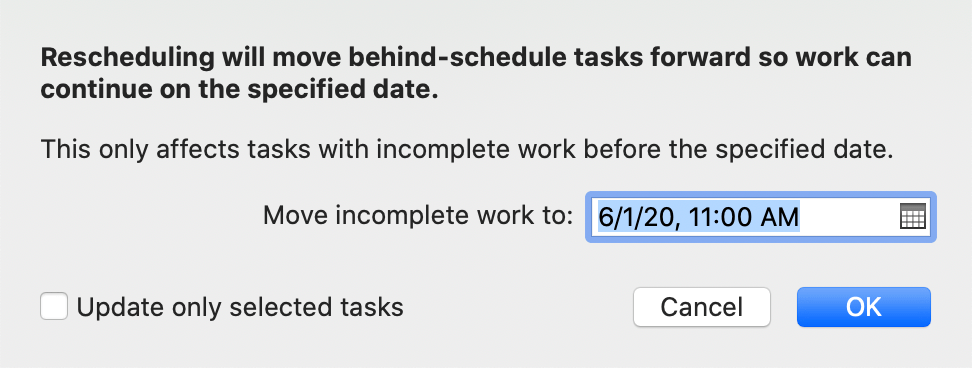
Choose a date and time to reschedule the incomplete tasks, and whether to update all tasks or only the selected ones.
When you click OK the incomplete tasks move—and the whole schedule updates—so that work can continue from here.
Note that this only moves tasks with incomplete work that was scheduled for before the date you specify; tasks in the future aren’t affected.
Visualizing in the Gantt Chart
In order to keep all of the most relevant project data at your fingertips, you can customize the appearance of many elements of the Gantt chart to suit your needs.
Customizing Task Labels
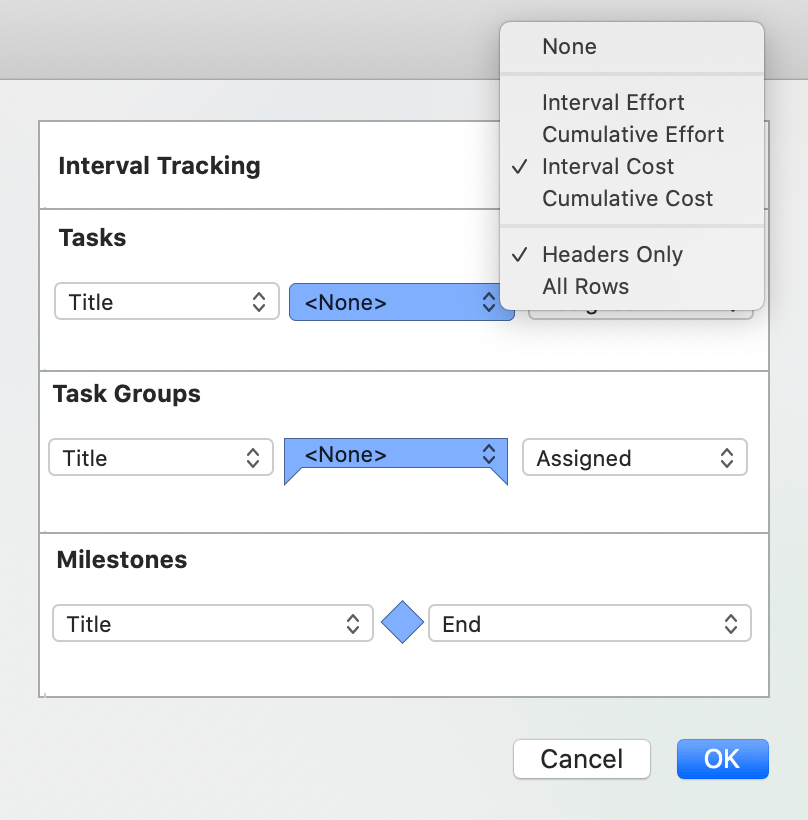
Choose View > Gantt > Customize Task Labels to open the task label editor, with popup menus for label locations relative to tasks, groups, and milestones, as well as interval tracking for rows and the Gantt chart header.
-
Interval Tracking—A representation of either cumulative or intervalic cost or effort. When turned on, the value is displayed either on every row (as a line of text beneath the row’s task bar), or only on the Gantt chart’s date header (as a row beneath the date row).
-
Tasks, Groups, Milestones—Each task type has a set of popup menus that represent areas of the task’s row in the Gantt chart: a prefix area, the task bar itself, and a suffix area after the bar. Use each menu to choose a custom column type to display in that area of the row.
Changing the Chart’s Scale
Change the visible date range in the Gantt chart using the Magnifying Glass menu in the upper-right corner of the chart, or by clicking in the chart’s date header and dragging left or right, as if you were resizing a column.
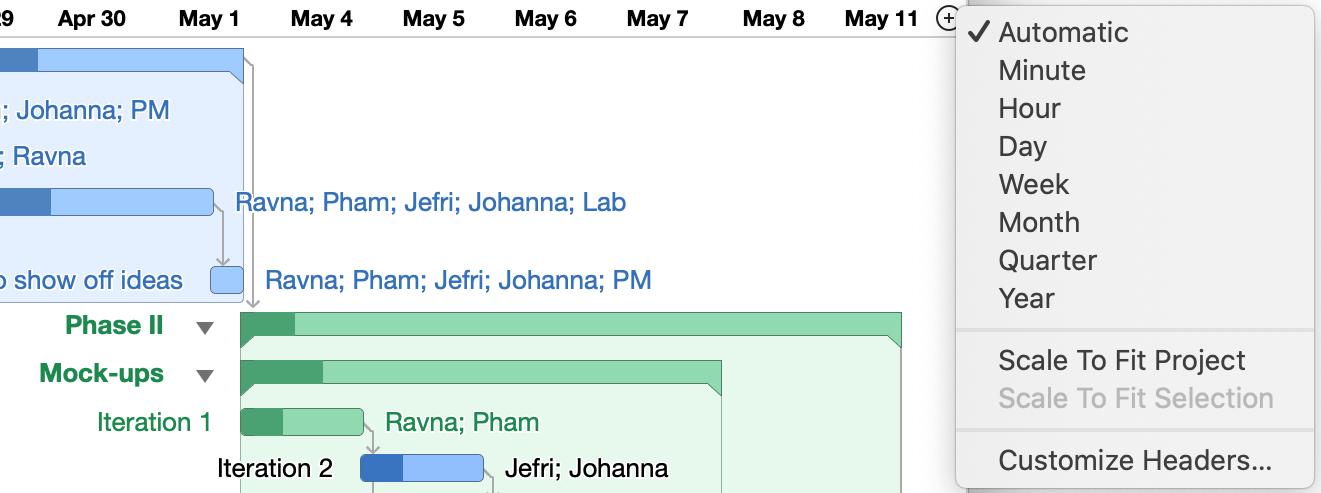
This menu is also available as a contextual menu on the date header, and includes the following commands:
-
Automatic—Scales the viewable area of the project automatically based when the project begins and ends.
-
Specific—Scales the project to increments of minutes, hours, days, weeks, months, quarters, or years.
-
Scale to Fit Project—Scales the project to fit completely inside the Gantt chart’s viewable area.
-
Scale to Fit Selection—Scales the project so the current selection fills the Gantt chart’s viewable area.
-
Customize Headers—Opens OmniPlan’s Display preferences to set up how the date headers appear in the Gantt chart.
Coloring Off Hours
To have the Gantt chart display an alternate background color for days when work is usually not occurring, choose View > Non-Working Time and pick the submenu item applicable to your situation: None, Holidays, Weekends, or All.
Highlighting off hours in this way gives better feel for when work is actually getting done, and helps explain why some bars in the Gantt chart look particularly long when the length of the tasks is not.
You can pick a color for the appearance of off hours in the Styles inspector, and you can customize the hours themselves in Resource View.
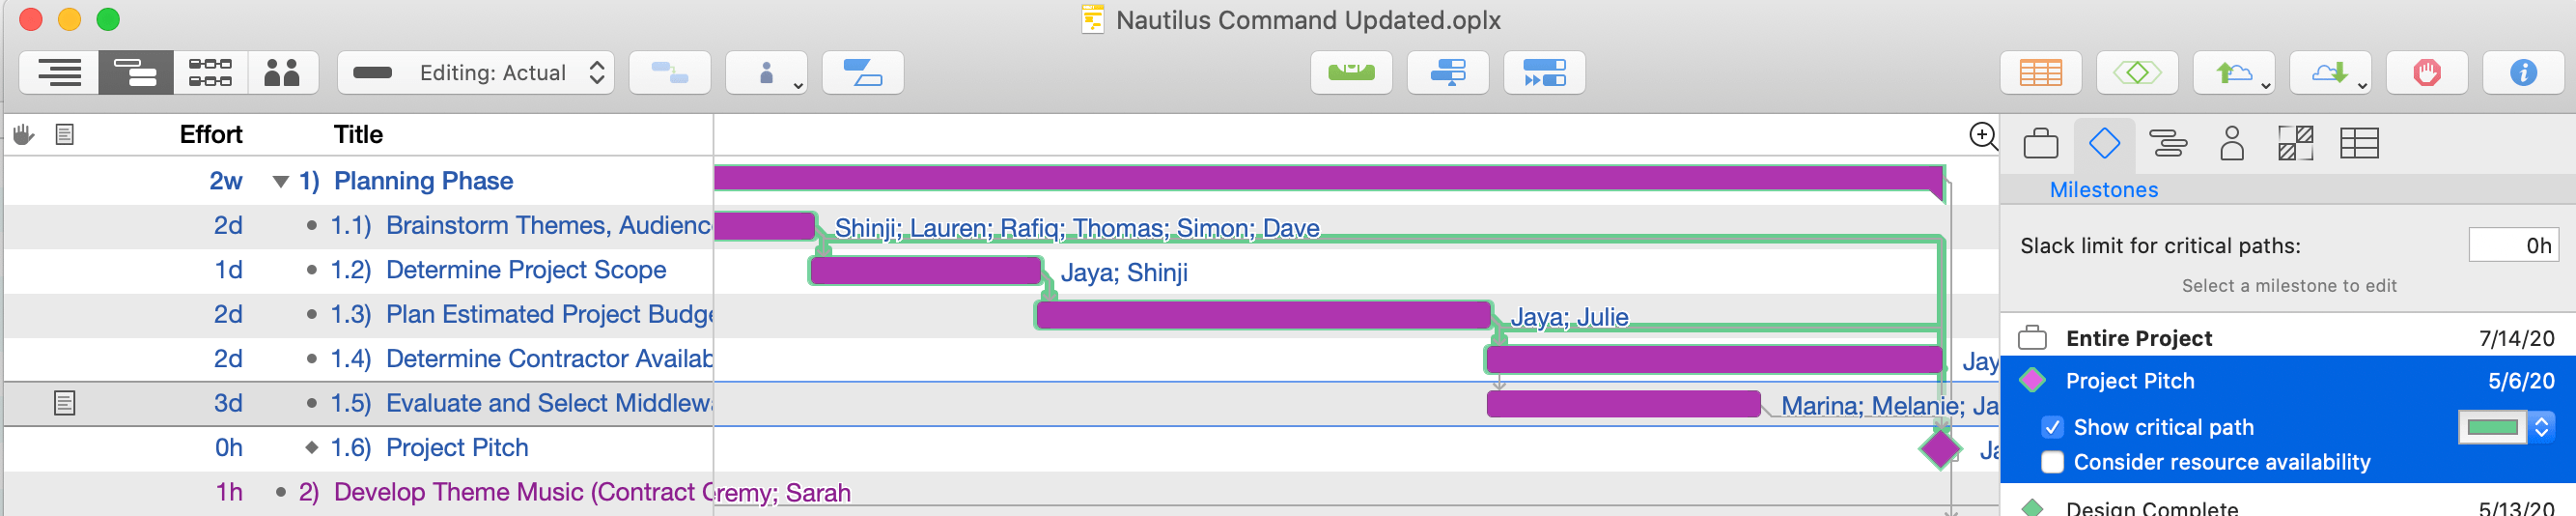
Using Critical Paths
Looking at a project or milestone’s critical path is a great way to get a feel for the tasks involved that are most important to on-time completion of the goal. Identifying tasks that are part of the critical path (and vice versa) helps prioritize work to ensure that deadlines are met.
By default, OmniPlan determines the critical path by taking into account the dependency relationships between tasks, and the amount of free time—or slack—there is between them.
-
As the critical path relates to dependencies, for example, an unbroken chain of tasks with Finish > Start dependencies represents a simple critical path to project completion. Tasks that are independent won’t be on the path at all, since they can occur at any time during the project.
-
As the critical path relates to slack, for example, hammock tasks or tasks with a set start date before which other work has been completed can lead to periods in the project where nothing is happening. The length of these periods that determine whether the critical path is affected is set in the Milestones inspector.
One other potential factor affecting critical paths is resource availability. You can choose whether or not to consider it in the display of your critical paths using the Milestones Inspector; that section also contains information on the impact of resource availablility on your critical paths, as does the Schedule section of the Task inspector.
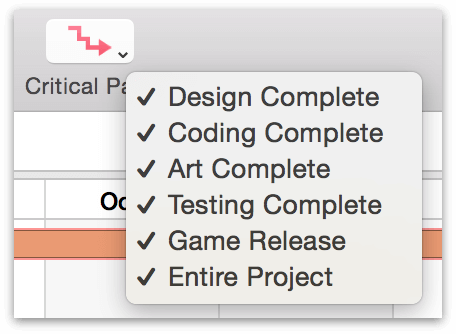
OmniPlan can display critical paths both for the entire project, and for individual milestones. To turn on critical paths, click the Critical Path button in the toolbar; to choose which critical paths to display, click the arrow in the corner of the button and choose the milestones you want, or choose them in Milestones inspector.
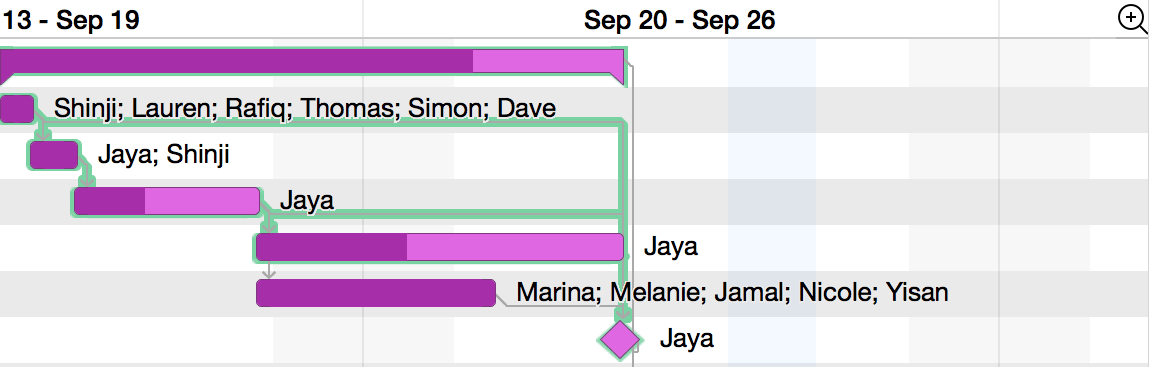
Gauging Progress with Baselines
Once you have finished setting up a project and you are ready to start implementing it, you can set a baseline schedule. The baseline represents the original intentions of the project, for comparison with the actual schedule. The actual schedule, by contrast, is the way a project turns out in real life. Before the baseline is set for a project, the baseline and actual schedules are the same. After the baseline is set, further changes affect the actual schedule only.
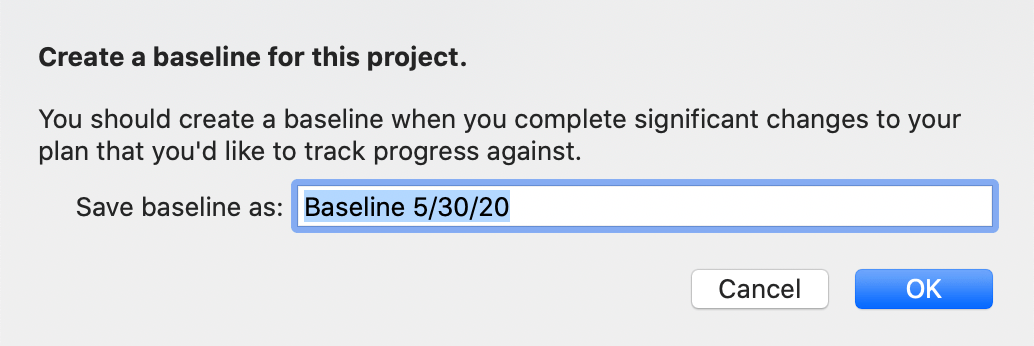
To set a baseline, click the Set Baseline button in the toolbar. You’ll be prompted with a field to name the baseline; the default name is today’s date.
When you click OK, the baseline schedule is set and any further changes are applied to the actual schedule instead.
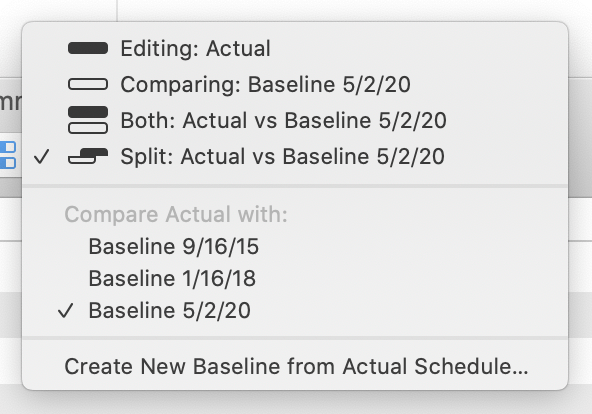
Choose Split Schedule or Both Schedules to see the baseline and actual schedules together, so you can compare them.
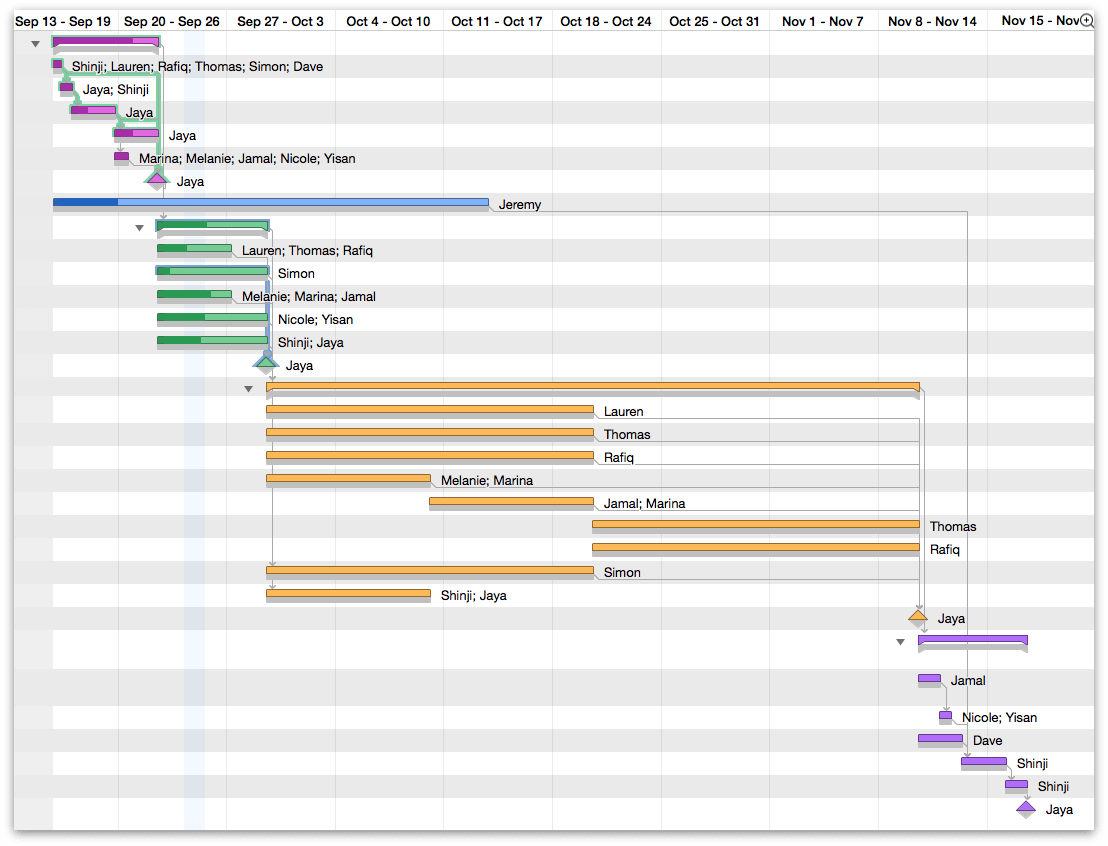
OmniPlan 4 supports as many baselines as you want—so at any given point in the project, you can take a snapshot that sets a new standard from which the actual project can proceed. You can compare a given baseline with the current actual schedule using the Baseline/Actual menu in the toolbar.
Using Simulations to Estimate Milestone Completion (Pro)
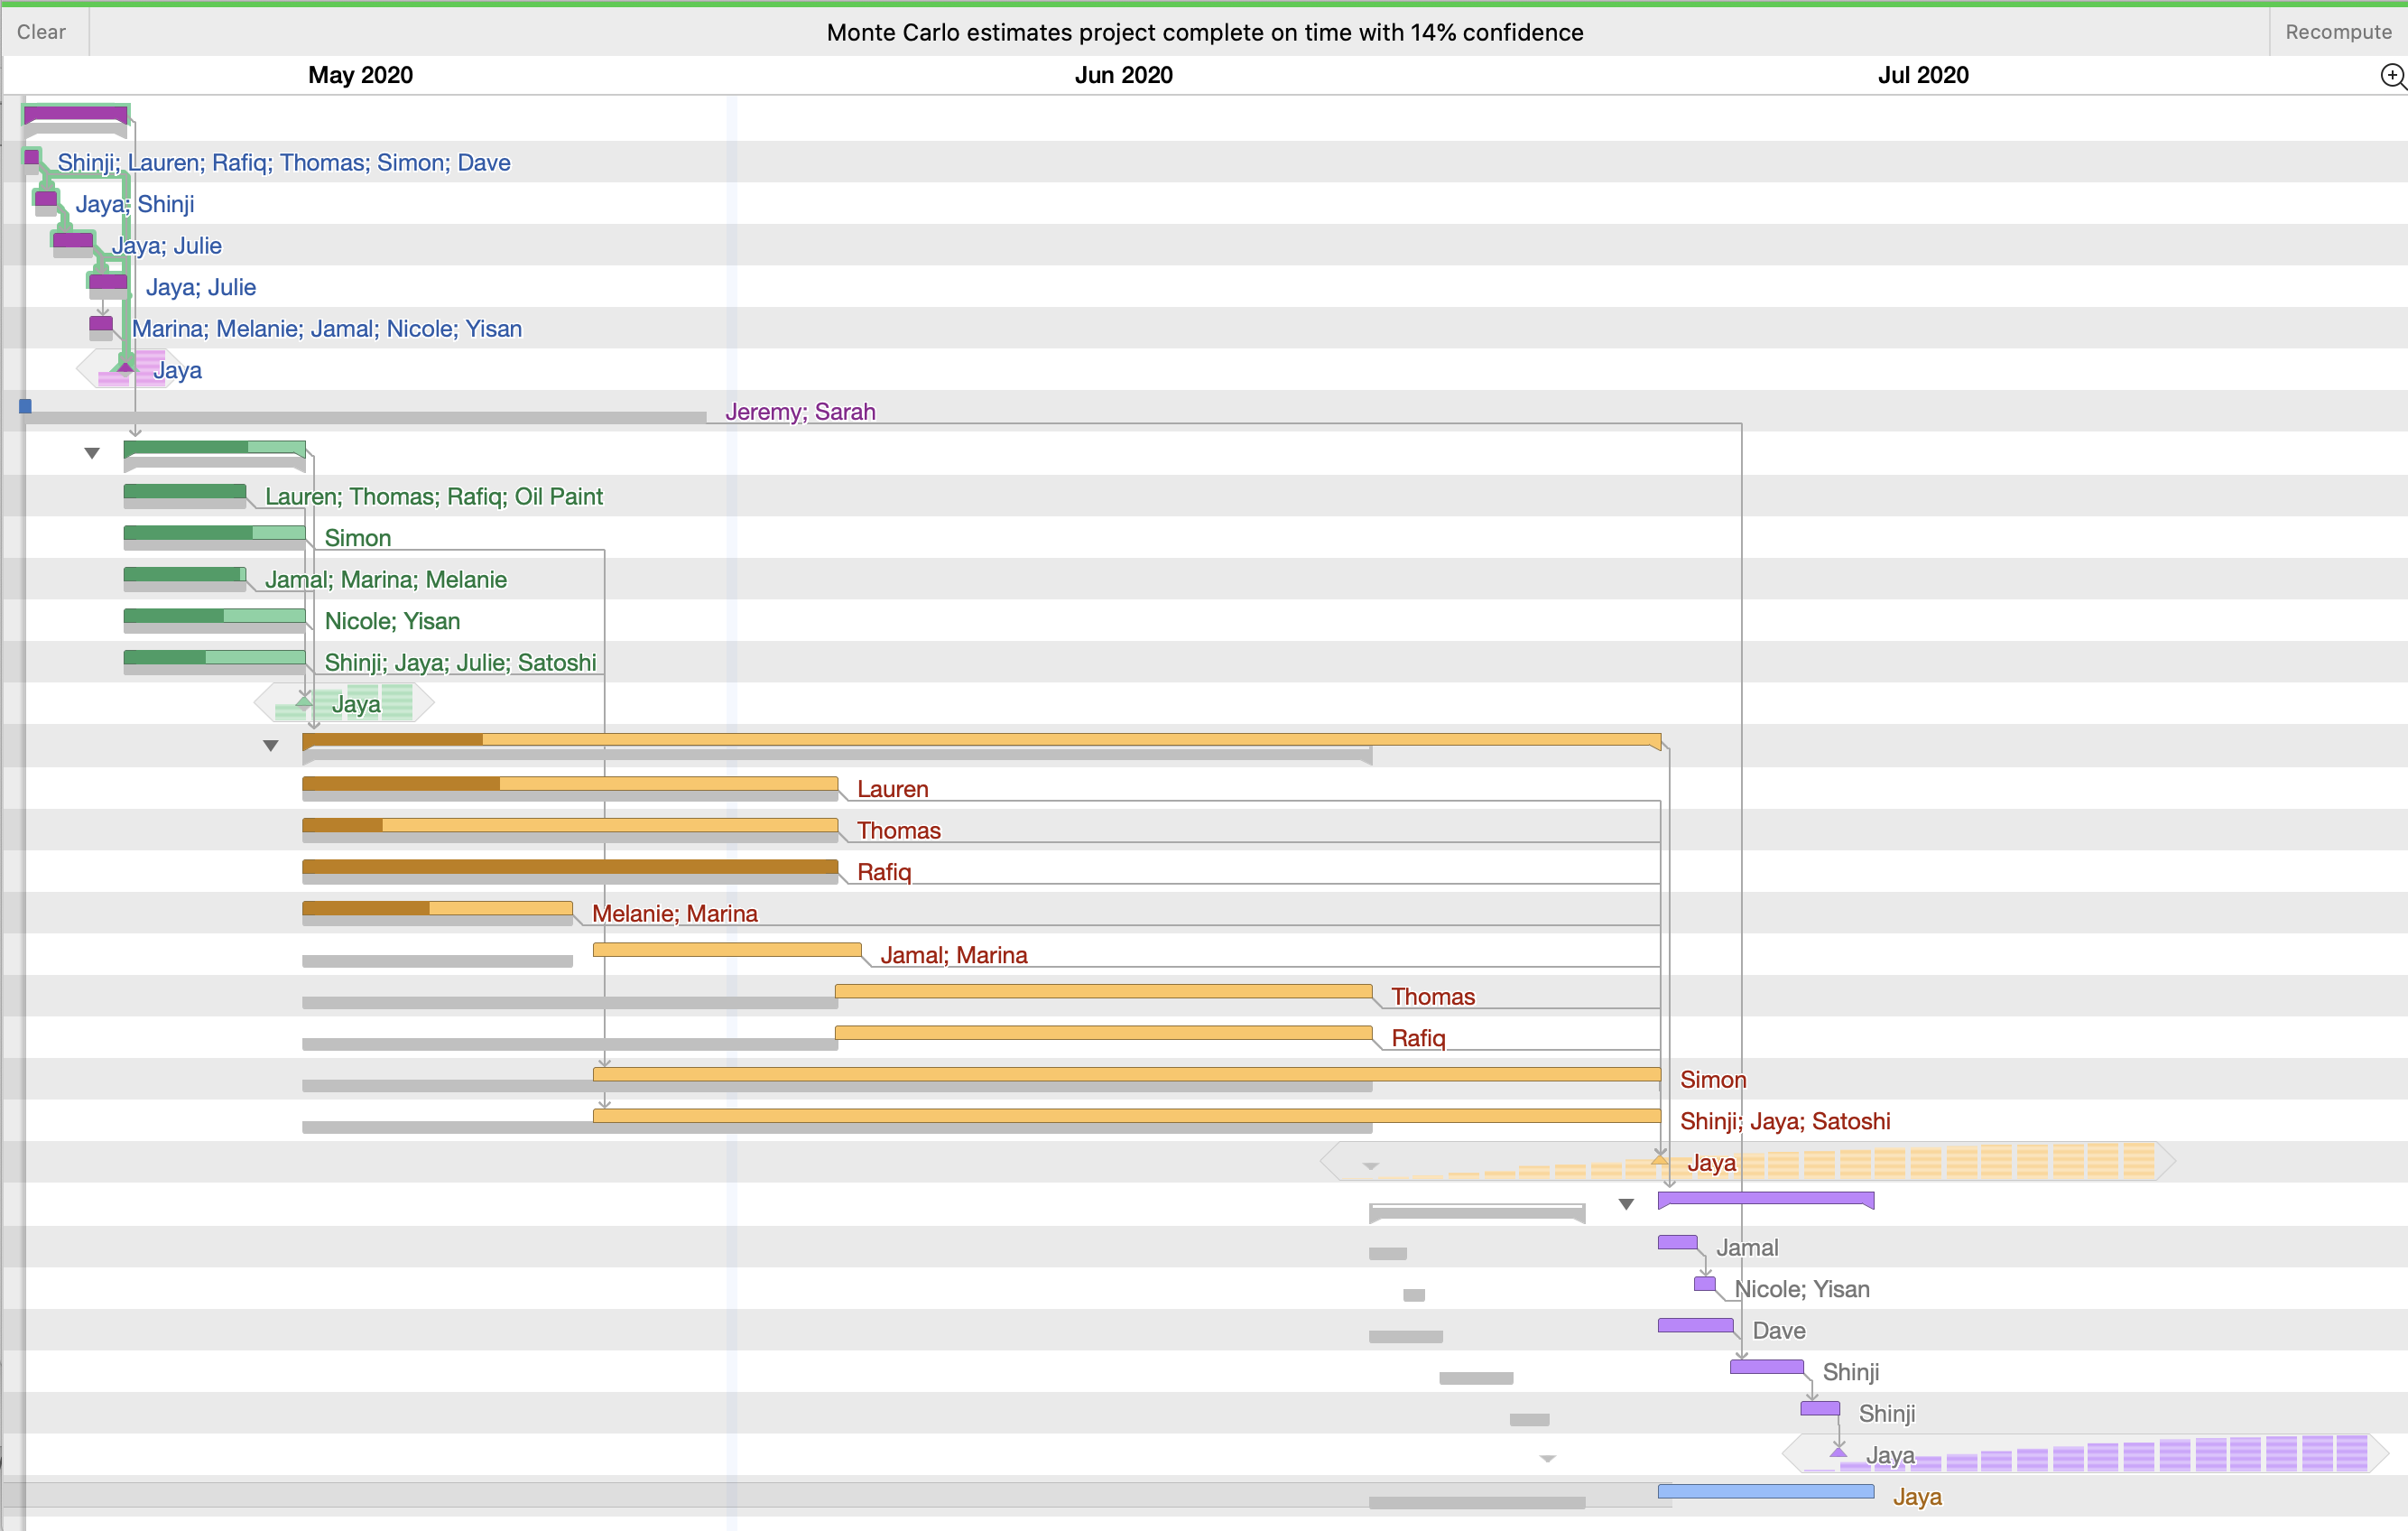
OmniPlan 4 Pro includes tools for calculating the degree of certainty that a milestone will be complete by a given deadline, using Monte Carlo simulations based on estimations of the effort required to reach the goal. The results of these simulations can help identify where things might fall behind (or even be ahead of schedule).
To run a simulation, switch to Gantt View and choose the Simulations button in the toolbar, or choose Project > Run Monte Carlo Simulations. The settings you choose here (and the simulation itself) will affect all tasks and milestones in the project.
The level of certainty the simulation provides is determined by the amount of effort estimated as required for completion of the tasks within each milestone. If you haven’t manually set effort estimates for tasks, you’ll want to either do that, or use the handy Auto-Estimate Effort feature (also found in the Monte Carlo popup menu).
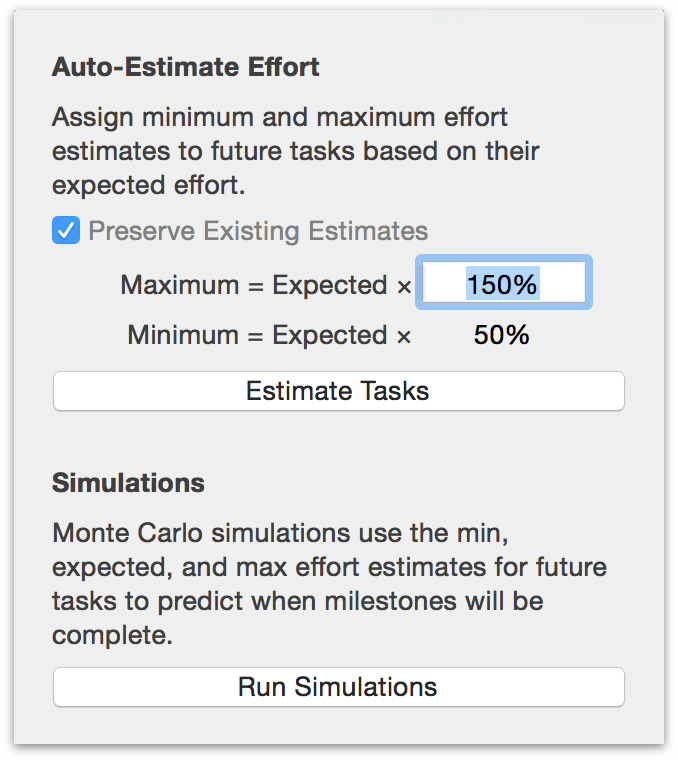
Running a simulation without setting minimum and maximum effort estimates (either manually or automatically) results in a prediction that your milestones will be completed exactly as they’re scheduled, 100% of the time. Not very useful, right? For best results, be sure to have a spread of possible efforts included (auto-estimating effort makes this easy).
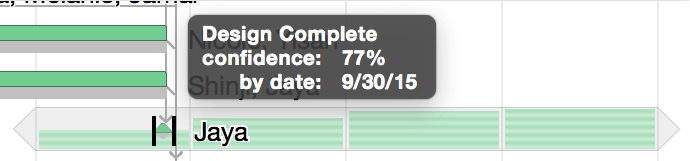
Once the simulation is complete, a set of horizontal bars appears on days surrounding each milestone (represented as a small diamond); one bar equals 20 percent confidence that the milestone will be complete on that day (5 bars on a day means that according to the simulation, a milestone is 100% likely to be completed on that day). Hover over the bars on each day for greater detail.