Project Outline View
Enter Project Outline View by clicking the first button in the view switcher in the toolbar, or choosing View > Project Outline View (Option-Command-1).

Project Outline View provides a representation of your project as a hierarchical list of tasks. Each task is represented by a row, with corresponding columns that contain specific types of information related to the tasks in your project.
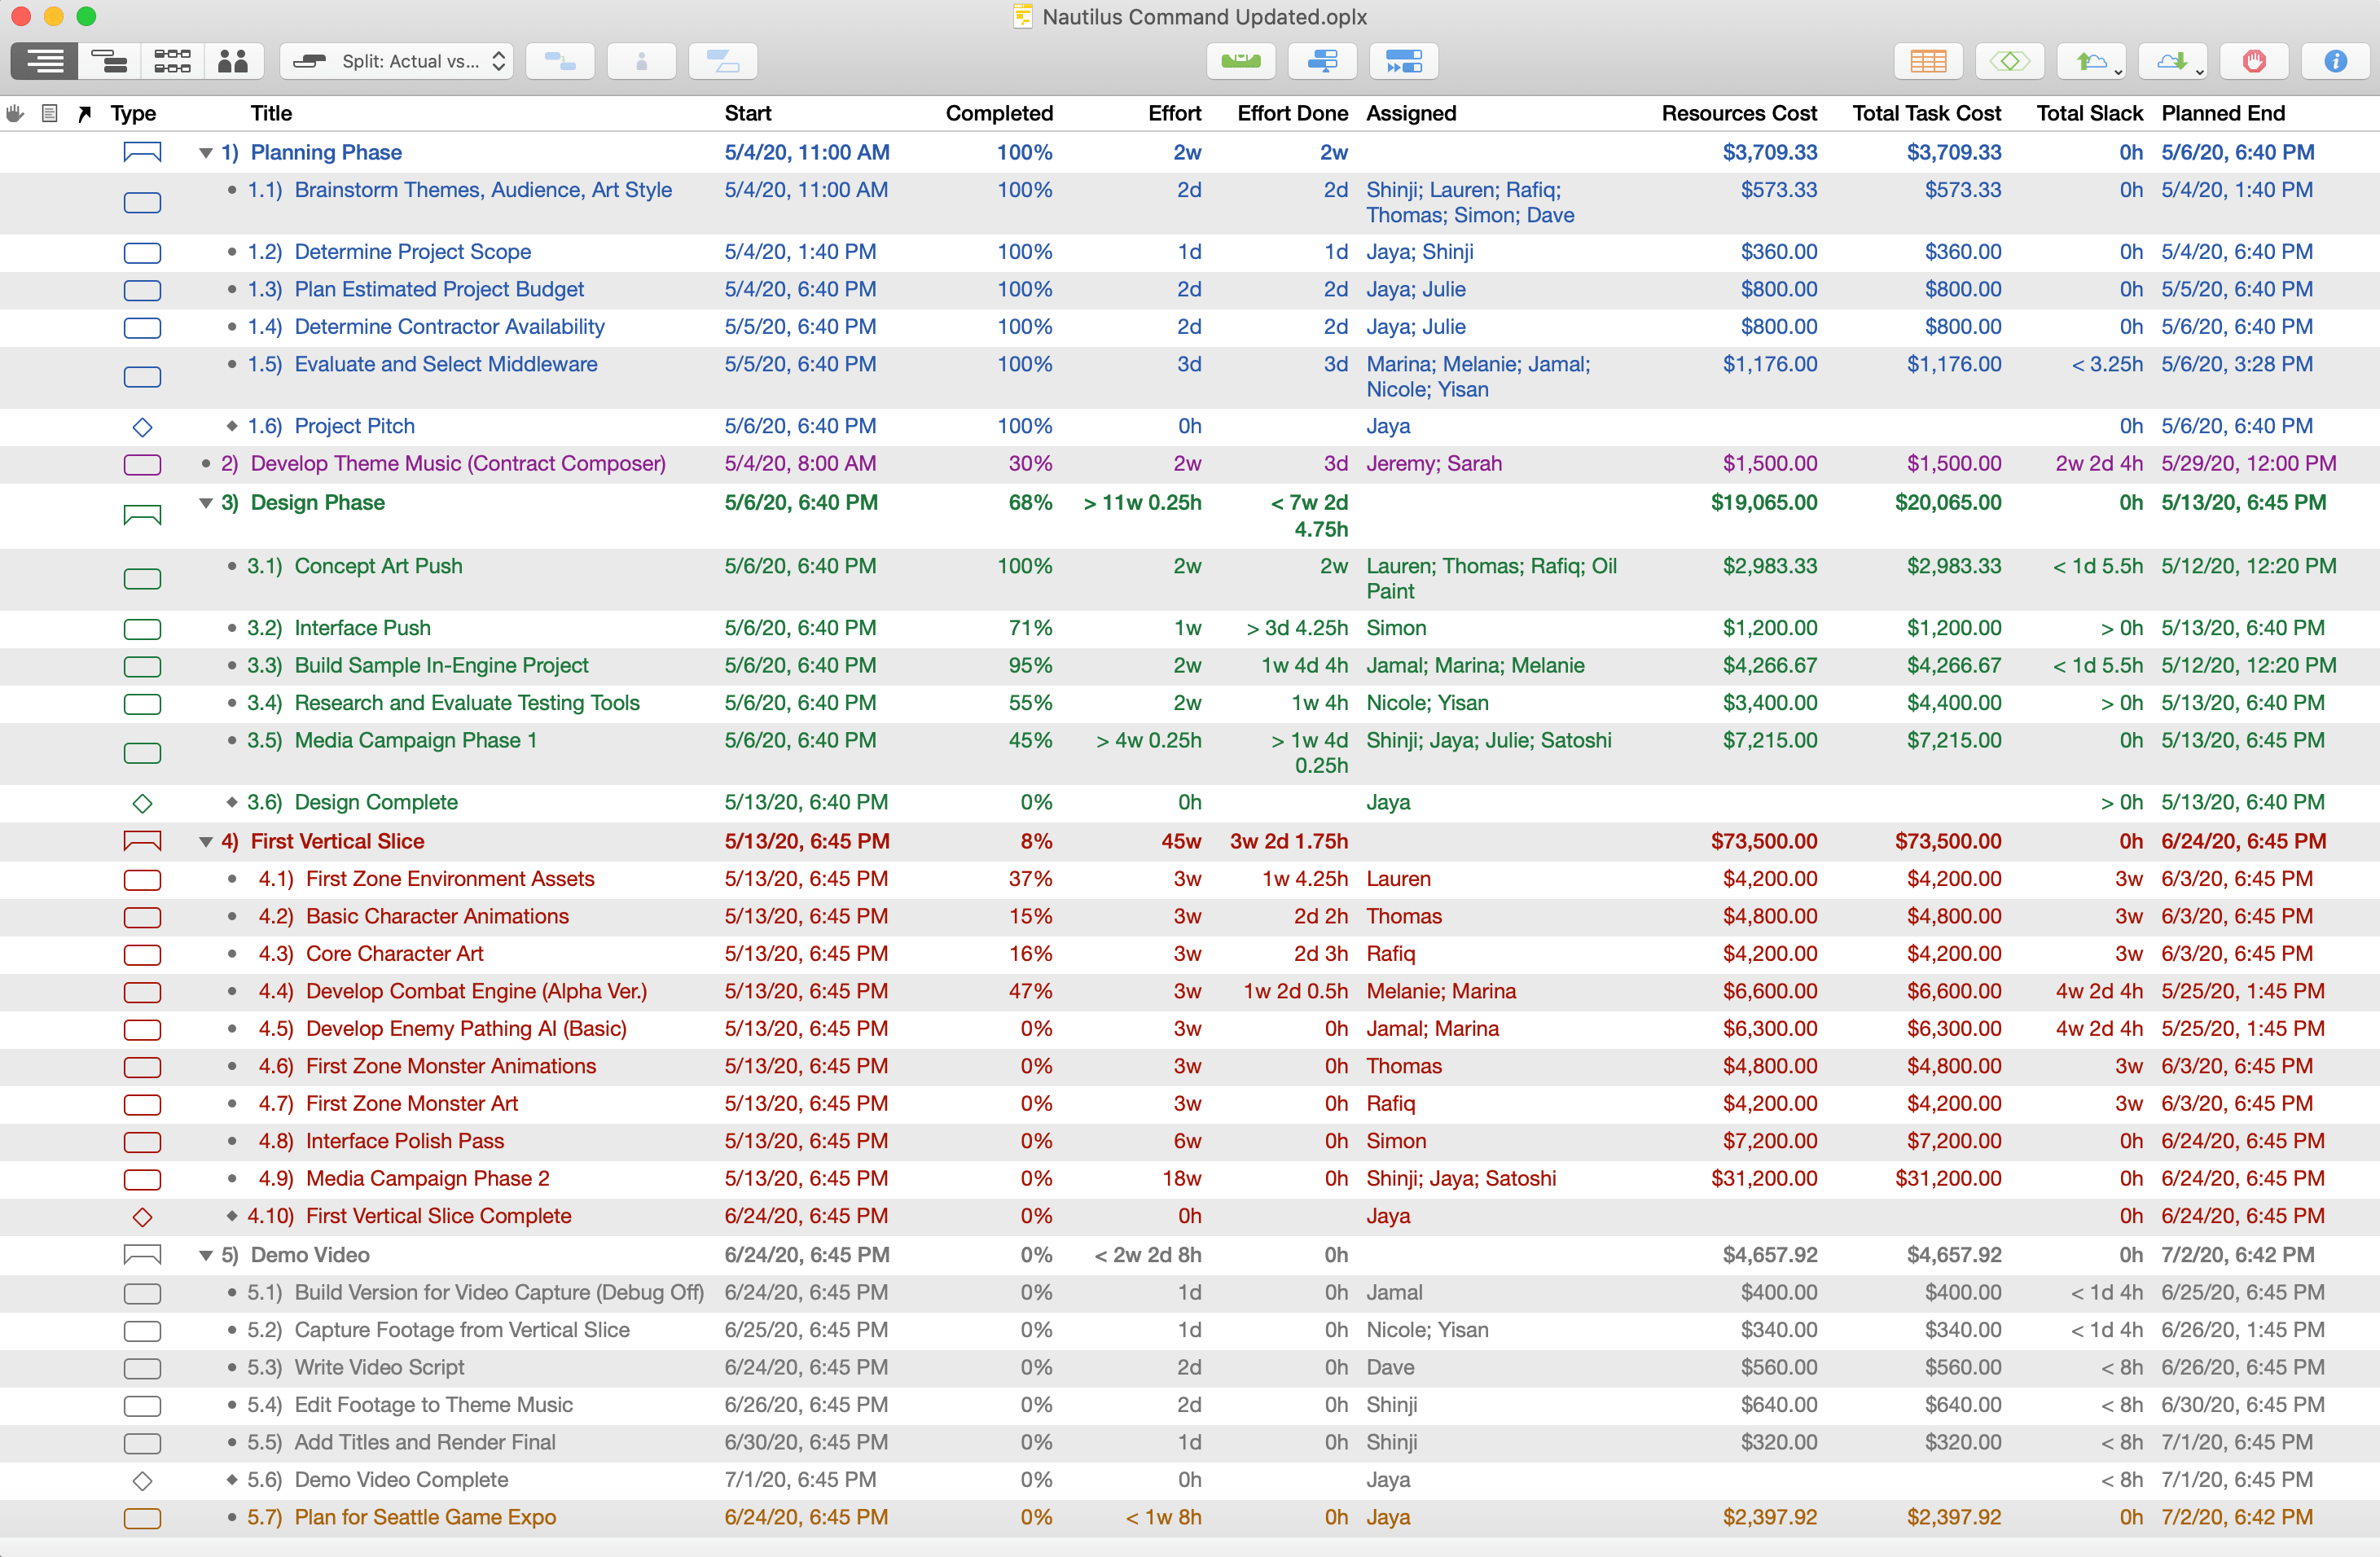

This view is ideal for quickly creating a project by entering the tasks it contains, adding the relevant information in customizable columns, and once the project is up and running, getting a data-rich spreadsheet-style overview of the project’s progress.
Creating and Deleting Tasks
As you begin building a project, rapidly creating new tasks and milestones (and removing extraneous ones) are key parts of the process, and Project Outline View is perfect for the purpose.
There are several ways to create new items in the outline:
- Select an item in the task outline and press Return (or Command-Return, depending on the keyboard options in OmniPlan’s General preferences).
- Click the Add button in the toolbar.
- Control-click and choose Add > [task type] from the contextual menu.
There are a few ways to delete a task, milestone, or group:
- Select an item in the outline, then press the Delete key.
- Select the item, then click the Remove button in the toolbar.
- Select the item, then control-click to reveal the contextual menu and choose Delete.
If you are publishing and subscribing with OmniPlan Pro, new tasks and changes can come from other users of the project. Use the change tracking sidebar to accept or reject these changes.
Project Outline Columns
You can customize the outline in Project Outline View to display a set of columns with data specifically relevant to your project. Control-click the outline header or choose View > Task Outline > Customize Columns to choose which columns to display.
Data in the these columns corresponds to task rows in the outline. Some column values (such as Task Cost) can be edited directly in the outline; others (such as Total Cost) are calculated automatically. Generally, values you can edit in the outline correspond to editable fields in the Task and Resource inspectors.
Use the arrow keys, or Tab and Shift-Tab (depending the options you have chosen in OmniPlan’s preferences), to move between cells.
Drag column titles left and right to rearrange the columns.
You can sort the selected items in the outline, or all items (if nothing is selected), by using the Sort commands in the Structure menu.
If you would like to add columns to the task outline that aren’t part of the default list (or if you are seeing unexpected entries in the list), note that key/value pairs you set up for tasks using the Custom Data inspector are added to the list as custom column types.
The following columns represent properties of tasks that can be included for display in the outline.
Violations
This column displays an icon for each task that has a violation. Click the icon to summon the Violations window and see what the problem is.
Status
This column shows alarm clock icons for tasks that are incomplete and due in the next few days, or in the past. Note that these icons won’t appear if your project has an undetermined start date. Each icon color has a meaning:
- Almost due (green): this task is incomplete and due in the next 3 work days.
- Due (yellow): this task is incomplete and due in the next work day.
- Past due (red): this task is incomplete and past due.
Attachments
Click the Attachment icon in the selected row to see a menu of the item’s attachments, or to link to a file if there is not one linked yet. Rows with links to files show an arrow icon even when they are deselected.
Notes
Store extra text about an item with this column. To edit the selected item’s note, press Command-’, click the Note icon that appears in the column, or use the Custom Data Notes inspector.
Once an item has a note, you can move in and out of the note field by pressing Command-’ (which hides the note after you stop editing it). Rows with notes show a note icon even when they are deselected.
Note text can be styled on a document level using the Advanced tab of the Styles inspector or customized individually with the Format menu.
Unique ID
The unique ID is a number assigned to each task to identify it unambiguously, even if its name or position in the outline changes. A unique ID won’t ever change, and each new task or resource you create gets a new unique ID number. These numbers are useful for matching up items when you are importing and exporting projects between OmniPlan and other applications.
Title
The title of the task, preceded by a number representing its hierarchical placement in the outline.
Hierarchical Title
The title of the task, preceded by the title of each task above it in the hierarchy, with each title separated by a colon.
Duration
The task duration.
Effort
The amount of total effort the task takes to complete.
Effort Done
The amount of effort completed on the task.
Remaining Effort
The amount of effort remaining before the task is completed.
Prerequisites
A list of the tasks, by number, that the task relies on in some way (as indicated by the dependency type code).
Dependents
A list of the tasks, by number, that rely on this task in some way (as indicated by the dependency type code).
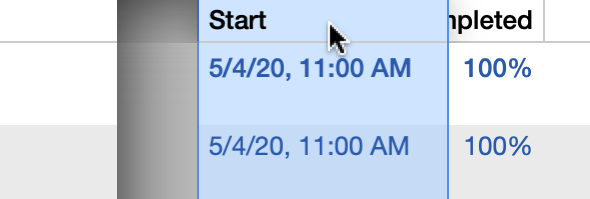
Start
The actual start time for the task, as determined automatically by leveling or set manually in this cell or in the Task Schedule inspector.
End
The actual end time for the task, as determined automatically by leveling or set manually in this cell or in the Task Schedule inspector.
Priority
You can manually set a priority on a task to control the order in which tasks are leveled. During leveling, if two tasks are assigned to one resource at the same time, the task with higher priority (expressed as a larger positive number) gets to use the resource first.
Completed
The amount of work that has been completed on the task, expressed as a percentage.
Assigned
A list of the resources that are assigned to the task.
Start After
Set or display the task’s Start After constraint, if any. This is the same as the Start No Earlier Than constraint in the Task Schedule inspector.
Start Before
Set or display the task’s Start Before constraint, if any. This is the same as the Start No Later Than constraint in the Task Schedule inspector.
End After
Set or display the task’s End After constraint, if any. This is the same as the End No Earlier Than constraint in the Task Schedule inspector.
End Before
Set or display the task’s End Before constraint, if any. This is the same as the End No Later Than constraint in the Task Schedule inspector.
Task Cost
Any costs associated with completing the task other than the cost of the resources assigned to work on it.
Resources Cost
The cost of the resources assigned to the task. This value cannot be edited directly (edit the individual resource costs or change the resource assignments instead).
Total Task Cost
The task cost plus the resources cost.
Planned Start
The time at which the task is planned to start according to the baseline schedule.
Start Variance
The difference between the planned start and the actual start of the task.
Planned End
The time at which the task is planned to end according to the baseline schedule.
End Variance
The difference between the planned end and the actual end of the task.
Free Slack
Slack between an individual task and its subsequent tasks. This value cannot be edited directly.
Total Slack
Total slack refers to the time before an individual task would have an effect on the duration of the project as a whole. This value cannot be edited directly.
Min Effort Estimate (Pro)
The minimum amount of effort that you estimate the task will take. This value can be set automatically using the Simulations toolbar button. This and the following two values are part of the computation for Monte Carlo simulations.
Expected Effort Estimate (Pro)
The amount of effort that you expect the task will take. By default this is equal to the task’s actual effort.
Max Effort Estimate (Pro)
The maximum amount of effort that you estimate the task will take. This value can be set automatically using the Simulations toolbar button.
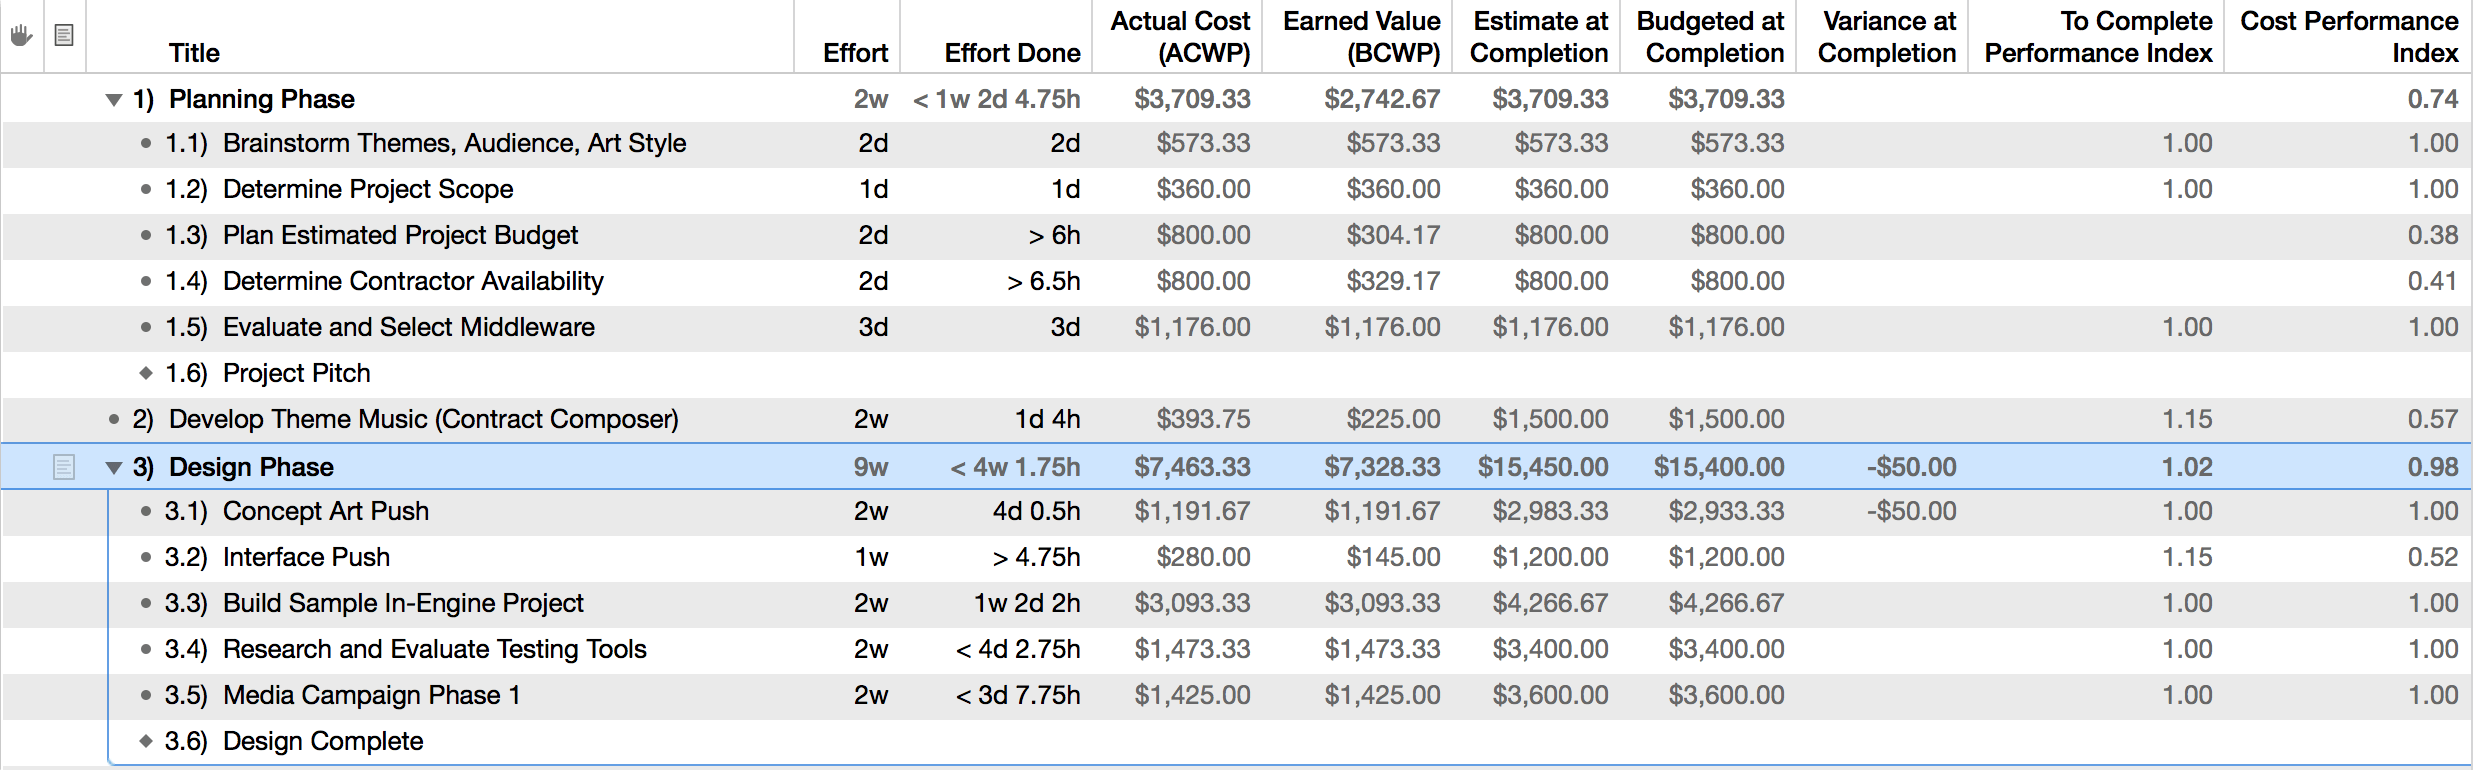
Earned Value Analysis (Pro)
OmniPlan 4 Pro offers several custom column types useful for tracking and managing the budget and progress of your project. Taken together, they represent a full implementation of the Earned Value Analysis project management technique (also known as earned value management, or EVM). We’ll be referring to it as earned value analysis (or EVA) throughout OmniPlan and throughout this manual.
Since the value of EVA lies in the comparison of the actual state of your project with its initial plan, the first thing we need is a baseline. If you don’t have one set up yet, you’ll want to do that now. If you would like to simulate a project state earlier or later in the project, choose Project > Set Current Editing Date and enter the desired date.
If you compare with a baseline set at the beginning of your project, many EVA column values won’t appear. This is because you would essentially be dividing by zero (the current actual cost at that baseline) to generate the cost performance index, and earned value is only relevant in the context of other factors affecting the project in progress. For a preview of the planned costs of your project, try using the Total Task Cost column instead.
With a baseline set, we can start building out the attributes of tasks and resources that EVA requires to deliver meaningful results. The original and derived values represented by the suite of EVA columns can be dizzying to take in all at once, so let’s break it down into some smaller pieces.
We’ll begin by enabling some familiar, pre-existing columns, and making sure they’re populated with relevant data.
In Gantt View:
- Effort—Any task you create is going to require some amount of effort to complete, so this one’s easy.
- Effort Done—EVA tracks progress compared to the baseline, so updating the amount of work done on tasks is an important component of calculating value.
In Resource View:
- Cost/Hour or Cost/Use—Tracking how much money is being spent on effort done is another key component of EVA. If your workers are salaried, you’ll want to compute their wage as an hourly value for use here.
With these set up, we can begin putting the EVA columns to use. This first group of columns tells us about the amount of money we’ve spent on tasks to this point in the project, and compares that with our initial budget.
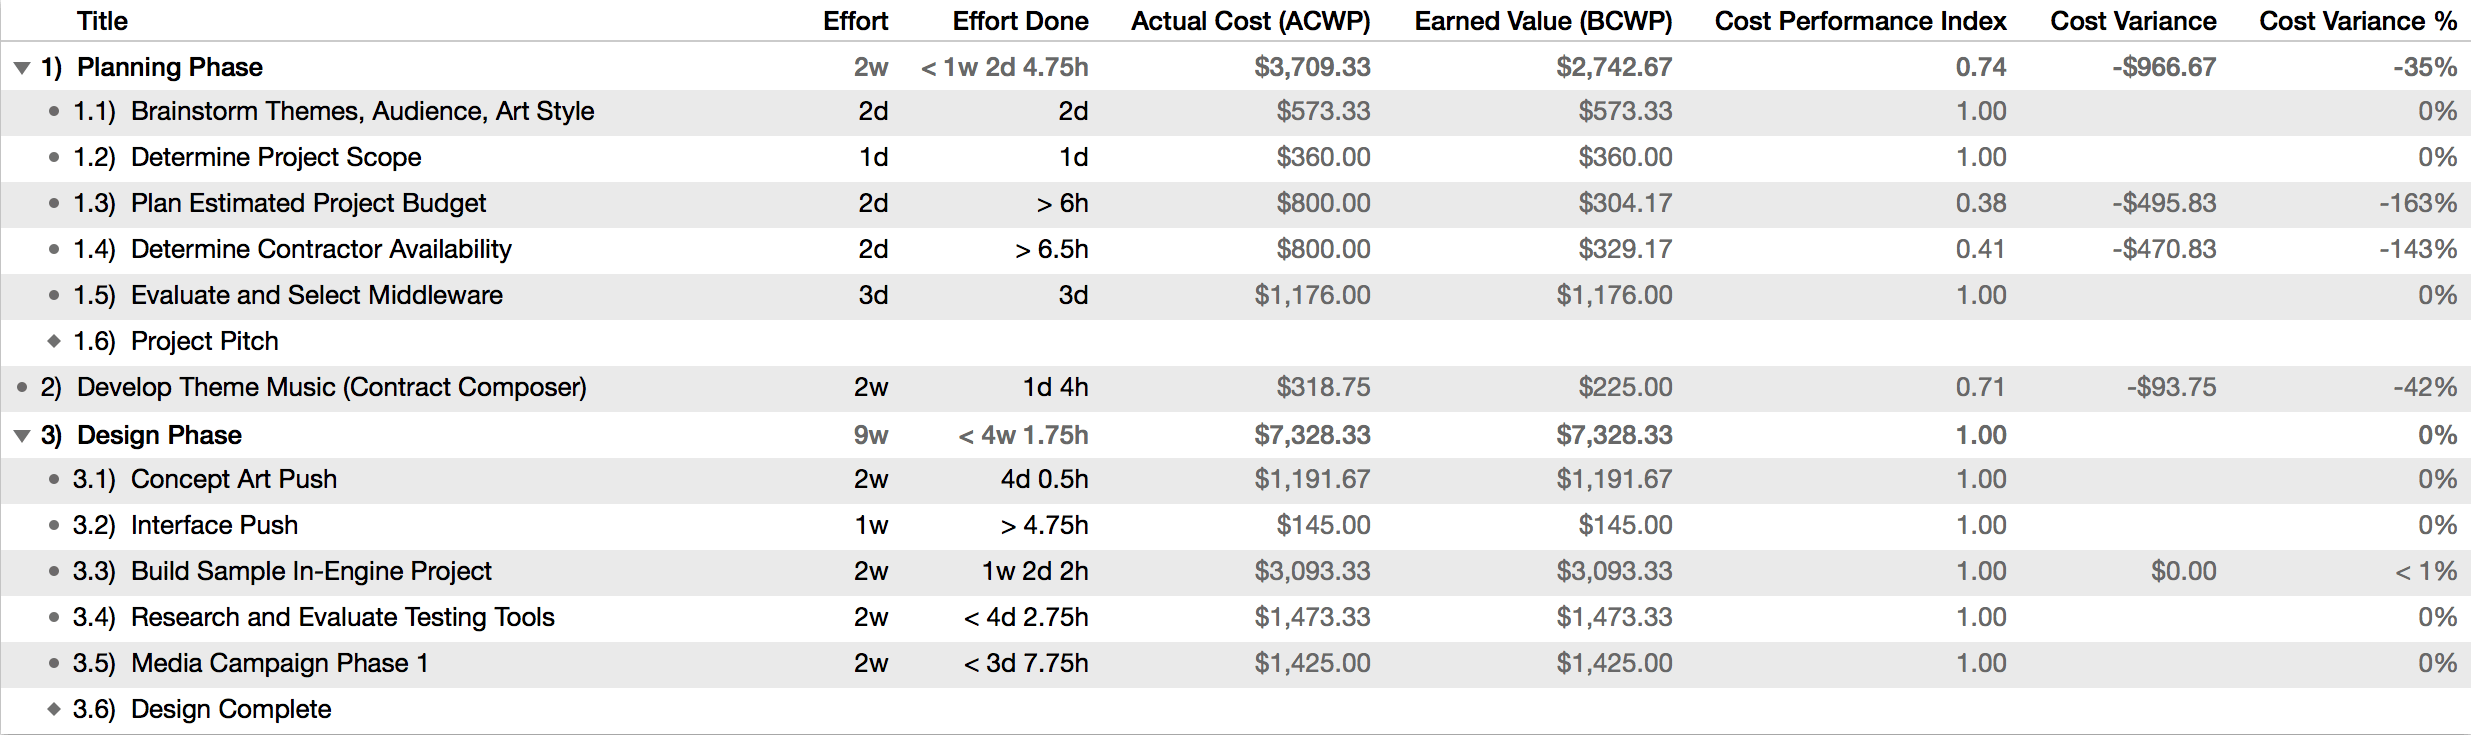
- Actual Cost (ACWP)
- This column is pretty straightforward; it’s the actual cost of work performed up to the current date. In OmniPlan terms, this represents the amount of effort completed by resources assigned to a task, multiplied by their costs. If two 8-hour days of effort are finished and a resource is contributing at 100% units and efficiency at a Cost/Hour of $50, they’ll contribute $800 to the actual cost.
- Earned Value (BCWP)
- The earned value, or budgeted cost of work performed, is another pretty simple calculation that represents the planned budget for the amount of work done on the project at this point (“this point” being the baseline used for analysis). This value is determined at the start of the project by effort assignments and resource costs.
- Cost Performance Index (CPI)
- The Cost Performance Index is reached by dividing the task’s earned value by its actual cost. This is a handy way to see, at a glance, whether the task is over- or under-budget: values higher than 1 are under budget, values lower than one are over budget, and 1 exactly means the project’s budget is right on track.
- Cost Variance and Cost Variance %
- Cost Variance is the concrete number that gives us the good (or bad) news about how much a task is under or over budget. The Cost Variance column is expressed as a currency amount relative to the earned value, and the Cost Variance % column is (as you would expect) expressed as a percentage of the earned value. Notably, any time the planned and actual budgets agree (the cost performance index is at 1), these columns will be empty.
The next group of EVA columns describes the status of the project relative to the planned schedule.
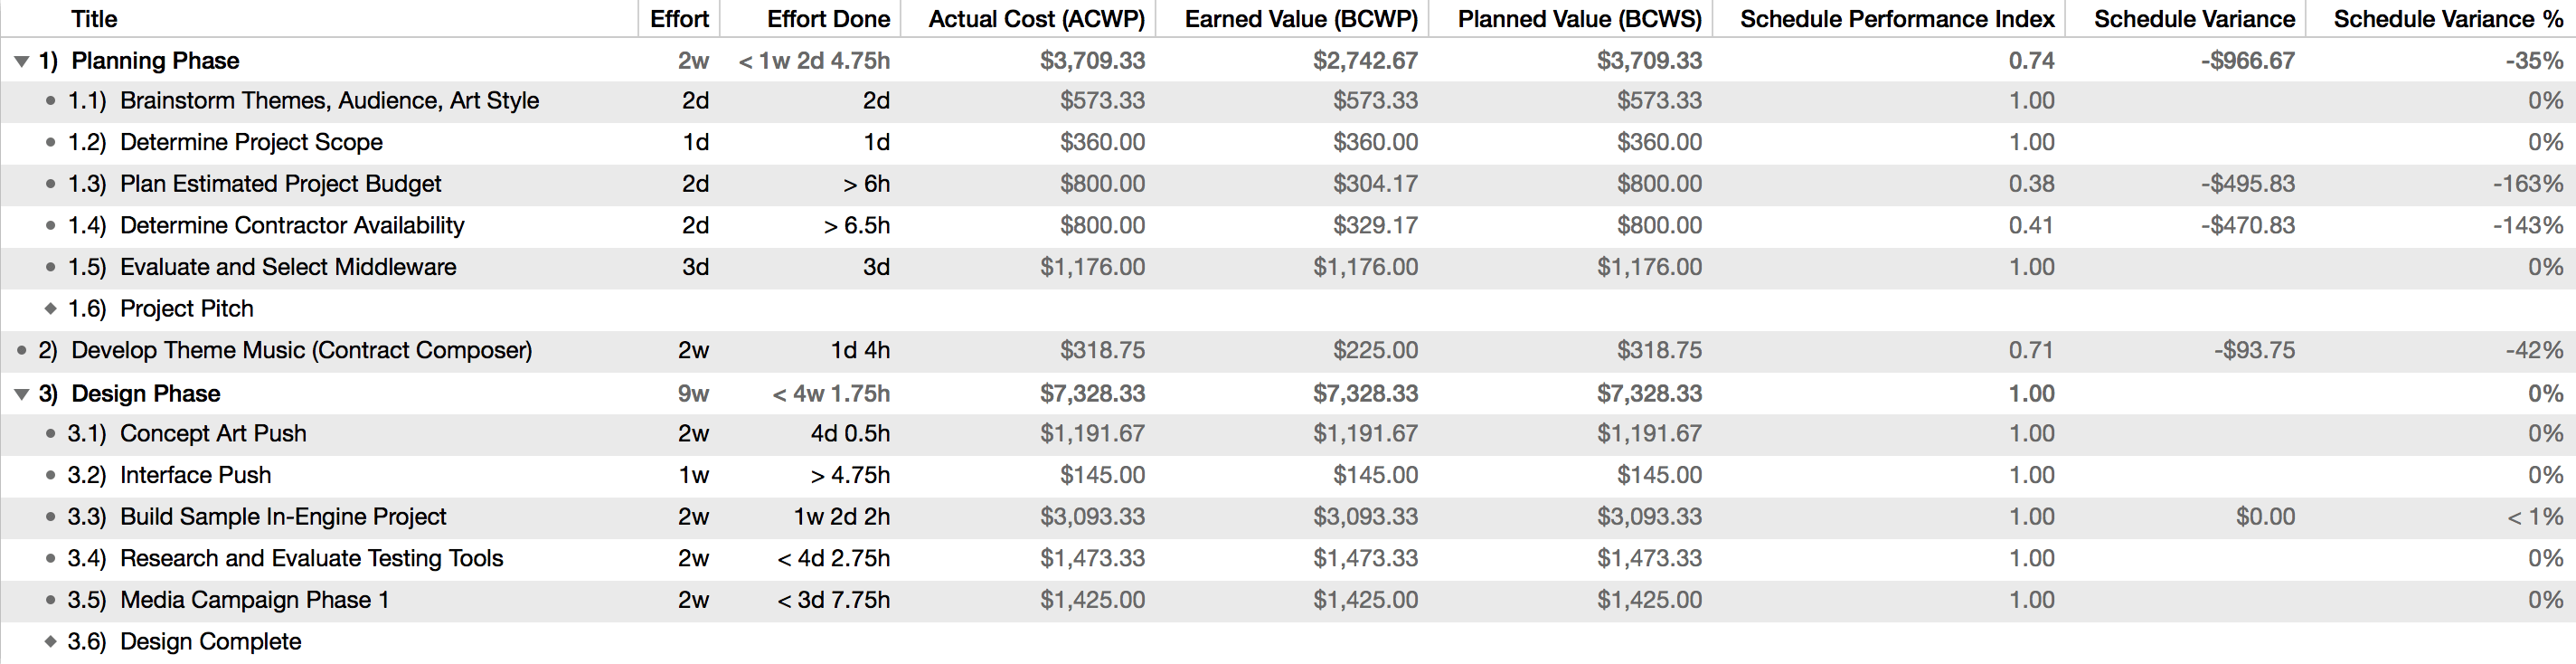
- Planned Value (BCWS)
- Planned Value, or Budgeted Cost of Work Scheduled, lists the expected cost of work-to-date as planned in the project’s initial schedule. This is derived from the planned costs of tasks and resources, along with the baseline and editing date chosen.
- Schedule Performance Index (SPI)
- The Schedule Performance Index is derived by dividing earned value by the planned value. Like the cost performance index, it’s expressed as a number greater or less than one; higher values represent being ahead of schedule, while values less than one represent being behind schedule.
- Schedule Variance and Schedule Variance %
- Schedule Variance is the value that tells us in concrete terms how far we are ahead of—or behind—schedule. It subtracts planned value from earned value, giving us an amount in currency that represents the difference between how much we should have been paying for work-to-date, versus how much we’ve actually paid. Schedule Variance % represents this same amount as a percentage.
The final group of EVA columns is related to forecasting the budget of tasks at their completion.
- Estimate at Completion (EAC)
- This value represents the estimated actual final cost of the task, as work progresses. Before the start of the project, EAC is equal to the budget for the task (Budgeted at Completion, below). As the project progresses, EAC and BAC may diverge.
- Budgeted at Completion (BAC)
- Budgeted at Completion represents the initial budgeted cost of all work on the task. If work gets behind schedule or there are cost overruns on materials, the actual cost (and therefore the estimated cost at completion) will rise above the BAC cost.
- Variance at Completion (VAC)
- This column represents the difference between the estimated actual (final) cost of completion and the budgeted (initial) cost of completion of the task. Expressed as a currency amount, a negative VAC denotes a cost overrun, while a positive VAC represents a budget surplus.
- To Complete Performance Index (TCPI)
- The To Complete Performance Index is a bit unique among the EVA columns in OmniPlan, in that it tells you about the state of your project’s budget and schedule by way of a recommendation. The TCPI represents the cost performance index (CPI, explained above) that you need to maintain for the task, from your current editing date, in order to be on budget. A value other than 1 describes a recommended course correction: higher requires some belt-tightening, while lower indicates that there are funds to spare.
As another way to think about EVA, consider the current editing date and the baseline as the x and y axes of a chart whose parameters you can use to set up simulated scenarios for your project. The baseline provides a y-axis time anchor for your project’s state of affairs, and the current editing date is a time travel device along the calendar’s x-axis that lets you consider that snapshot as if the project’s progress to date had happened earlier, or all progress froze and the project stood still until some point in the future.
Filtering the Project Outline
When you want to focus on a specific aspect of your project, you can view a subset of its tasks by creating filters for specific criteria. Possible filters include focusing on tasks that were completed in the past week, tasks that are behind the baseline target date by greater than three days, or as in the example below, tasks that are less than 50% complete.
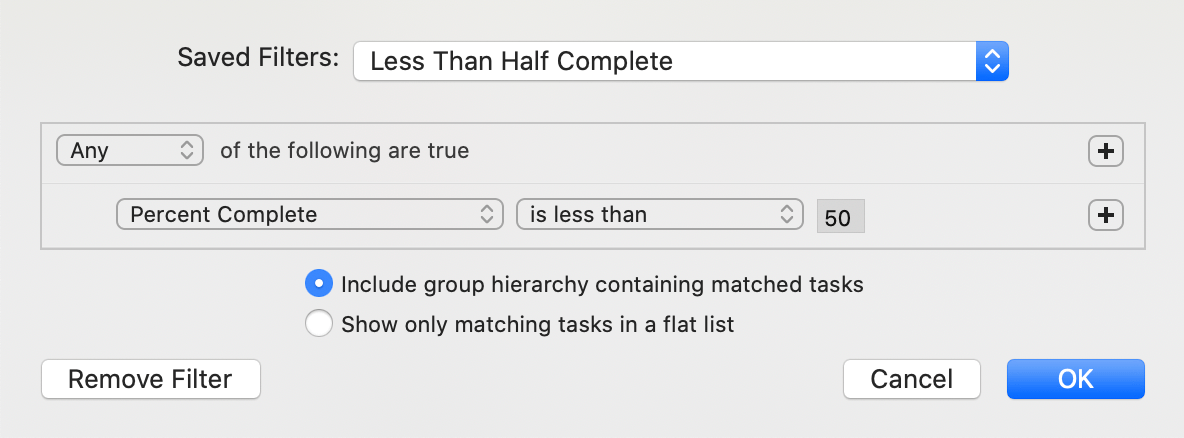
Choose View > Filter Tasks (Option-Command-F), or click the Filter button in the toolbar. A sheet appears for setting up your filtering criteria. You can add as many criteria as you like by clicking the plus icon on the right side of the entry line, and filter the criteria themselves by Option-clicking on the add button to create nested criteria within the filter hierarchy. When your criteria are set up the way you want them, click the Save Filter dropdown menu to save the current filter or restore a previously saved filter. (You can also use the View > Restore Saved Filter menu item.)
When your filter is set, any tasks which match your criteria remain in the outline, while the rest of the project is hidden away. You can work with the project normally while it is filtered, but you can only edit the visible tasks. While your filter is in use the Filter Bar appears, providing options to refresh, edit, or remove the filter and showing the number of tasks hidden.

When you are done, choose View > Remove Filter or click the toolbar button again; all of your tasks reappear, no worse for the wear.
Filter Notes
-
Any tasks created while a filter is in place will not have the filter applied to them by default, so they will appear in the task outline (regardless of whether the filter would hide or show them) until the filter is refreshed or reapplied.
-
If you export or print a project while a filter is on, only the visible tasks are included in the exported file.