Working in Task View
Tasks are the building blocks of any project: the steps that must be completed on the road to an ultimate goal. OmniPlan provides a suite of powerful tools for customizing tasks — and the relationships between them — to match the exact parameters of your project.

Enter Task View by clicking the first button in the view switcher in the toolbar, or choosing View ▸ Task View (Option-Command-1).
Creating and Deleting Items
Task View contains two primary zones of interaction: the task outline, and the Gantt chart. As you begin building a project, rapidly creating new tasks and milestones (and removing extraneous ones) are key parts of the process — and Task View’s outline is perfect for the purpose.
There are several ways to create new items in Task View:
- Select an item in the task outline and press Return (or Command-Return, depending on the keyboard options in OmniPlan’s General preferences).
- Click the Add button in the toolbar.
- Secondary-click and choose Add ▸ [task type] from the contextual menu.
There are a few ways to delete a task, milestone, or group:
- Select an item in the outline, then press the Delete key.
- Select the item, then click the Remove button in the toolbar.
- Select the item, then Control-click to reveal the contextual menu and choose Delete.
If you’re publishing and subscribing with OmniPlan Pro, new tasks and changes can come from other users of the project. Use the change tracking sidebar to accept or reject these changes.
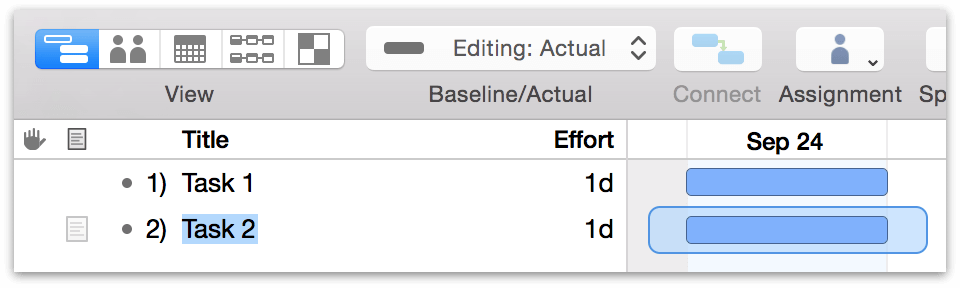
Tasks have a lot of details to keep track of. You can edit a task visually in the Gantt chart, or with one or more tasks selected in the task outline, use the Task Inspector to edit their details.
Connecting Tasks with Dependencies
When a task must be completed before another can begin, a dependency exists between them. Charting dependencies in your project is a key part of understanding the critical path of tasks that leads through to its successful completion, on time and within budget.
Using the Gantt chart in Task View, you can represent the relationships between tasks with dependency lines. A dependency line is drawn from the beginning or end of one task (or group, or milestone) to the beginning or end of another.
When you create a dependency, the dependent task automatically reschedules itself to respect the dependency. With further changes to the schedule and leveling, the tasks continue trying to follow the dependencies. If a dependency becomes impossible or you manually cause a task stop obeying its dependencies, a violation occurs, which can be resolved with the Violations window.
There are a few ways to connect tasks:
- Select two or more tasks in the outline view or the Gantt chart, then click the Connection toolbar button to create a Finish to Start dependency between each subsequent task.
- Select two or more tasks in the task outline or the Gantt chart, then click the triangle in the corner of the Connection button—or click and hold the Connection button—to summon a menu of dependency types; choose the type you want.
- Put the mouse pointer over a task bar in the Gantt chart, then drag one of the arrows that appears at the beginning or end of the bar. It becomes a dependency line, which you can then drop onto the start or end of another task, group, or milestone. Whether you drag from the start or the end of the prerequisite task, and whether you drop onto the start or end of the dependent task, determines the type of dependency.
-
In the Dependents or Prerequisites columns of a task, type a dependency or prerequisite code. These codes combine the IDs of the tasks involved and the type of dependency like so:
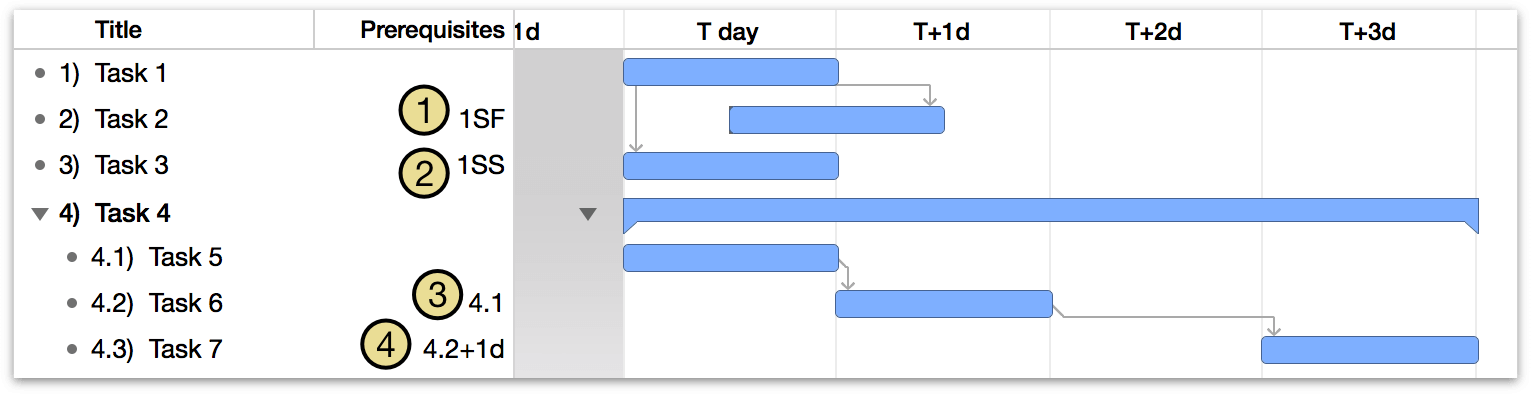
- A Start to Finish dependency from task ID 1
- A Start to Start dependency from task ID 1
- A Finish to Start dependency from task ID 4.1. (FS is the most common type of dependency, so a task ID by itself without any letters is assumed to be FS.)
- A Finish to Start dependency from task ID 4.2, with a lead time of 1 day.
Types of Dependencies
OmniPlan supports four types of dependencies that describe the ways in which tasks relate to one another.
- Finish→Start
- The first task must end before the second task can start; the tasks must not overlap except at the instant the first one ends. This is the most common type of dependency, and the kind that you get when you connect two selected tasks by clicking the Connection button in the toolbar.
- Finish→Finish
- When the first task ends, then the second one can end; the tasks may overlap.
- Start→Start
- Once the first task has started, the second one can start; the tasks may overlap.
- Start→Finish
- Once the first task starts, the second one can finish; the tasks must overlap at least at the instant the first one starts.
Showing Scheduling Influences
If you find yourself wondering if anything else is relying on a task’s completion before it can begin, or why a certain task hasn’t started yet despite yesterday’s start date (perhaps the two are related!), select the task and choose View ▸ Show Scheduling Influences (Option-Command-?) to reveal all of the reasons for a task’s current scheduling.

A popover menu appears attached to the task in the Gantt chart that includes a list of the factors affecting the item’s scheduling. Clicking the arrow to the right of a scheduling influence in the popover takes you directly to the task, group, or other constraining factor so you can deal with it as necessary.
Creating Hammock Tasks
A hammock task is one in which the duration is dependent on both when the previous task ends, and the next task starts. This type of task is useful when facing a hard deadline and deciding what can be compressed if the project is running behind schedule, or if external factors influence when parts of the project must happen.
For example, if you were to prepare a written document, the time allotted for editing would vary depending on the completion of the document and its due date.
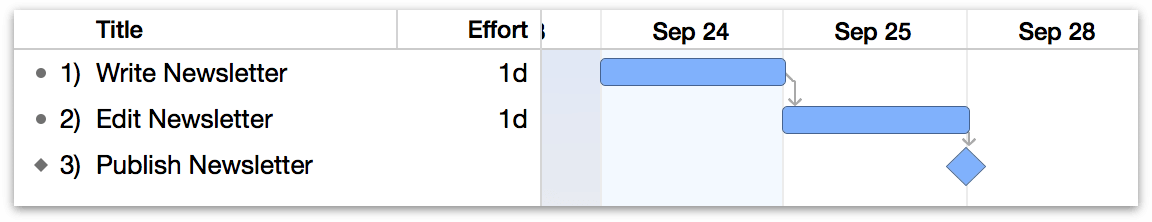
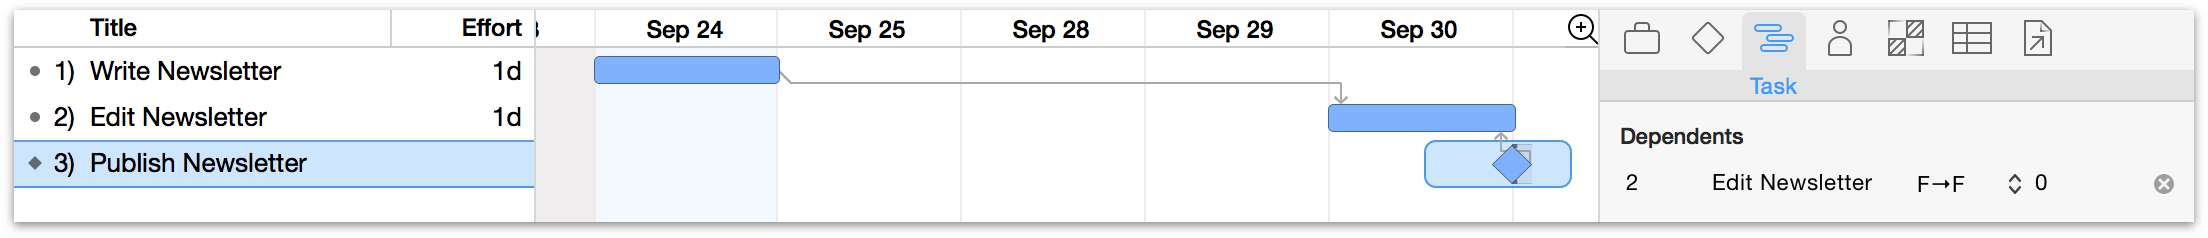
Using that scenario, let’s create an example hammock task. Our starting point is a set of two tasks and a milestone connected by Finish→Start dependencies: Write Newsletter, Edit Newsletter, and Publish Newsletter.
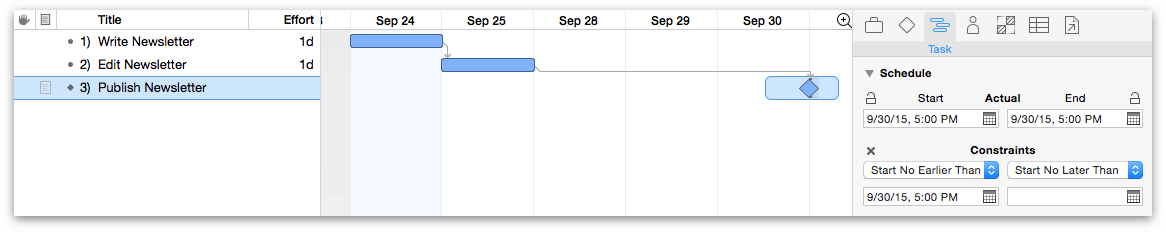
We want to publish the newsletter on October 1st, so we set the Start No Earlier Than date of the milestone to reflect that.
Next, we change the Finish ▸ Start dependency from Edit to Publish to one indicating that editing finishes when publishing starts. Because Publish Newsletter is a milestone rather than a task its start and end dates are equivalent, so this dependency is Finish ▸ Finish (if publishing were a task, this would be a Start ▸ Finish dependency instead).
Note that because this dependency is directional, for OmniPlan to understand the relationship you’ll want to select the milestone and drag a dependency arrow to the Edit task rather than choosing the dependency type from the Dependencies section of the Task inspector.
With our dependencies set up properly, the final step in setting up our hammock task is to select it and choose Hammock as the task type from the Task inspector.
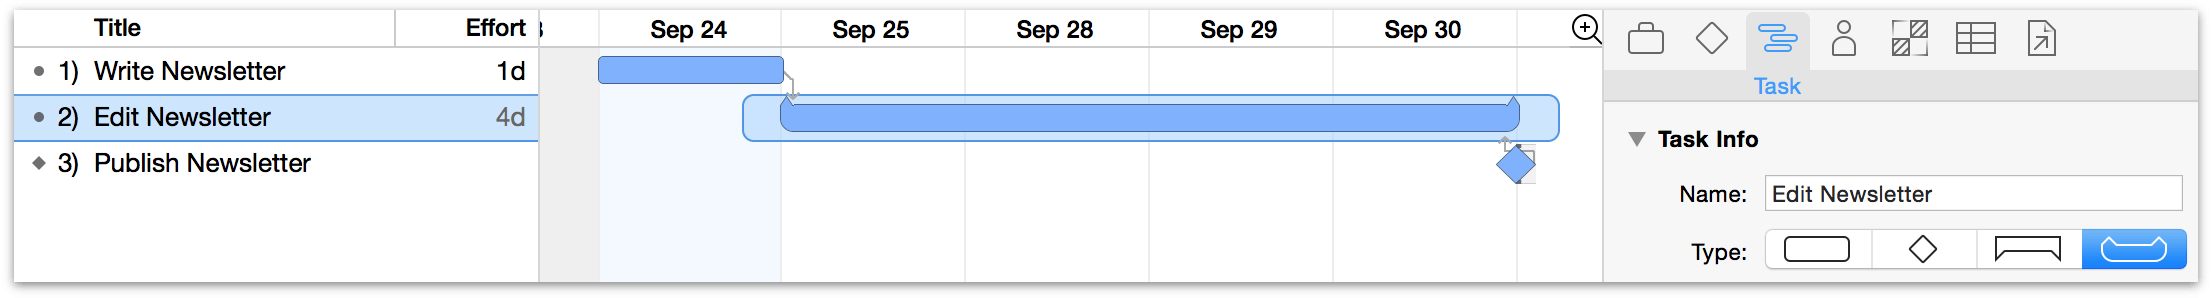
Now, if writing the newsletter takes longer than planned, the duration of the editing task will diminish to respect the needs of the tasks on either side.
Splitting Tasks
Whether because a key collaborator is on vacation or another part of the project has taken priority, suspending work on a particular task can be very helpful. When you want a resource or team member to devote time to something other than the task they’re currently assigned to, splitting the task into parts around the “time out” period is an ideal solution.
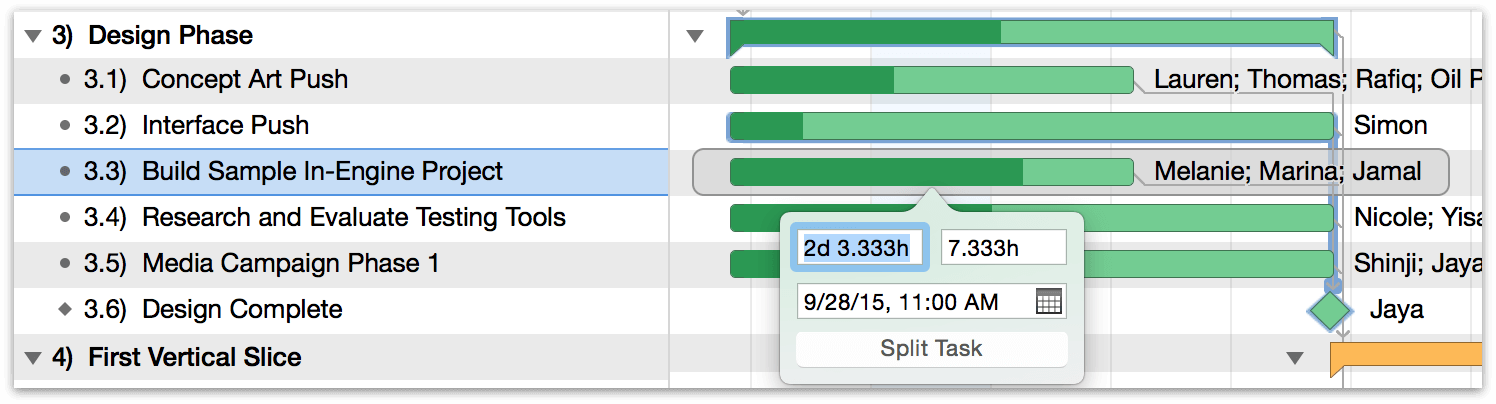
To split a task:
- Select the task in the outline.
- Choose Structure ▸ Split Task (Option-Command-S).
- In the popover, adjust the duration of both sides of the split, choose the date and time you want the task to resume after the break, and click the Split Task button; the task is split for later completion.
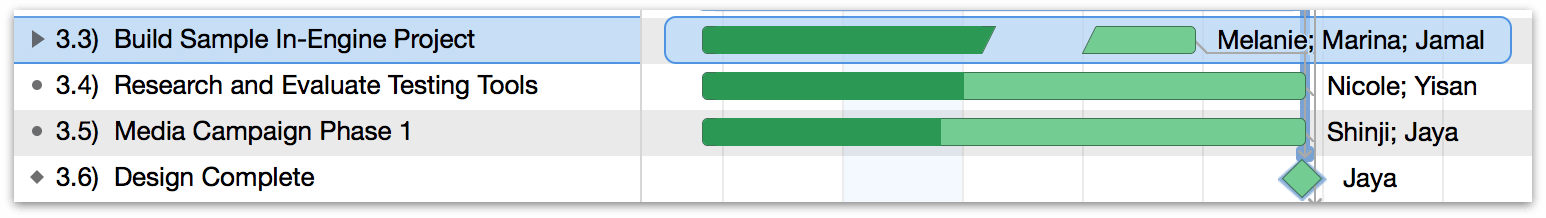
To rejoin a split task, click on one of its parts and drag it to the other. The two segments will merge back into a single task on the Gantt chart.
After splitting a task it’s always a good idea to level to be sure the split is the most efficient way to manage the task at hand given the project’s available resources and time constraints.
A split task may mysteriously re-merge after leveling. If this isn’t what you want, make sure that Allow Splitting is checked in the leveling dialog.
Grouping Tasks
There are a few ways to approach grouping, depending on whether you’re starting with an existing set of items you want to add to a group, converting an existing item to a group, or creating a brand new group task.
-
To convert a task to a group with new child tasks inside it:
- Select the item you want to grant sub-tasks.
- Choose Structure ▸ Add ▸ Add Child Task (Command-}).
- The selected item becomes a group with one child task.
- Add more tasks to the group by pressing Return.
-
To bring tasks into a group within a peer task above them in the outline:
- Select the items to be grouped.
- Choose Structure ▸ Indent (Command-]) or Tab, depending on your preference setting).
- The items become children of the item above them in the outline.
-
To bring tasks into a newly created group:
- Select the items to be grouped.
- Choose Structure ▸ Group (Command-Option-L).
- The selected items become children of a newly created group.
-
To create a new group with nothing inside it:
- Choose Structure ▸ Add ▸ Group.
- A new, empty group item is created.
- To add items inside the group, open it by clicking the disclosure triangle next to the group name (or its bar in the Gantt chart), and with the group selected, create new tasks as normal.
Characteristics of Task Groups
A task group determines most of its characteristics from the tasks it contains, rather than having characteristics of its own. A group’s characteristics can be viewed (and in some cases defined) in the Task inspector.
- Name — Of course, a task group has its own name.
- Type — A task group can contain tasks, milestones, and other groups, but its own type is always group. (An empty group has no effort or duration and can serve as a placeholder.)
- Effort — The effort of a group is the sum of the effort of all tasks it contains.
- Duration — The duration of a group is the amount of time between the beginning of its first task and the end of its last task, not the sum of the durations of all its tasks. If a group contains three one-hour tasks all happening at the same time, the group has a duration of one hour, not three hours.
- Scheduling — A group can have a specific start date, which can then affect the start dates of tasks inside it.
- Dependencies — A group can have dependencies just like a regular task.
- Resource Assignments — If you assign a resource to a task group, the resource gets assigned to all tasks in the group. The group itself can’t have any resources assigned.
Visual Planning in the Gantt Chart
Many attributes of tasks can be edited directly with the mouse in the Gantt chart. When you put your mouse pointer on a task bar, controls appear for manipulating the task.
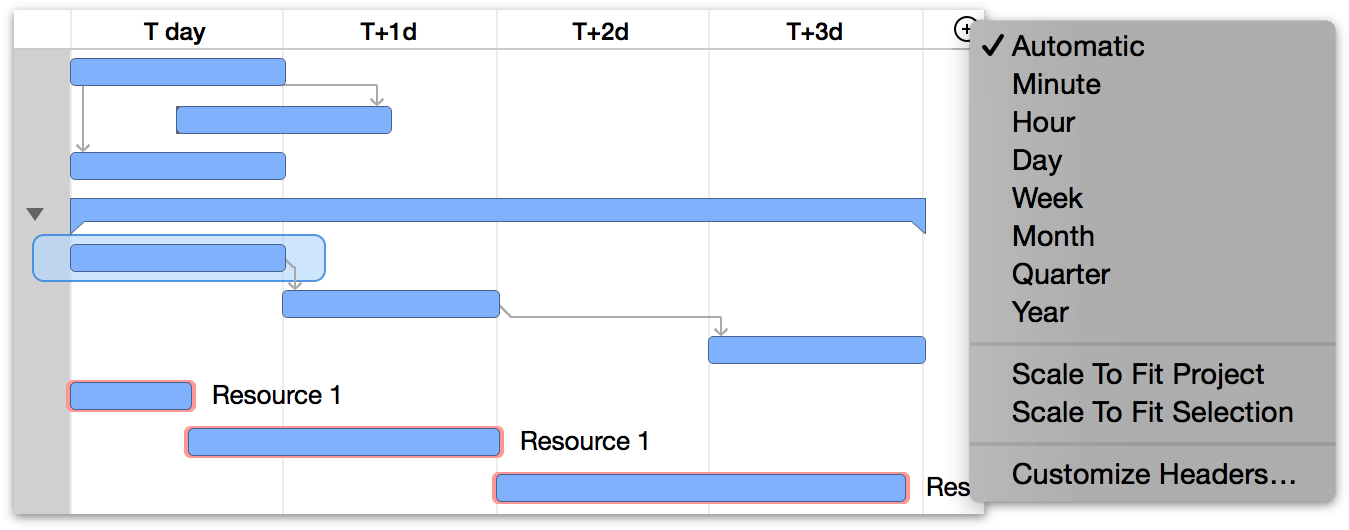
Changing the Chart’s Scale
You can zoom the Gantt chart (and the resource timeline) in and out using the Magnifying Glass menu in the upper-right corner of the chart, or by clicking in the chart’s header area and dragging left or right, as if you were resizing a column.
Changing the Duration of a Task
To change the duration of a task:
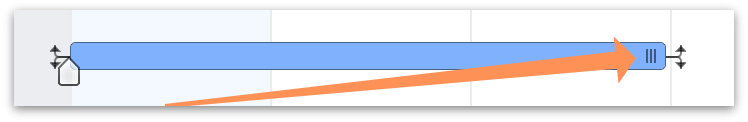
- Grab the traction pad at the right end of a task bar.
- Drag the end of the bar left or right to change the task’s duration. You can hold Shift while dragging to snap to round values.
Adjusting Task Completion
To adjust how much of a task has been completed:
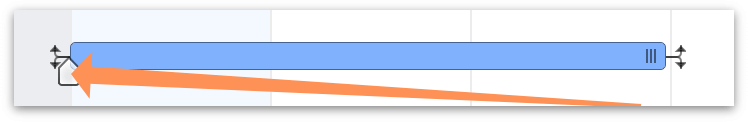
- Click the white, house-shaped handle on a task bar.
- Drag the handle to update the completion.
Drawing Dependency Lines
To draw dependency lines between one task and another:
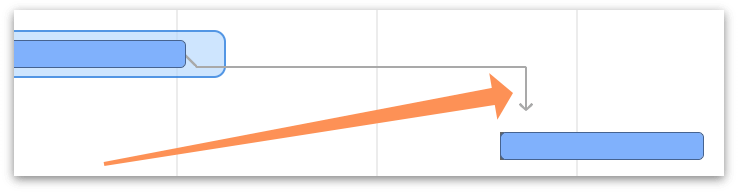
- Select a task bar in the Gantt chart to see its dependency arrows.
- Drag a dependency arrow from the beginning or end of one task.
- Drop the arrow onto the beginning or end of another task to create a dependency.
Drawing Constraints on Tasks
To draw constraints on tasks:
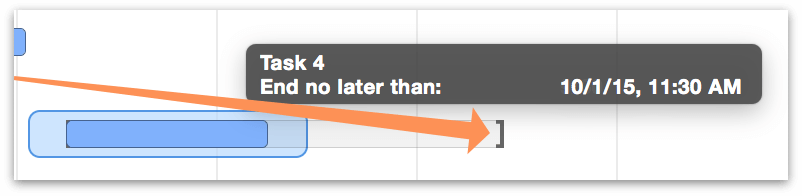
- Hold Shift and drag from the beginning or end of a task to create a start or end constraint.
- Hold Shift and double-click an existing constraint to remove it.
A start no earlier than constraint can also be set by selecting a task and dragging it along the timeline.
Locking Start or End Dates
To anchor a start or end date to a fixed point in time:
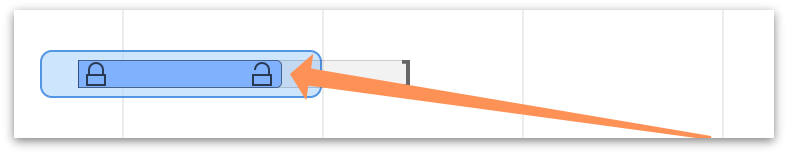
- Command-click a task’s start or end to lock or unlock it.
Coloring Off Hours
To have the Gantt chart display an alternate background color for days when work is usually not occurring, choose View ▸ Non-Working Time and pick the submenu item applicable to your situation: None, Holidays, Weekends, or All.
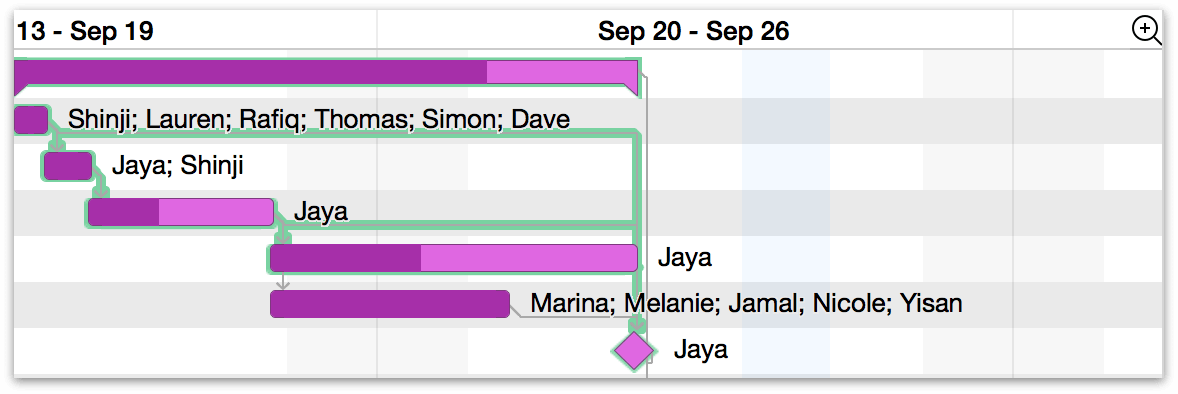
Highlighting off hours in this way gives better feel for when work is actually getting done, and helps explain why some bars in the Gantt chart look particularly long when the length of the tasks is not.
You can pick a color for the appearance of off hours in Styles View, and you can customize the hours themselves in Calendar View.
View Options in Task View
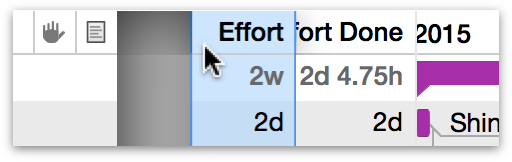
The view options in Task View have two primary roles. The first to control which optional columns are displayed in the task outline, and the second is to control which of those column values are applied as labels on either side (and on top of) bars in the Gantt chart.
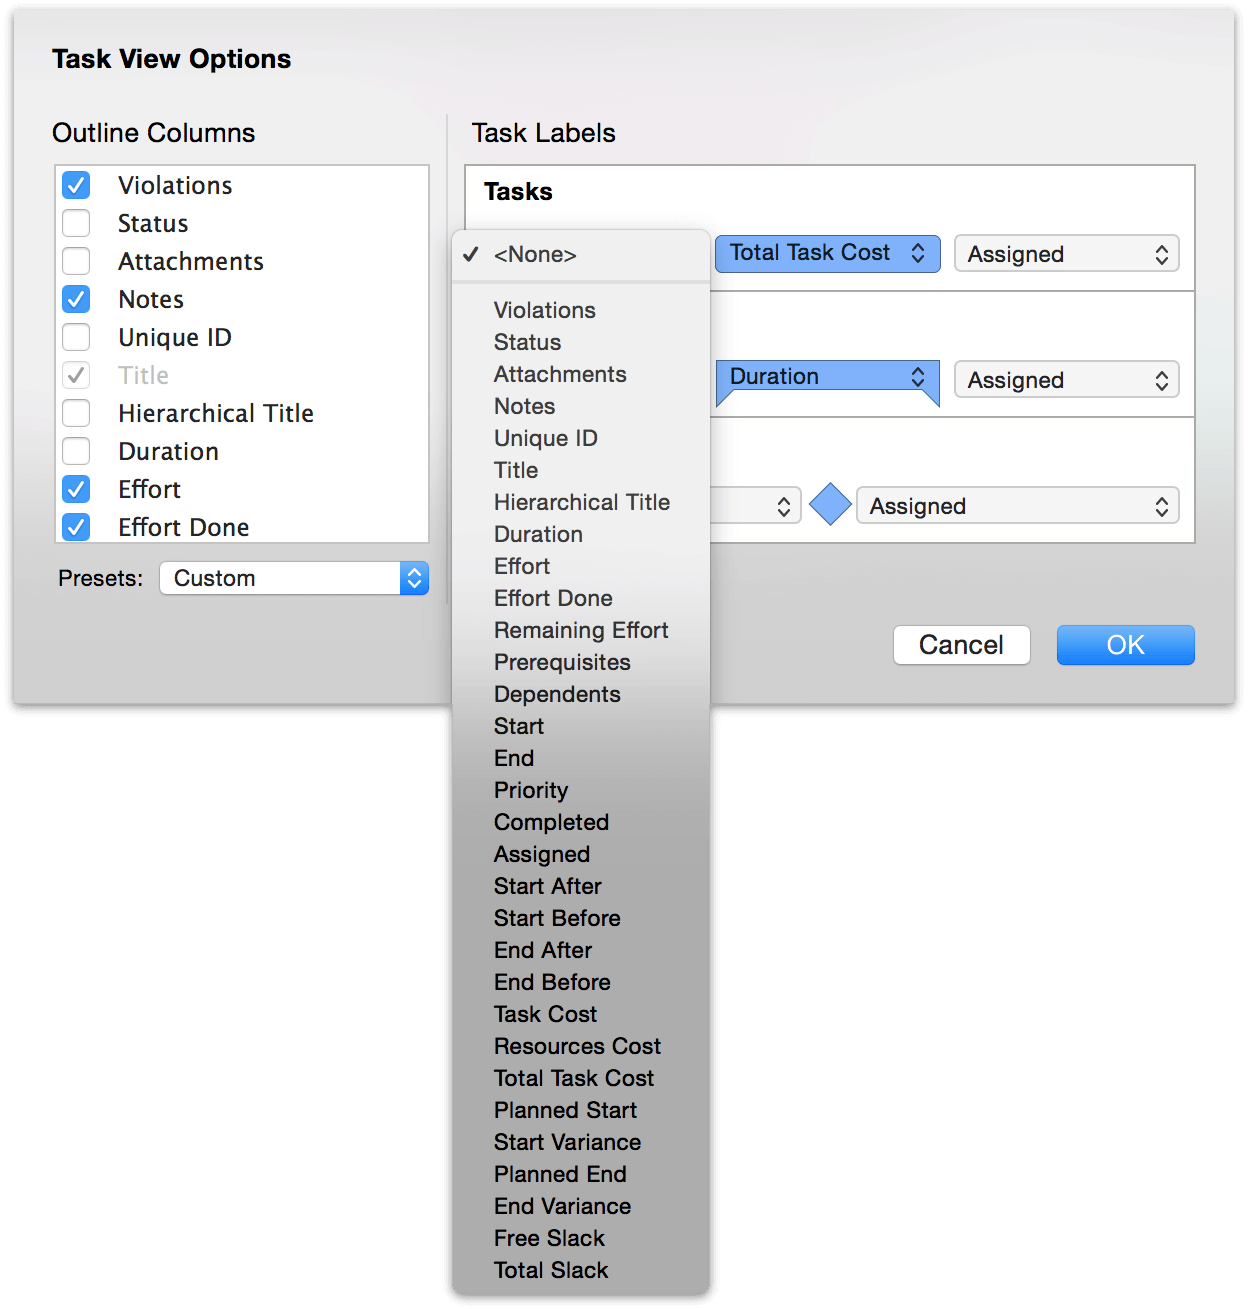
Choose View ▸ View Options (Command-J) to open view options, where you’ll find two sections: the left side that governs outline columns, and the right side with dropdown menus for label locations relative to tasks, groups, and milestones.
To quickly add optional columns to your outline, Control-click on the existing column header. The full list of available columns will appear as a contextual menu, where you can choose the ones you’d like to show or hide.
Data in the optional columns corresponds to tasks on the same row in the Gantt chart. Some of the values in the columns (such as Task Cost) can be edited directly in the outline; others (such as Total Cost) are calculated automatically. Generally, values you can edit in the outline correspond to editable fields in the Task and Resource inspectors.
Use the arrow keys, or Tab and Shift-Tab (depending the options you’ve chosen in OmniPlan’s preferences), to move between cells.
Drag column titles left and right to rearrange the columns.
You can sort the selected items in the outline, or all items (if nothing is selected), by using the Sort commands in the Structure menu.
If you’d like to add custom columns to your task outline (or if you’re seeing unexpected entries in the list), note that keys you set up for tasks using the Custom Data inspector become available as columns in the outline.
The following list describes the more complex optional columns that can be displayed in the outline of Task View, or as data fields attached to items in the Gantt chart.
- Violations
- This column displays an icon for each task that has a violation. You can click the icon to summon the Violations window and see what the problem is.
- Status
-
This column shows alarm clock icons for tasks that are incomplete and due in the next few days, or in the past. Note that these icons won’t appear if your project has an undetermined start date in the Project Info section of the Project inspector. Each color of clock has a meaning:
- Almost due (green): this task is incomplete and due in the next 3 work days.
- Due (yellow): this task is incomplete and due in the next work day.
- Past due (red): this task is incomplete and past due.
- Priority
-
You can manually set a priority on a task, to control the order in which tasks are leveled. Priority can be any integer, so you are welcome to decide on the range (1 to 3, 0 to 999, or whatever you like). During leveling, if two tasks are assigned to one resource at the same time, the task with higher priority (expressed as a larger positive number) gets to use the resource first.
When assigning priorities (regardless of the range chosen), the highest priority task is the one with the largest numerical integer assigned. Priority descends from the largest integer, and negative integers are of lower priority than positive.
- Assigned
- This column lists the resources that are assigned to the task.
- Attachments
- You can click the paper clip icon Attachment icon in the selected row to see a menu of the item’s attachments, or to link to a file if there isn’t one linked yet. Rows with links to files show a paper clip icon even when they are deselected.
- Notes
- Store extra text about an item with this column. To edit the selected item’s note, press Command-’ or click the Note icon that appears in the column.
- Once an item has a note, you can move in and out of the note field by pressing Command-’ (which hides the note after you stop editing it). Rows with notes show a note icon even when they are deselected.
- The font style of notes can be set up in Styles View.
- Unique ID
- The unique ID is a number assigned to each task to identify it unambiguously, even if its name or position in the outline changes. A unique ID won’t ever change, and each new task or resource you create gets a new unique ID number. These numbers are useful for matching up items when you are importing and exporting projects between OmniPlan and other applications.
- Free Slack, Total Slack
- These columns display information derived from how the project is set up. Slack is the amount of time a task can be delayed before it must be completed for a subsequent task to begin, or for the project to be completed on time; free slack refers to slack between individual tasks and their subsequent tasks, while total slack refers to the time before an individual task would have an effect on the duration of the project as a whole.
Earned Value Analysis (PRO)
OmniPlan 3 Pro offers several new custom column types useful for tracking and managing the budget and progress of your project. Taken together, they represent a full implementation of the Earned Value Analysis project management technique (also known as earned value management, or EVM). We’ll be referring to it as earned value analysis (or EVA) throughout OmniPlan and throughout this manual.
Since the value of EVA lies in the comparison of the actual state of your project with its initial plan, the first thing we need is a baseline. If you don’t have one set up yet, you’ll want to do that now. If you’d like to simulate a project state earlier or later in the project, choose Project ▸ Set Current Editing Date and enter the desired date.
If you compare with a baseline set at the beginning of your project, many EVA column values won’t appear. This is because you’d essentially be dividing by zero (the current actual cost at that baseline) to generate the cost performance index, and earned value is only relevant in the context of other factors affecting the project in progress. For a preview of the planned costs of your project, try using the Total Task Cost column instead.
With a baseline set, we can start building out the attributes of tasks and resources that EVA requires to deliver meaningful results. The original and derived values represented by the suite of EVA columns can be dizzying to take in all at once, so let’s break it down into some smaller pieces.
We’ll begin by enabling some familiar, pre-existing columns, and making sure they’re populated with relevant data.
In Task View:
- Effort — Any task you create is going to require some amount of effort to complete, so this one’s easy.
- Effort Done — EVA tracks progress compared to the baseline, so updating the amount of work done on tasks is an important component of calculating value.
In Resource View:
- Cost/Hour or Cost/Use — Tracking how much money is being spent on effort done is another key component of EVA. If your workers are salaried, you’ll want to compute their wage as an hourly value for use here.
With these set up, we can begin putting the EVA columns to use. This first group of columns tells us about the amount of money we’ve spent on tasks to this point in the project, and compares that with our initial budget.
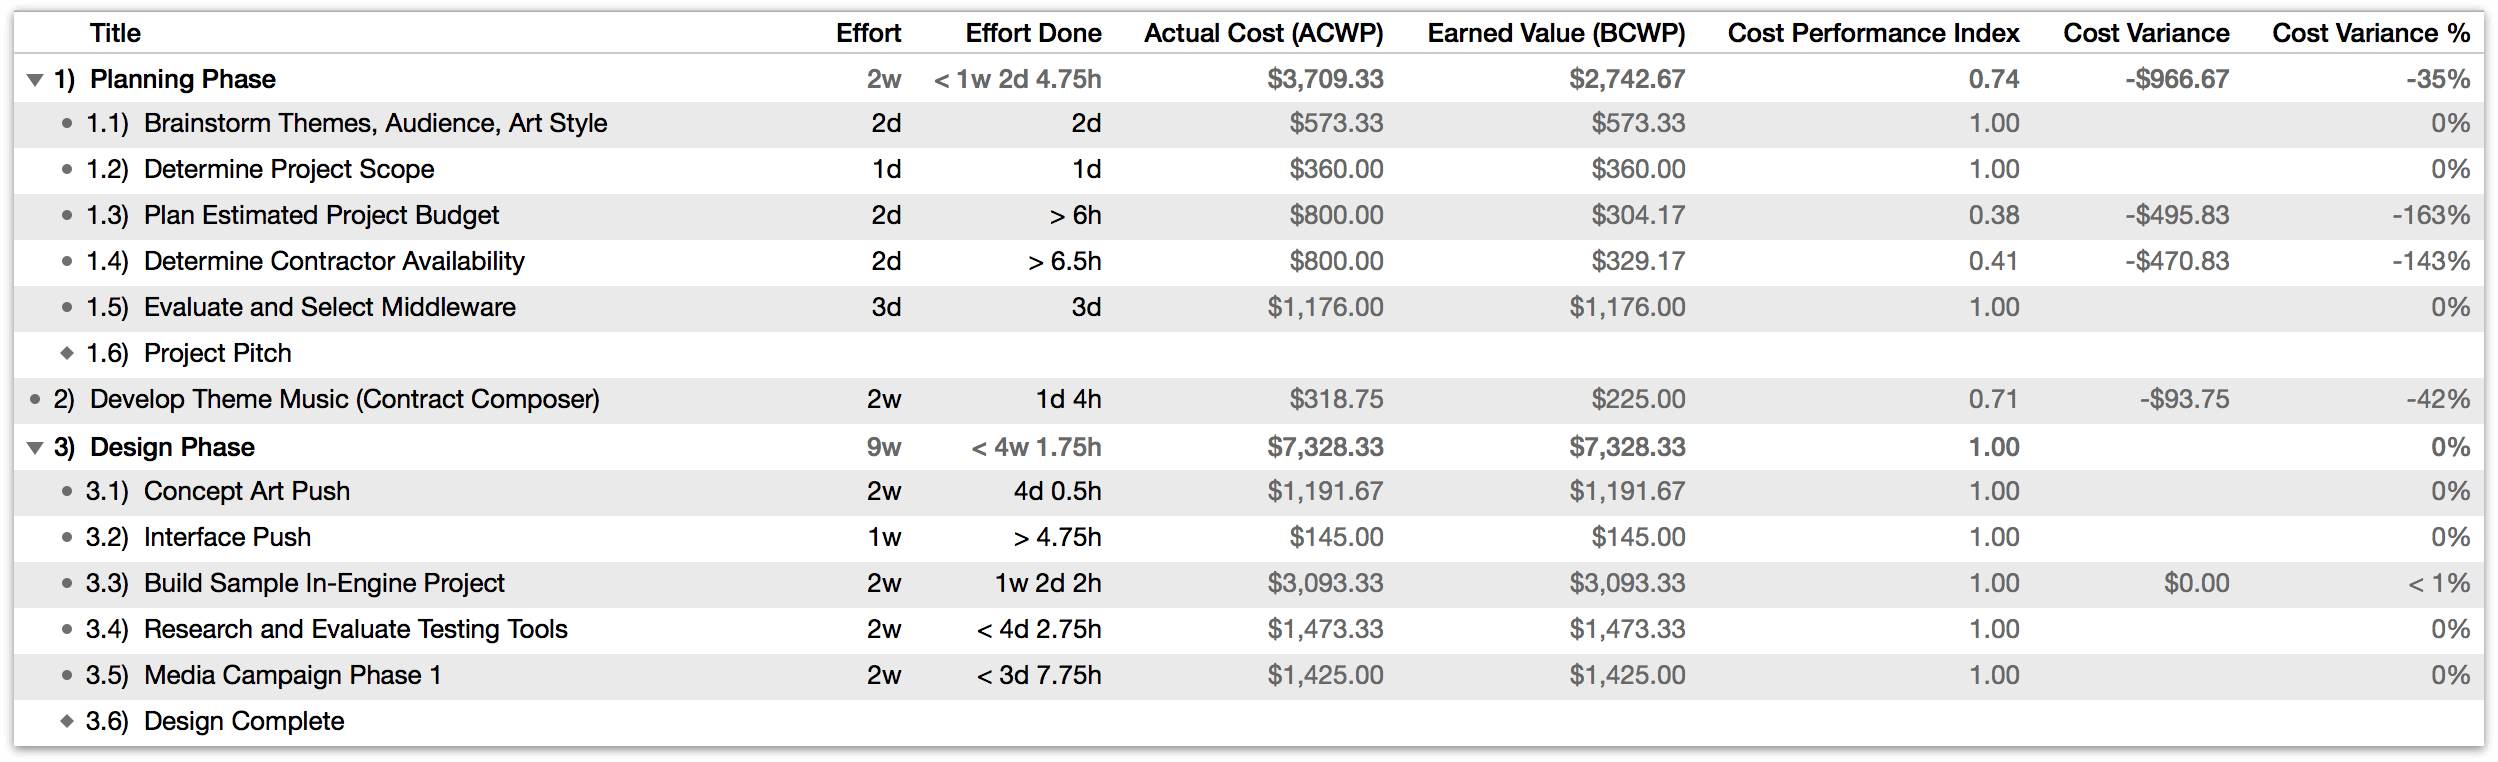
- Actual Cost (ACWP)
- This column is pretty straightforward; it’s the actual cost of work performed up to the current date. In OmniPlan terms, this represents the amount of effort completed by resources assigned to a task, multiplied by their costs. If two 8-hour days of effort are finished and a resource is contributing at 100% units and efficiency at a Cost/Hour of $50, they’ll contribute $800 to the actual cost.
- Earned Value (BCWP)
- The earned value, or budgeted cost of work performed, is another pretty simple calculation that represents the planned budget for the amount of work done on the project at this point (“this point” being the baseline used for analysis). This value is determined at the start of the project by effort assignments and resource costs.
- Cost Performance Index (CPI)
- The Cost Performance Index is reached by dividing the task’s earned value by its actual cost. This is a handy way to see, at a glance, whether the task is over- or under-budget: values higher than 1 are under budget, values lower than one are over budget, and 1 exactly means the project’s budget is right on track.
- Cost Variance and Cost Variance %
- Cost Variance is the concrete number that gives us the good (or bad) news about how much a task is under or over budget. The Cost Variance column is expressed as a currency amount relative to the earned value, and the Cost Variance % column is (as you’d expect) expressed as a percentage of the earned value. Notably, any time the planned and actual budgets agree (the cost performance index is at 1), these columns will be empty.
The next group of EVA columns describes the status of the project relative to the planned schedule.
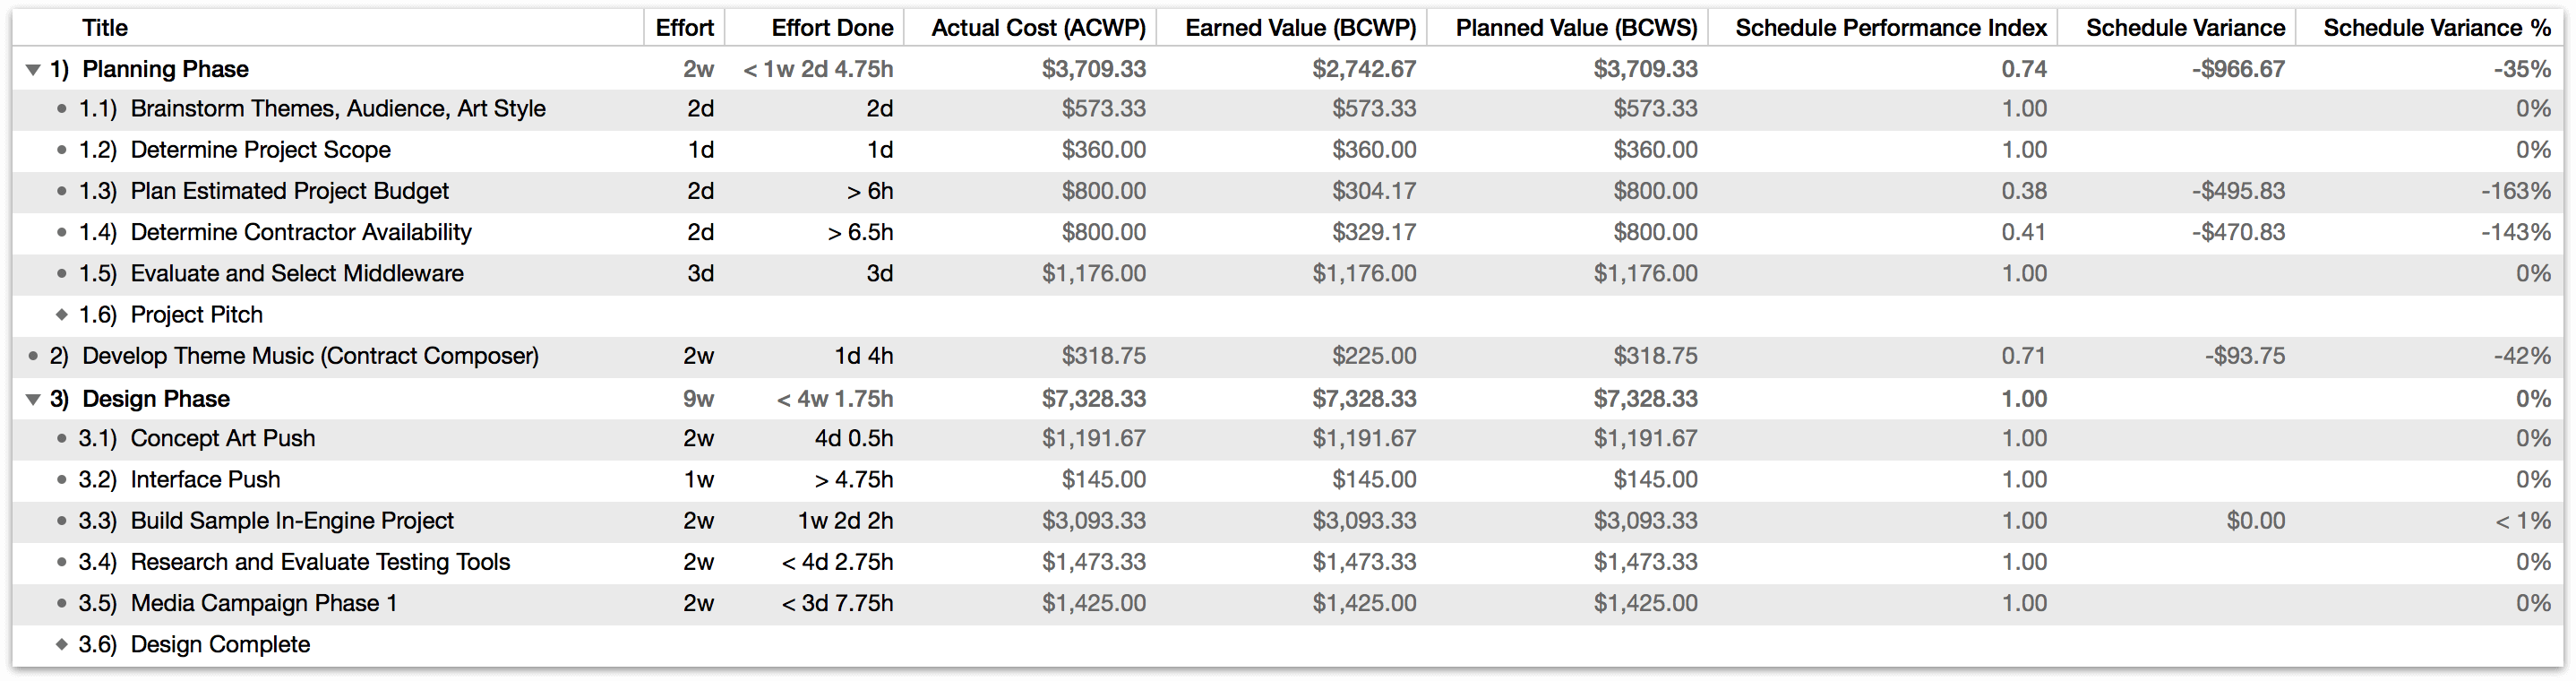
- Planned Value (BCWS)
- Planned Value, or Budgeted Cost of Work Scheduled, lists the expected cost of work-to-date as planned in the project’s initial schedule. This is derived from the planned costs of tasks and resources, along with the baseline and editing date chosen.
- Schedule Performance Index (SPI)
- The Schedule Performance Index is derived by dividing earned value by the planned value. Like the cost performance index, it’s expressed as a number greater or less than one; higher values represent being ahead of schedule, while values less than one represent being behind schedule.
- Schedule Variance and Schedule Variance %
- Schedule Variance is the value that tells us in concrete terms how far we are ahead of — or behind — schedule. It subtracts planned value from earned value, giving us an amount in currency that represents the difference between how much we should have been paying for work-to-date, versus how much we’ve actually paid. Schedule Variance % represents this same amount as a percentage.
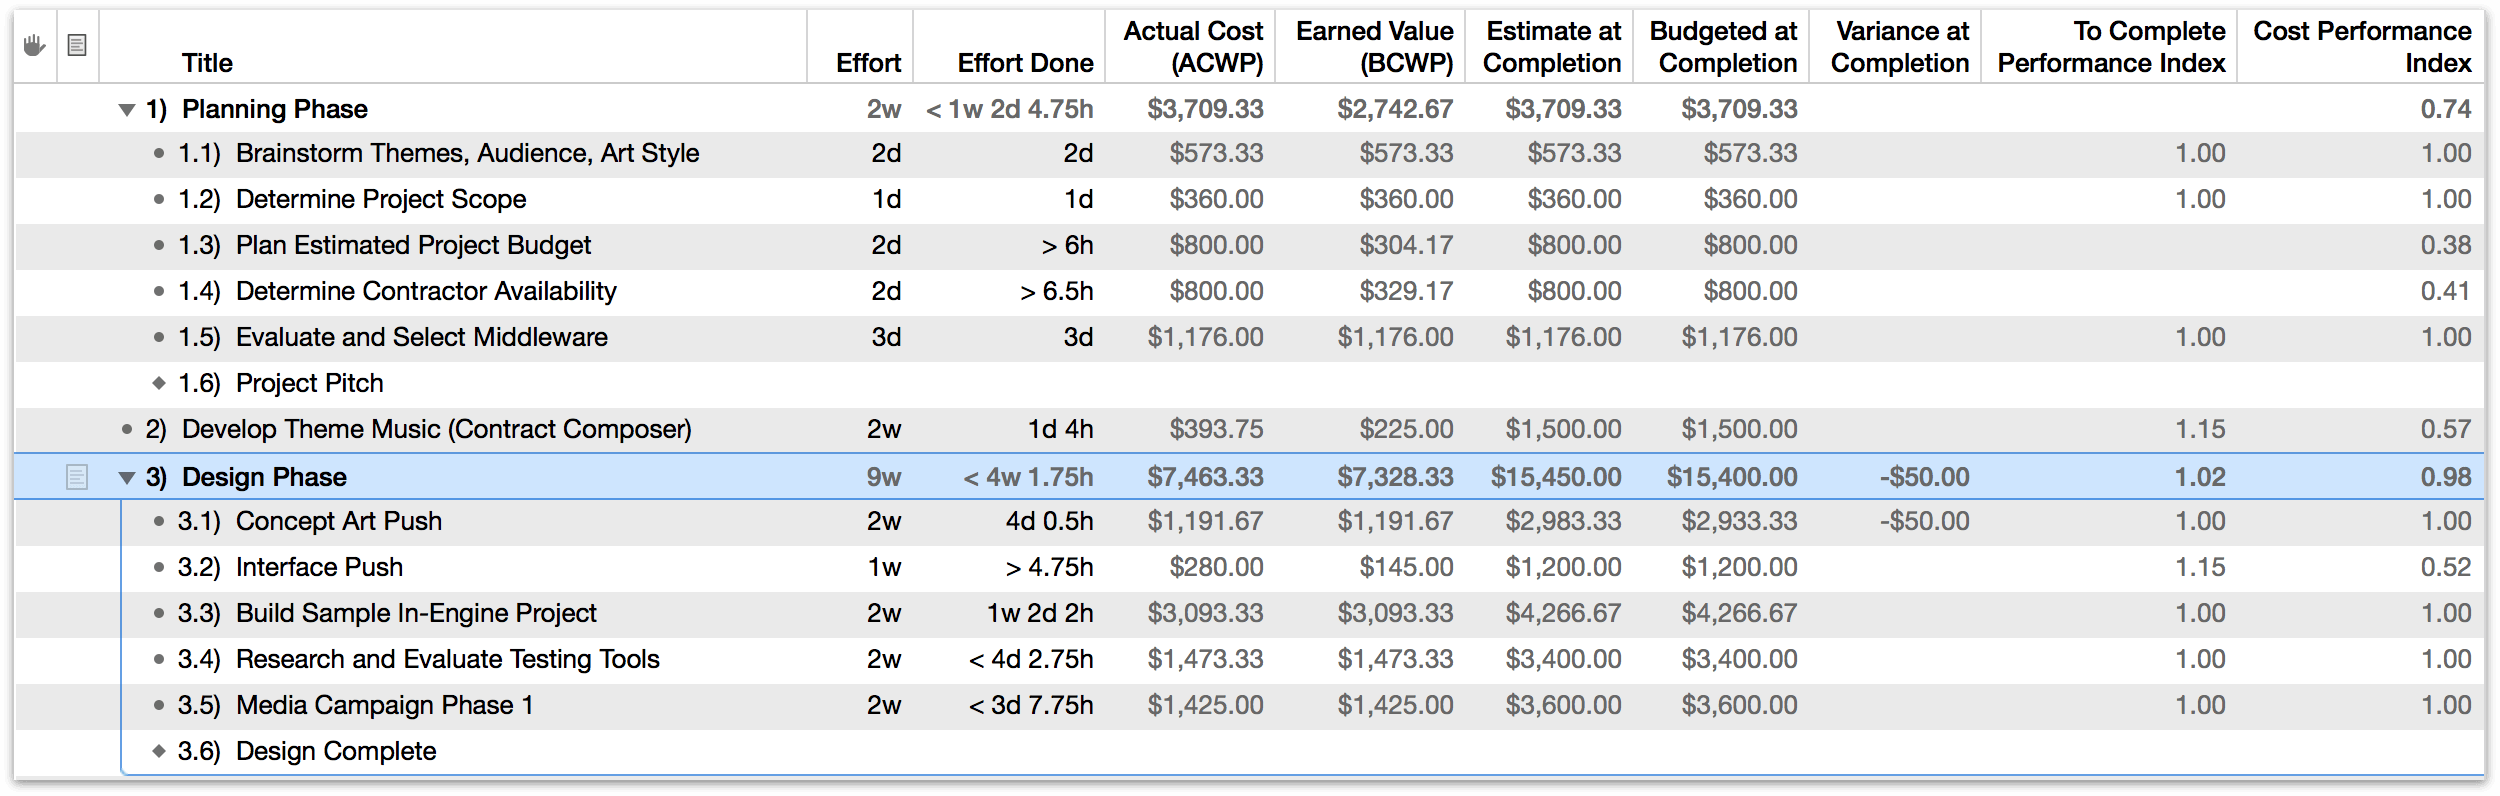
The final group of EVA columns is related to forecasting the budget of tasks at their completion.
- Estimate at Completion (EAC)
- This value represents the estimated actual final cost of the task, as work progresses. Before the start of the project, EAC is equal to the budget for the task (Budgeted at Completion, below). As the project progresses, EAC and BAC may diverge.
- Budgeted at Completion (BAC)
- Budgeted at Completion represents the initial budgeted cost of all work on the task. If work gets behind schedule or there are cost overruns on materials, the actual cost (and therefore the estimated cost at completion) will rise above the BAC cost.
- Variance at Completion (VAC)
- This column represents the difference between the estimated actual (final) cost of completion and the budgeted (initial) cost of completion of the task. Expressed as a currency amount, a negative VAC denotes a cost overrun, while a positive VAC represents a budget surplus.
- To Complete Performance Index (TCPI)
- The To Complete Performance Index is a bit unique among the EVA columns in OmniPlan, in that it tells you about the state of your project’s budget and schedule by way of a recommendation. The TCPI represents the cost performance index (CPI, explained above) that you need to maintain for the task, from your current editing date, in order to be on budget. A value other than 1 describes a recommended course correction: higher requires some belt-tightening, while lower indicates that there are funds to spare.
As another way to think about EVA, consider the current editing date and the baseline as the x and y axes of a chart whose parameters you can use to set up simulated scenarios for your project. The baseline provides a y-axis time anchor for your project’s state of affairs, and the current editing date is a time travel device along the calendar’s x-axis that lets you consider that snapshot as if the project’s progress to date had happened earlier, or all progress froze and the project stood still until some point in the future.
Filtering the Task Outline
When you want to focus on a specific aspect of your project, you can view a subset of its tasks by creating filters for specific criteria. Possible filters include focusing on tasks that were completed in the past week, tasks that are behind the baseline target date by greater than three days, or as in the example below, tasks that are less than 50% complete.
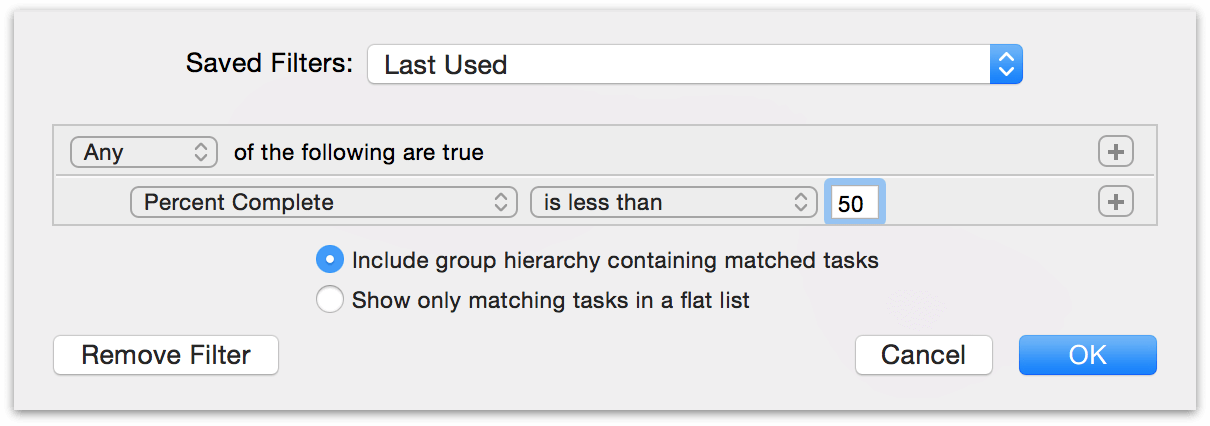
Choose View ▸ Filter Tasks (Option-Command-F), or click the Filter button in the toolbar. A sheet appears for setting up your filtering criteria. You can add as many criteria as you like by clicking the plus icon on the right side of the entry line, and filter the criteria themselves by Option-clicking on the add button to create nested criteria within the filter hierarchy. When your criteria are set up the way you want them, click the Save Filter dropdown menu to save the current filter or restore a previously saved filter. (You can also use the View ▸ Restore Saved Filter menu item.)
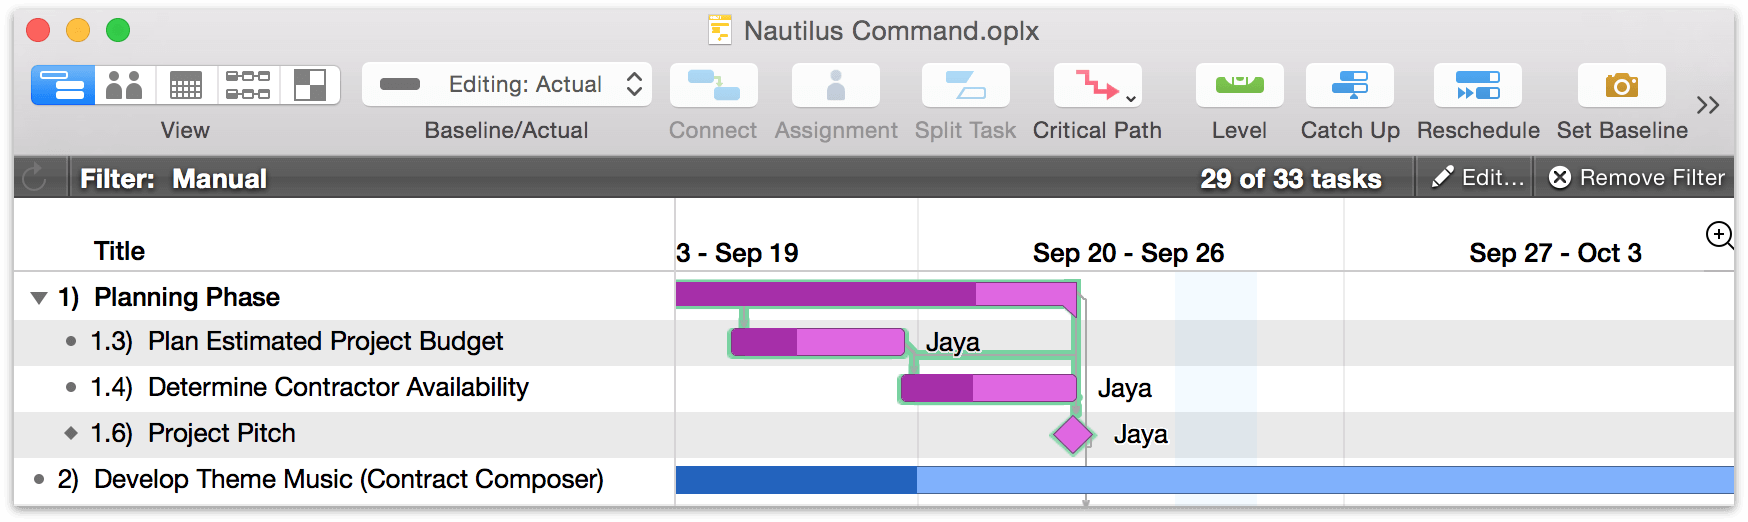
When your filter is set, any tasks which match your criteria remain in the outline, while the rest of the project is hidden away. You can work with the project normally while it is filtered, but you can only edit the visible tasks. While your filter is in use the Filter Bar appears, providing options to refresh, edit, or remove the filter and showing the number of tasks hidden.
Any tasks created while a filter is in place will not have the filter applied to them by default, so they will appear in the task outline (regardless of whether the filter would hide or show them) until the filter is refreshed or reapplied.
If you export or print a project while a filter is on, only the visible tasks are included in the exported file.
When you’re done, choose View ▸ Remove Filter or click the toolbar button again; all of your tasks reappear, no worse for the wear.
Filters are not included when exporting from OmniPlan 3 to the older 1.x version of the OmniPlan file format.